Respected sir
Have u attended Ceinsys tech agm. Can u plz share the q&a discussed in that. As per Instagram they and there subsidy allygro are on a hiring spree.
Thanks and Regards
Respected sir
Have u attended Ceinsys tech agm. Can u plz share the q&a discussed in that. As per Instagram they and there subsidy allygro are on a hiring spree.
Thanks and Regards
@ashish_agarwal Please find the ceinsys AGM transcript here. It is one of the AGMs where there are lot of detailed responses from management. You can simply google like this in the future to find transcripts. The very first link in the results is the link I’ve shared.
Update based on results so far
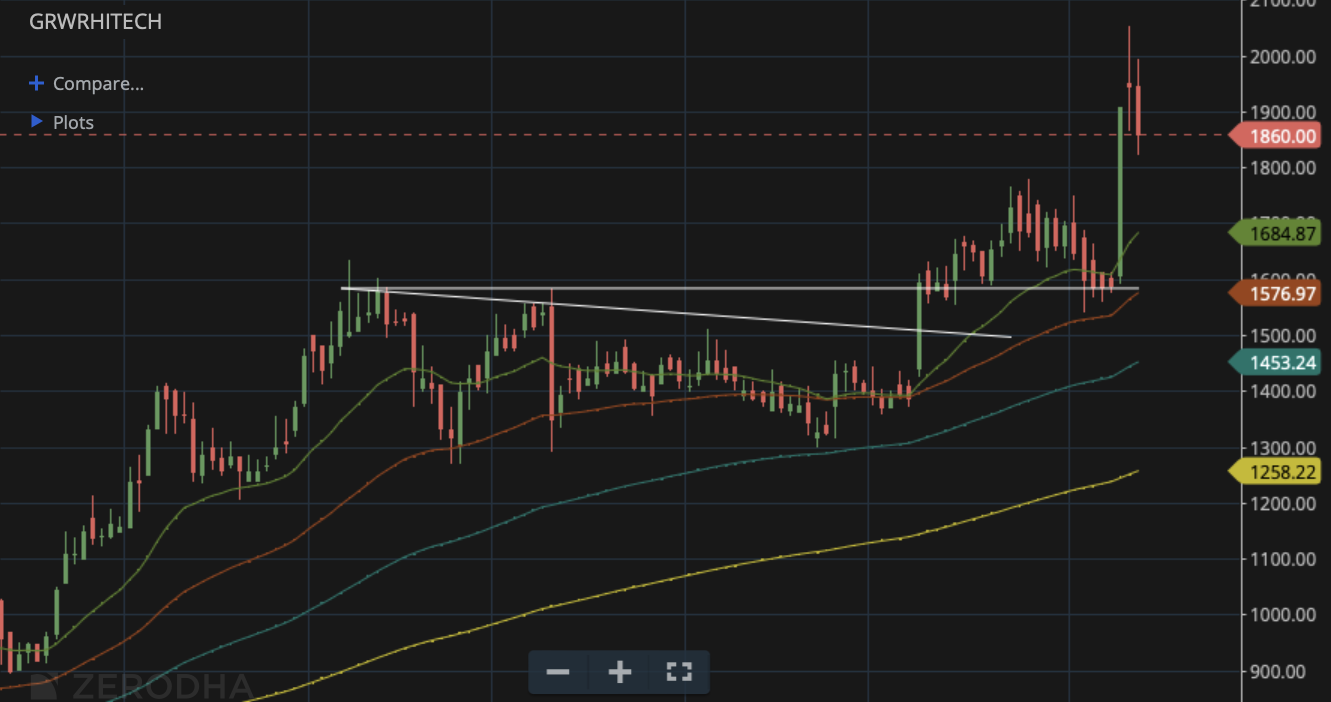
Garware, Daily - Strongest result and broke out with volumes post numbers.
Based on the concall, some of our guesswork came up right. PPF volumes ramping up very well. IPD still a drag but yet company has posted all-time-high revenue and profits. Margins have clear levers for growth above 20% when 1. IPD margins improve in the next 6-12 months 2. Market spends taper off 3. SCF volumes come back in summer.
Management thinks 600 Cr per quarter and so 2400 Cr topline is doable with current production lines which means, operating leverage accruing from fixed costs of production will also contribute to improving margins. No plans for merging GIL or selling Mumbai land but plans seem to be on for selling Aurangabad or Nashik land (don’t remember). A better capital utilisation plan will act as a trigger for re-rating alongside further improvement and sustenance in numbers
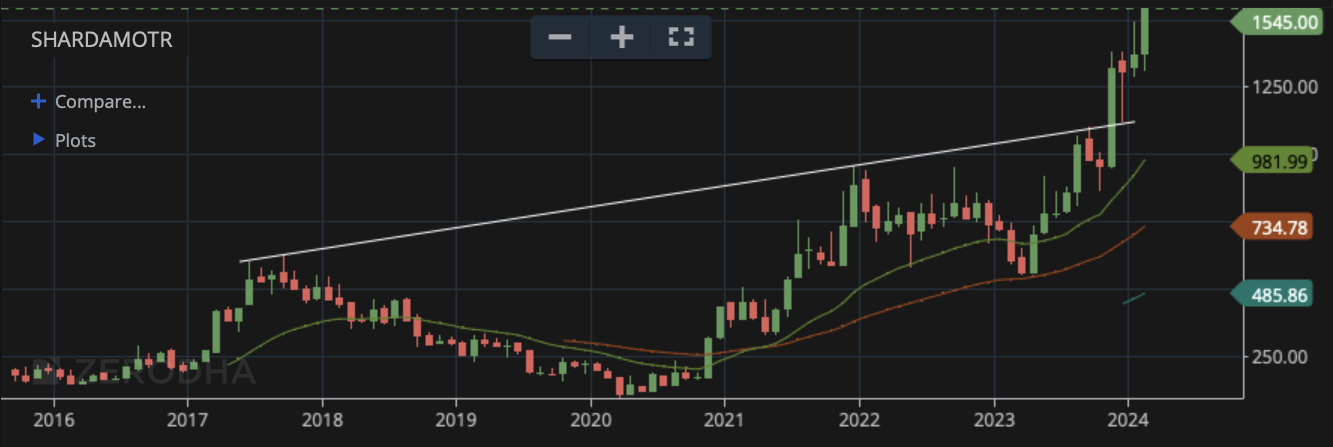
Sharda Motors, Monthly - Three months of sideways movement post breakout.
Results here too have been good. There’s clear volume growth in BS-VI, if we excuse the lack of topline growth due to company reducing catalyst trading and looking at gross profits. Essentially at an absolute level, profits are growing and understandably margins as well, with the trading component removed. Market has been chasing skirt with PSUs and ignoring value stocks like this but hopefully things will turn. One thing to note though is that TREM-V might be delayed to Apr '26. I see it more as an optionality at this point and valuation doesn’t reflect even BS-VI growth at this point. Payouts have got to go up as well and are probably the reason market isn’t getting excited. Hopefully dividends for FY24 would be better.
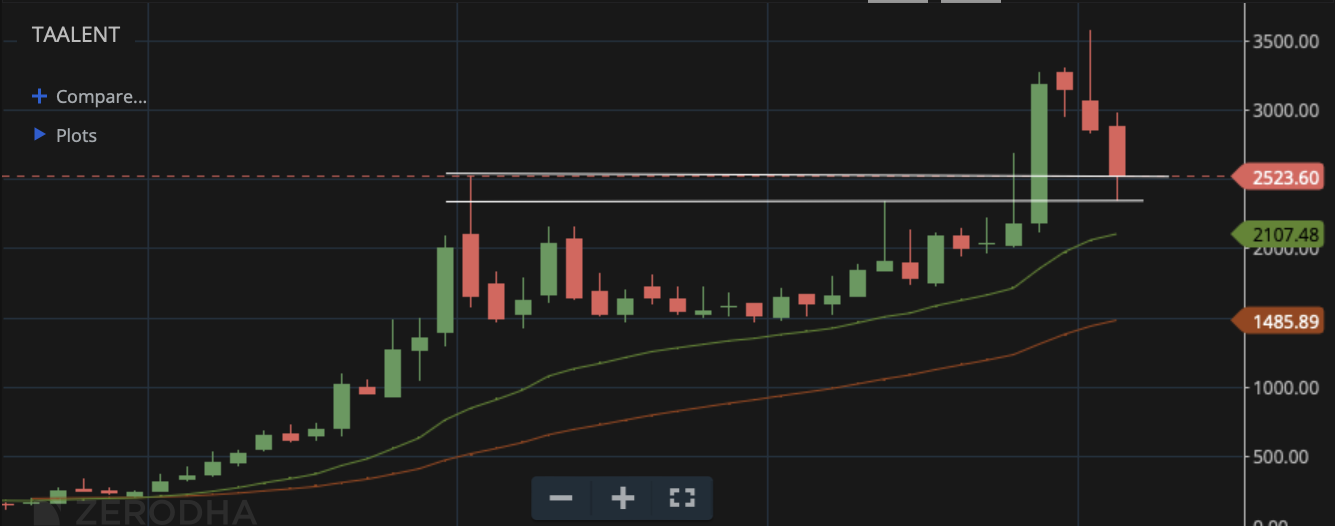
Taal, Monthly - Support from previous monthly tops from '22 and '23. 2400-2500 levels should be strong support here.
Has been the worst result of the lot as margins have continued to be hit despite topline growing. The breakneck hiring done in FY24 (520 to 620 employees) is causing a big drag on margins (employee cost gone up from 22 Cr to 28 Cr per qtr). My thesis was that margins will revert back to 30-33% levels sooner or later. As per the management, they don’t hire when they don’t have projects, so hopefully these people will become billable soon.
It continues to remain cheap, so I intend to hold for another quarter or two since there aren’t many value buys available at this point. On the NCLT side things seem to be progressing well as per latest order from Feb 8.
Disc: Invested in all 3. No recent transactions in any of them. I am not a registered advisor and I write for clarity. Please do your own research
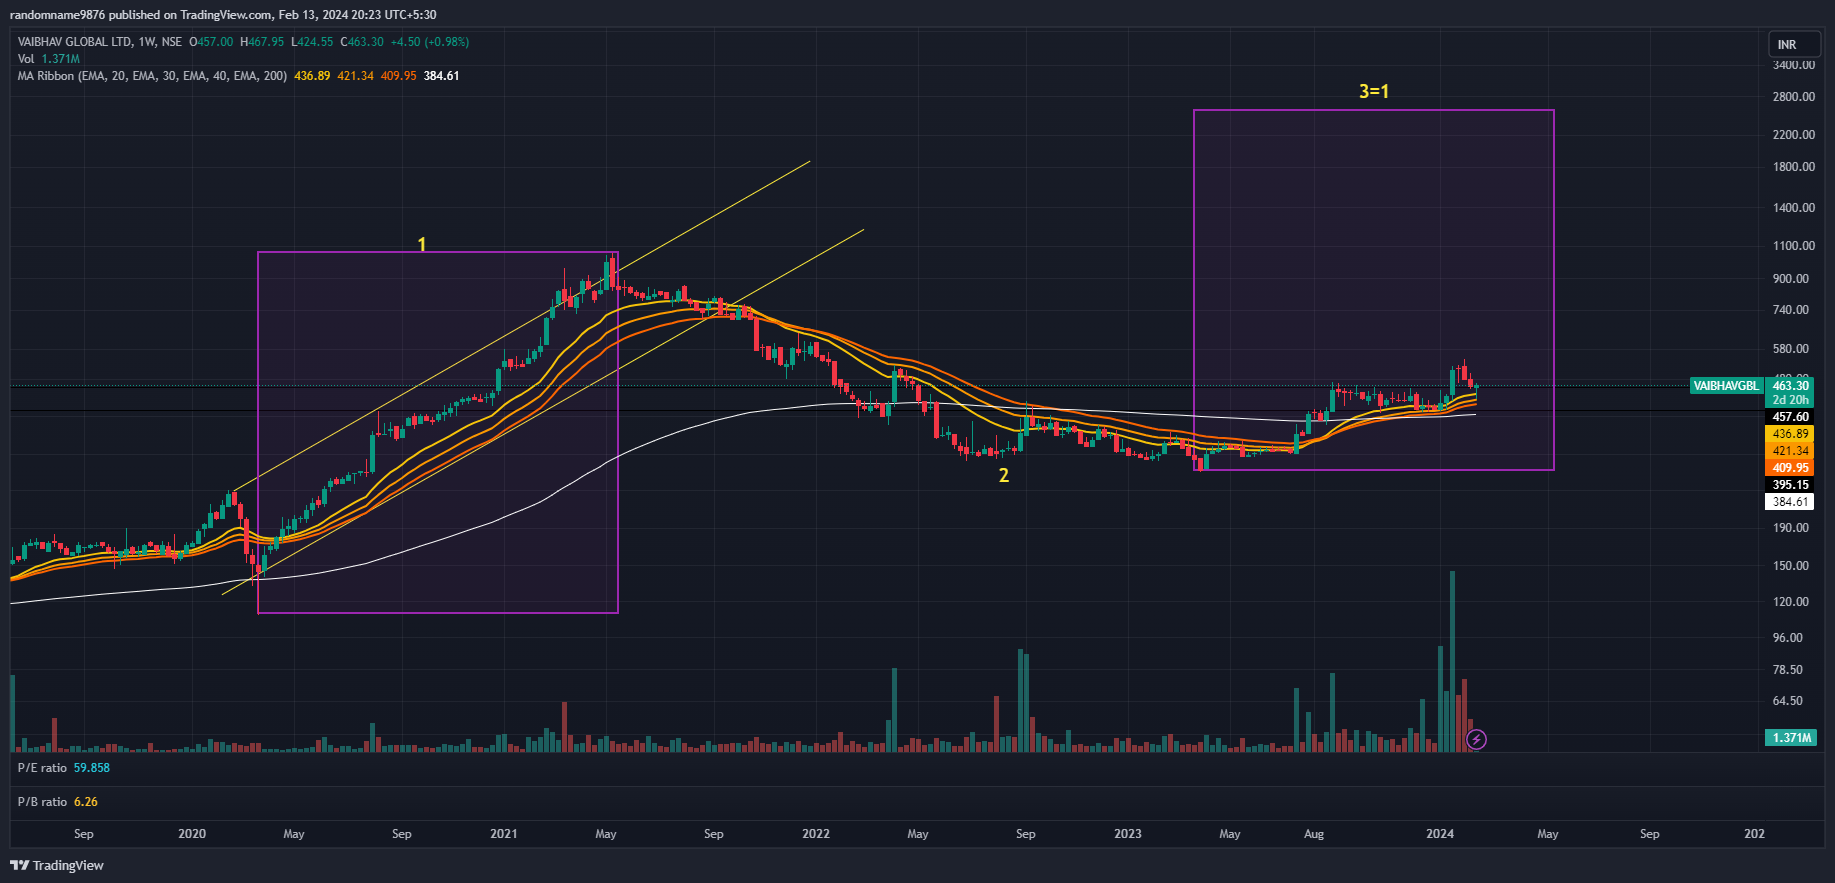
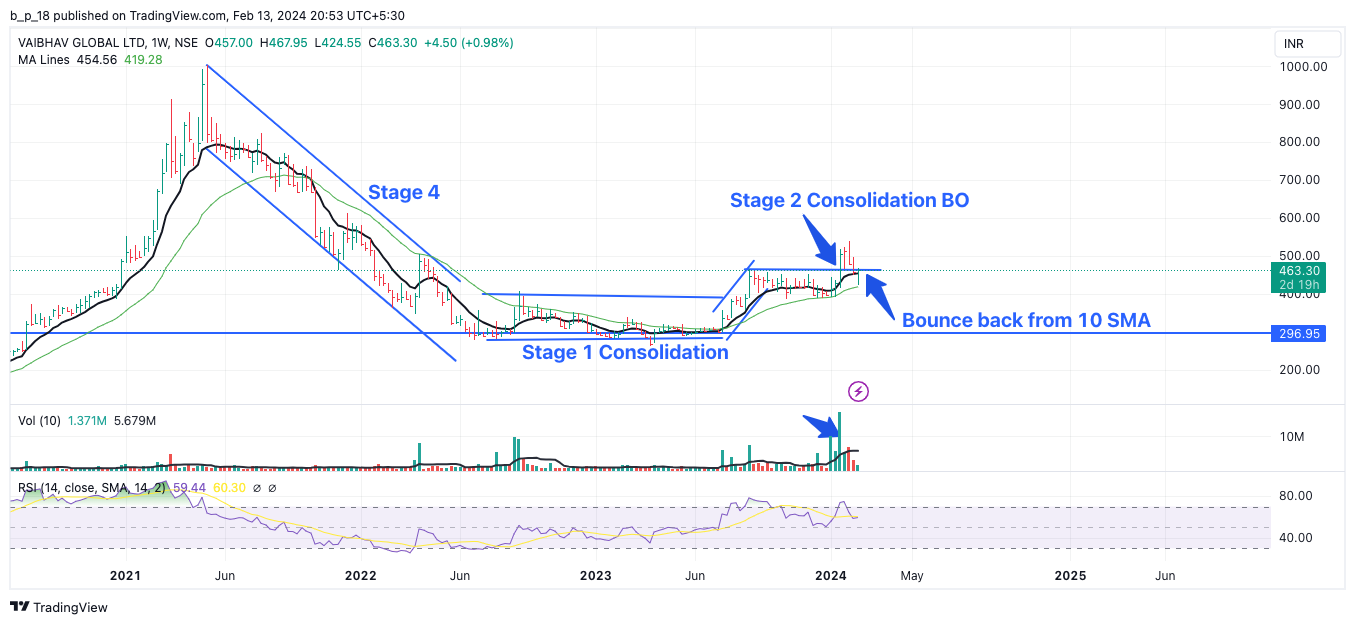
Vaibhav global seems to have gotten in wave 3.
Fundamentally, the business has reported a good result recently and looks ripe for operating leverage to kick in once the sales growth is back.
Requesting views from technical folks ( @hitesh2710 @phreakv6 and others ) on the chart
Adding my chart analysis for Vaibhav Global. Smaller red candles on pull back from stage 2 BO would have been more encouraging. But the setup along with good results look good for a stage 2 rally.
Experts please feel free to correct.
Discl. - Not invested. For study purposes
Updates on results (contd.)
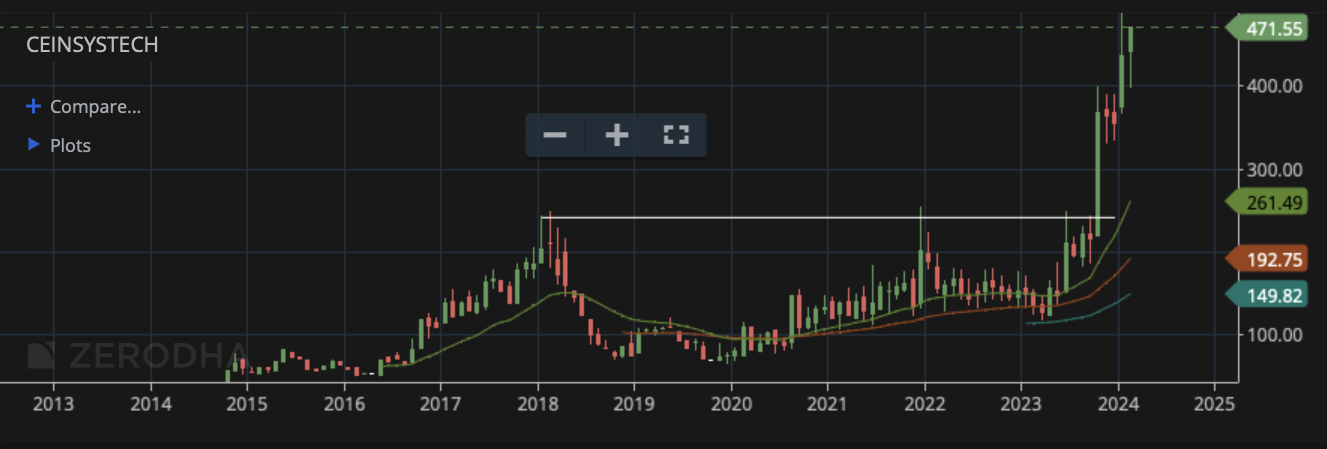
Ceinsys, Monthly - Continuation of trend post numbers. Continues to do well in geospatial and engineering services businesses. The best here might be yet to come as Q4 is generally the best quarter for the business.
This might be the best way to play overall GIS enabled digitisation theme of the govt., be it in roads, power, water, rivers, land records etc.
AllyGrow business also is doing well and overall business continues to remain cheap despite the runup.
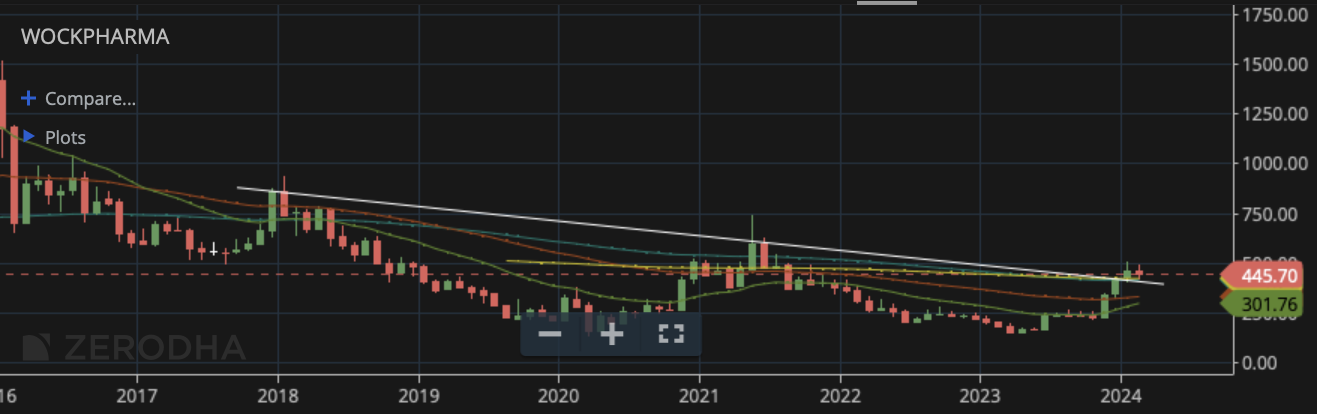
Wockhardt, Monthly - After breakout last month, this month has seen all sorts of re-testing of last month’s levels. It is consolidating and should continue in the direction of trend.
Results here are good as well, though there isn’t much to read into it, since thats not the thesis. Losses continue to narrow and company remains EBITDA positive consistently probably due to the US business structuring.
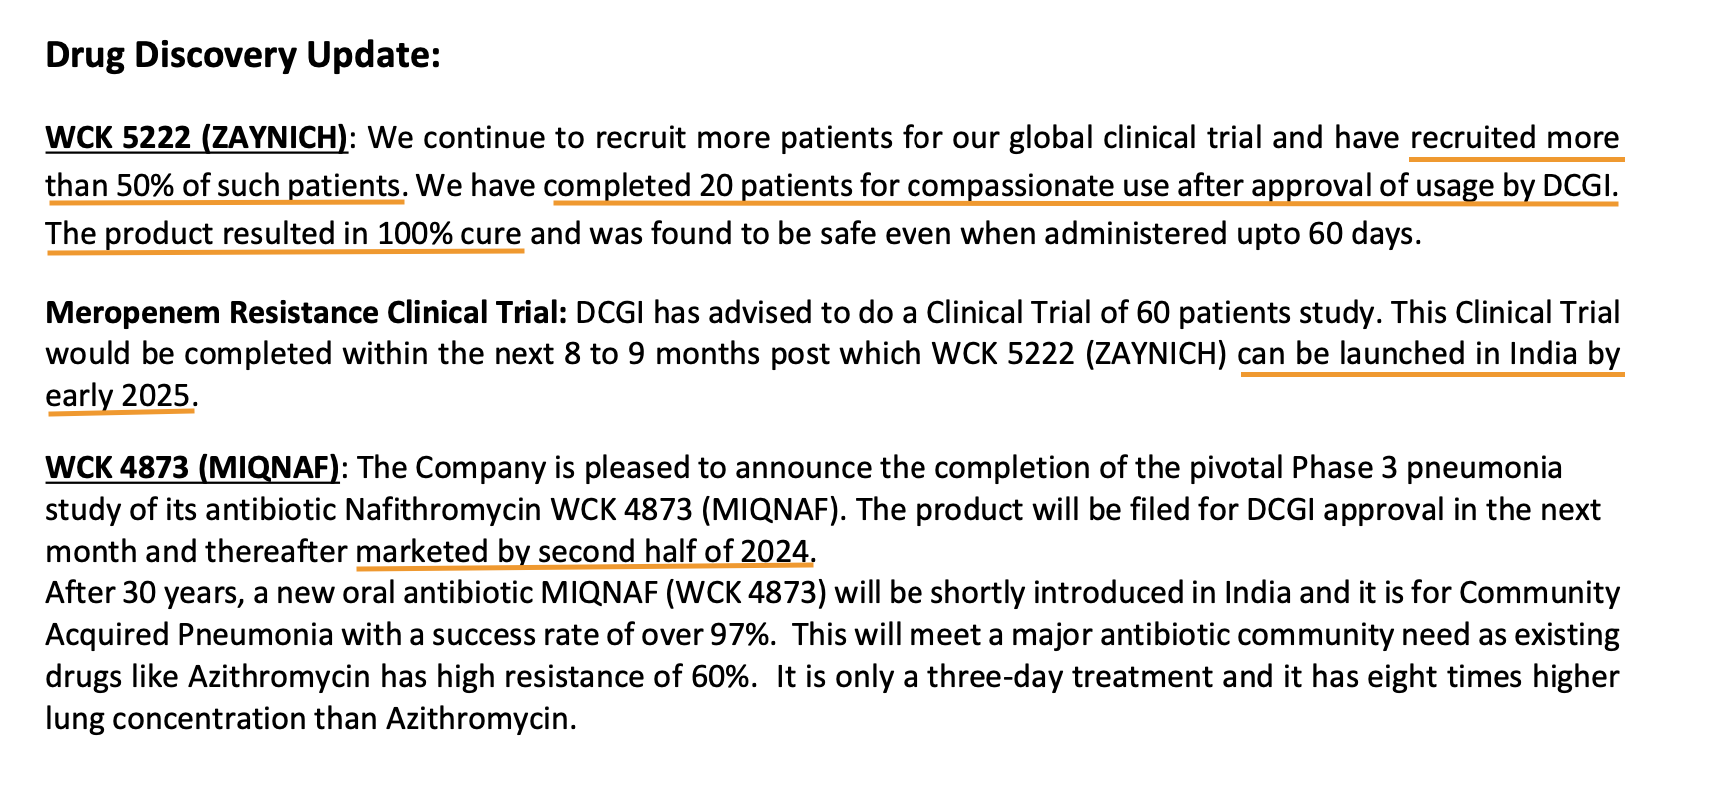
From today’s filing
Things of interest to us - WCK 5222 phase 3 has recruited 50% patients and is progressing well. Compassionate use in 20 patients has led to 100% cure. It will likely be launched in India in early 2025 post the 60 patient study. US phase 3 completion requires funds, so anything on the QIP would be a trigger here.
WCK 4873 will be launched in India in second half of 2024.
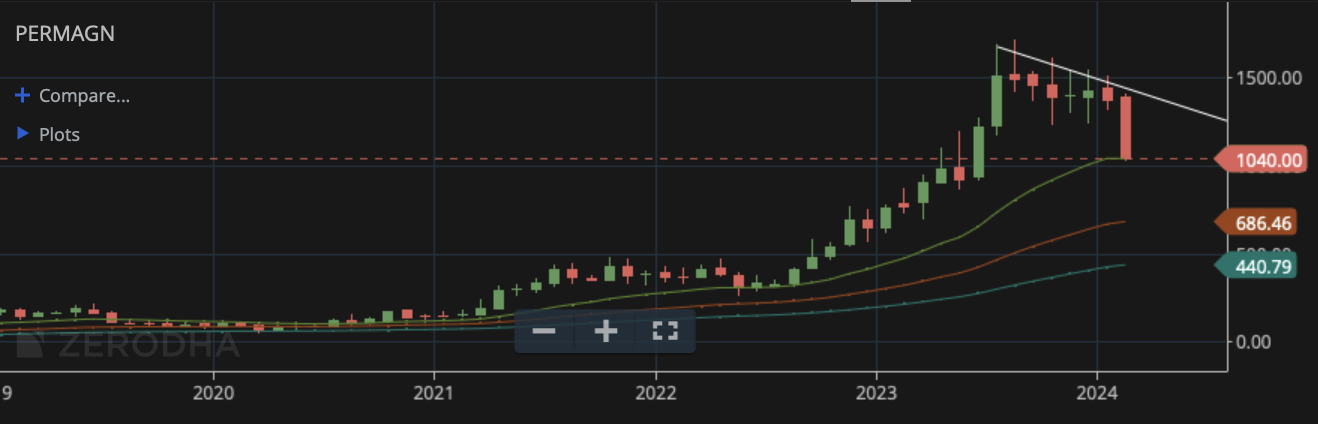
PML, Monthly - Breakdown with a close below 200DMA and taking support in 20 MMA.
Results here are bad with topline being flat but margins compressed big time. Management has mentioned this business cannot be compared YoY or QoQ since product mix can vary a lot between quarters. Still the fall in margins am not sure if its due to some one off expensive inventory of alloys or product mix or lower volume and operating leverage cutting profits in half or something else. These are the times a management has to communicate and strangely there isn’t even a presentation, leave along a call.
My experiment in long-term investing has encountered its first hurdle. ![]() PML continues to shrink in the pf without me doing anything. Turns out businesses don’t report good growth year or year and quarter after quarter. What is surprising though is market reaction to every bad result or even fair numbers on the results day, within an hour post numbers, as if selling wouldn’t be possible a month or two or quarter from there. That’s how short our horizons have become? In fact the most profitable strategy in this quarter I have observed could be buying beaten down names post results and selling for big gain in a week or month. (See recovery in Taal already for eg.)
PML continues to shrink in the pf without me doing anything. Turns out businesses don’t report good growth year or year and quarter after quarter. What is surprising though is market reaction to every bad result or even fair numbers on the results day, within an hour post numbers, as if selling wouldn’t be possible a month or two or quarter from there. That’s how short our horizons have become? In fact the most profitable strategy in this quarter I have observed could be buying beaten down names post results and selling for big gain in a week or month. (See recovery in Taal already for eg.)
Sharda motors has bounced strongly from 1350 levels and has made a fresh ATH today and is looking quite good on the charts
Garware had broken out and was re-testing pre-breakout tops at low volumes and has now bounced back with volumes today to make a fresh closing high.
Disc: Invested in all names mentioned. No recent transactions in any of them
Mar’23 qtr ceinsys tech margins were 30% which is not the trend, thus inspite of higher topline, there is a chance that op profit may show a dip. Any thoughts?
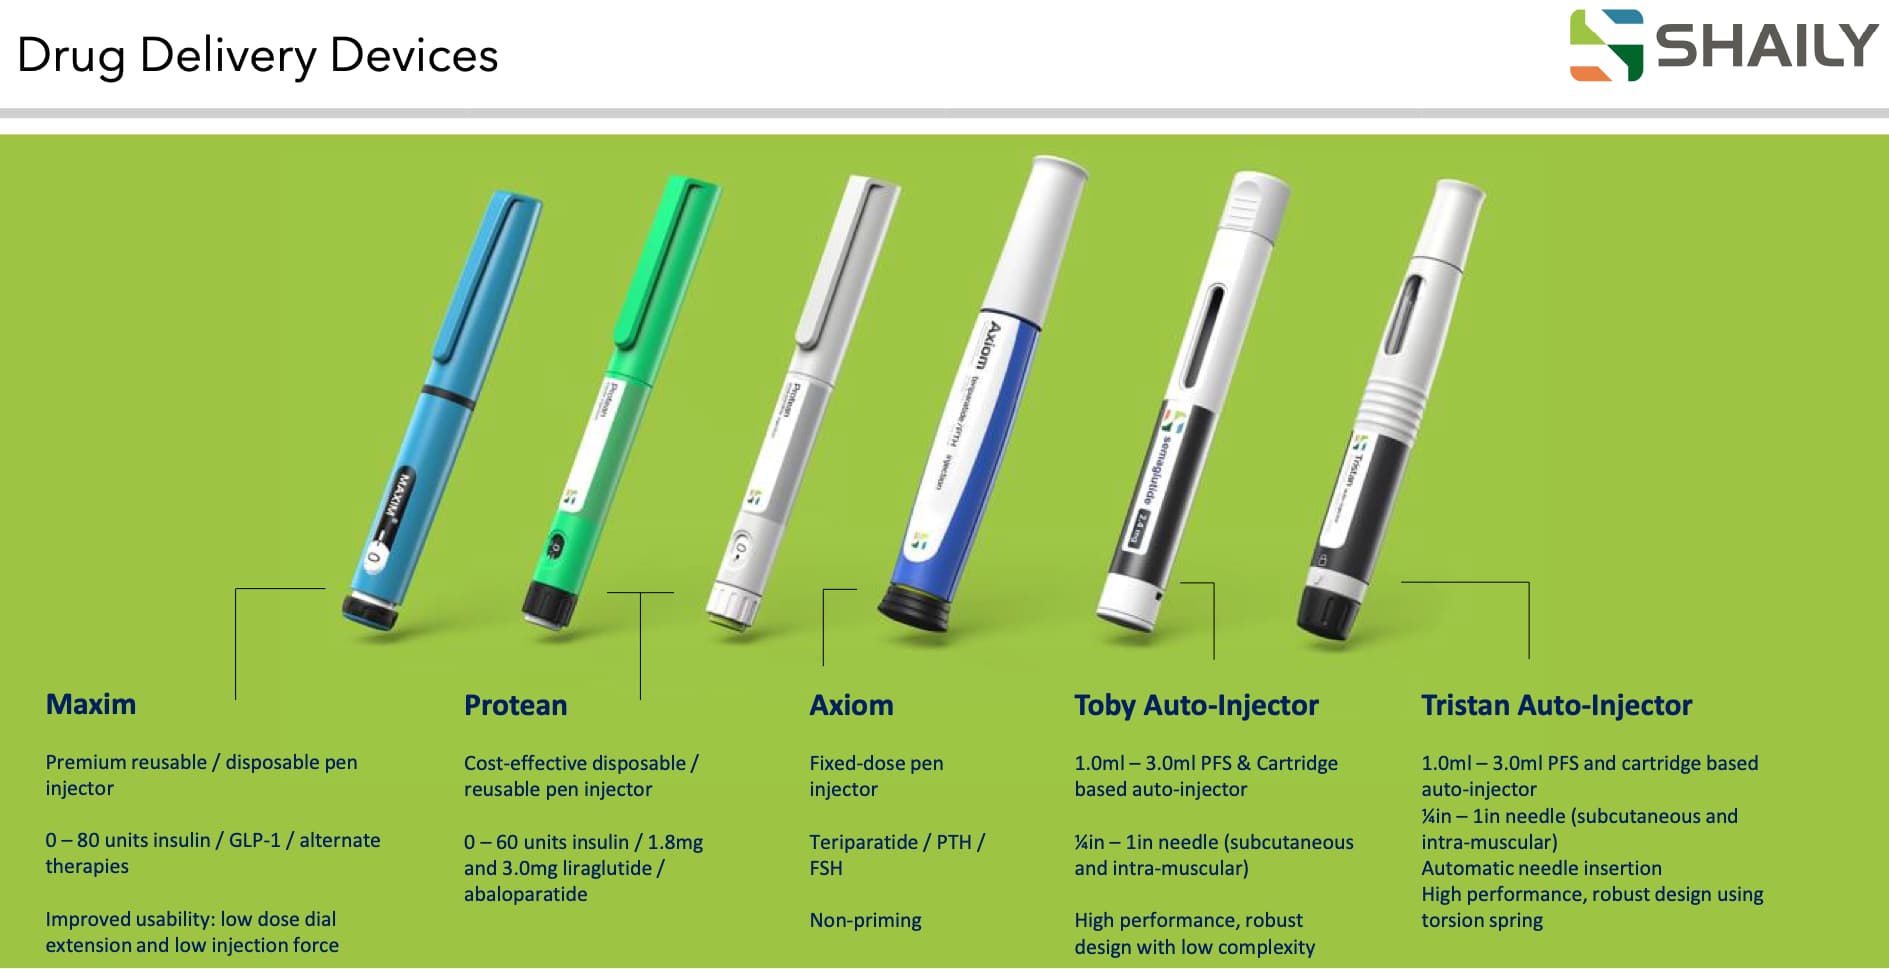
Shaily, Monthly - Broke out of the two year downward trend last month and continuing the trend post results. The business on the surface has been consolidating last 2 years and growth is back in the recent few quarters.
Shaily is into multiple segments of business from home furnishing, toys, steel furniture, automotive plastics and healthcare. Of interest to me is the last since it can be very high growth and also high margin business. It is a business where Shaily has strong moats due to the nature of business.
In healthcare division, there are multiple streams of revenue - from pharma devices to pharma packaging. Packaging is straight-forward as its containers for sterile liquids etc. (like eye drops) which is still not so exciting. The devices which involves, inhalers, pumps and pens (both contract manufacturing as well as own IP) is where possibly good growth lies in the future.
Shaily has 5 platforms of pen devices, used for different purposes from delivering insulin, GLP-1 molecules (semaglutide, liraglutide) and synthetic parathyroid hormones like teriparatide.
In insulin glargine, among the top 3 which is Novo Nordisk, Sanofi and Eli Lily, Shaily supplies the All Star line of pens to Sanofi. (they also supply for Wockhardt)
Bigger future growth could come from Semaglutide as Ozempic loses exclusivity where the management thinks they have 70% share in semaglutide generics market. This could be as big as half a billion pens in market size as per management. Current run rate for pens is at 14 million if am not mistaken (used to be 6 million 2 yrs back and scaling quite well)
Going forward the contribution from own IP pens will go up above contract manufacturing which will improve the margins. Also since Shaily owns the IP of these pens and the generic players who tie-up with Shaily for delivering their molecule end up paying a platform access fee which somewhat de-risks Shaily’s design and development efforts. This is fairly high margin (difference between consol and standalone is what is contributed by Shaily innovation UK is essentially platform access fee income) amounting to 14 Cr topline and 11 Cr at EBITDA level. As per management this accrues over 9-12 months and as they keep signing up new Customers, they have good visibility over next 2-3 years.
Actual sales of Semaglutide pens would happen from FY27 onward in RoW markets and FY29 in US where actual explosive growth could come. Until then, the design and development work has good near-term triggers.
It is a bit harder to model what numbers will be like without knowing what molecules they have signed on for what Customers (and what stage of approval they are in). This information might be available in next quarter and can provide much better visibility.
Valuation appears fair given the growth. Capacity utilisation is at low levels and utilisation levels are going to increase across segments as per management, so it doesn’t appear like any further capex is required in the near-term. Recent pens capex is about 125 Cr (done in last 2 yrs) and will be sufficient to do about 300 Cr topline. Cashflows could be used to pay off debt which can improve bottomline further in the future. Depreciation for new capex has already started hitting (capitalised in Oct '23) so current rate can be projected to the future as well.
Risks:
Also due credits to Aman Vij (@Rokrdude) who has been following this business for a long time and helped me get a quick grasp of things both directly and indirectly (from his insightful queries in the concalls across the years)
Disc: Invested between 460-470 levels. Am not qualified to advise and just sharing my trade note
Do you think that Mazda has become expensive given the runup it has had?
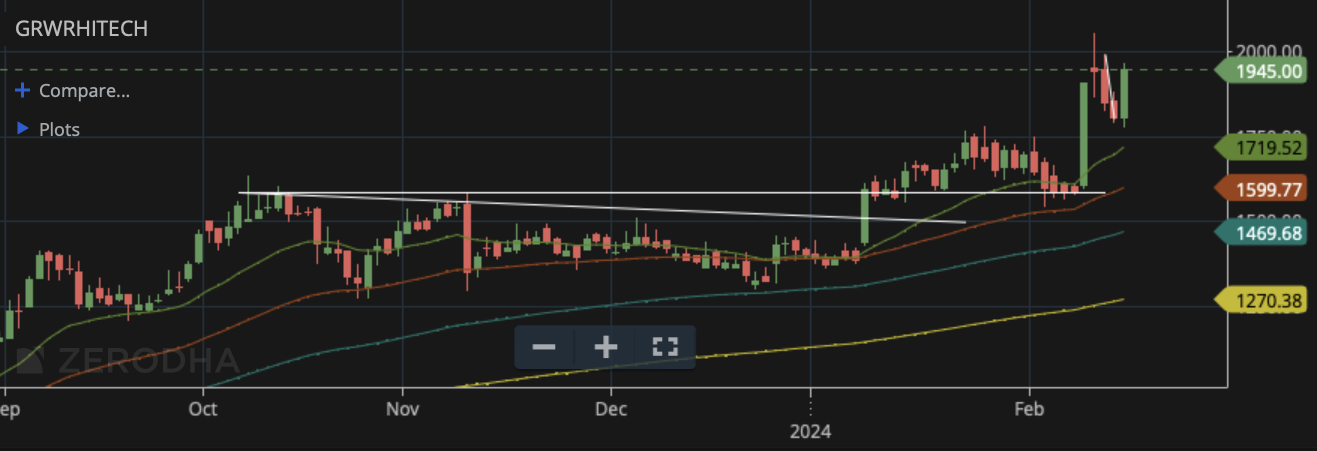
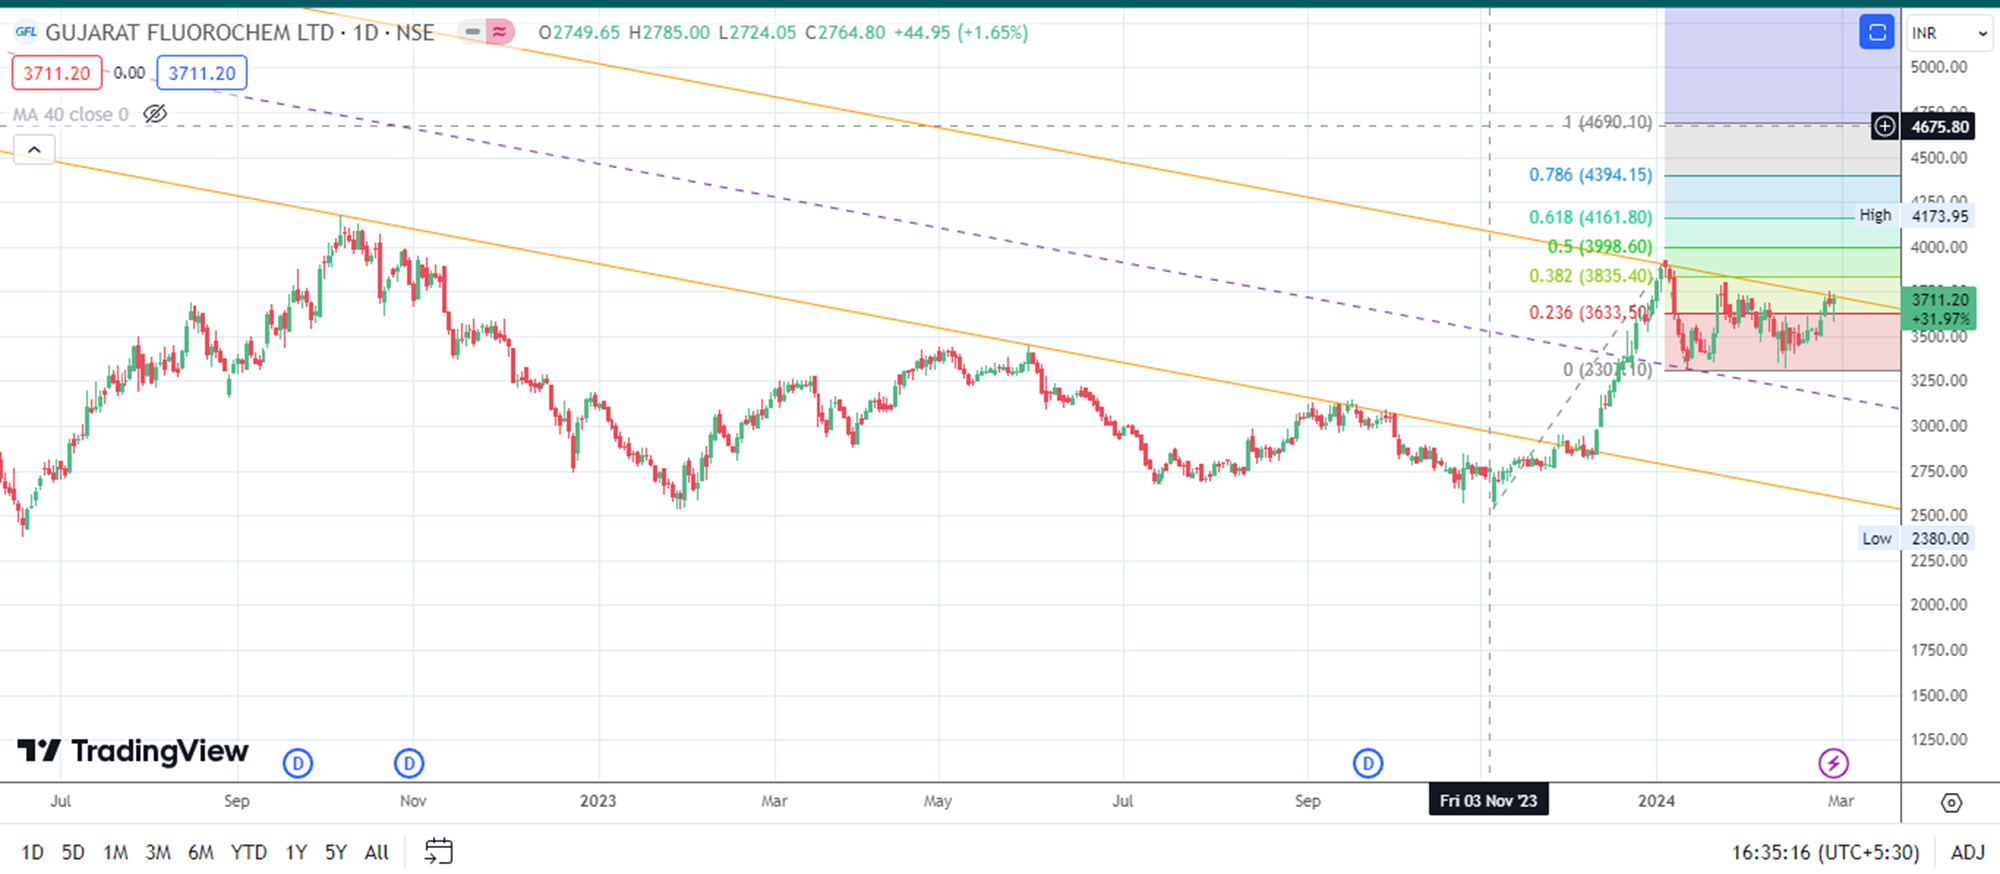
Gujarat Flurochem Daily
The Guj Flurochem thread has the neccessary fundamental points. From a technical point of view there are several things that have happened at once in the chart - as follows :-
After breaking out of a downward sloping channel @ 2949 the stock price rallied by roughly 1000 points posting a high of 3920. This incidentally is also the size of the parallel channel formed within which stock prices are moving. In the event prices break out of this channel from 3711 then there is a potential upmove of roughly 1000 points to reach roughly 4700
There are also a couple of continuation patterns that are clearly visible on the chart viz a flag pattern/triangular consolidation with a pole size of 1000 points and the flag being restricted in the top 38.2% of the pole size and price also rebounding of the support of 3391 i.e the 38.2 fib retracement level several times. The second pattern is a shallow cup and handle which is a good indication of a possible upmove.
The third one is the theory that the size of a previous upmove as calculated from the intervening retracement is duplicate the the successive upmove. Prices moved from a low of 2537 to a high of 3920 - a move of 1383 points which added to the intervening retracement of Rs 3307 would amount to 4690 (3307+1383) which also is the target in point no 1 i.e roughly 4700
The chart posted a hammer candlestick today during the formation of a cup. Hammers are thought to indicate a oissble reversal according to theory.
The stock price has remained resilient even in todays rout indicating strength as well
Disc - invested and no activity in the last 6 months
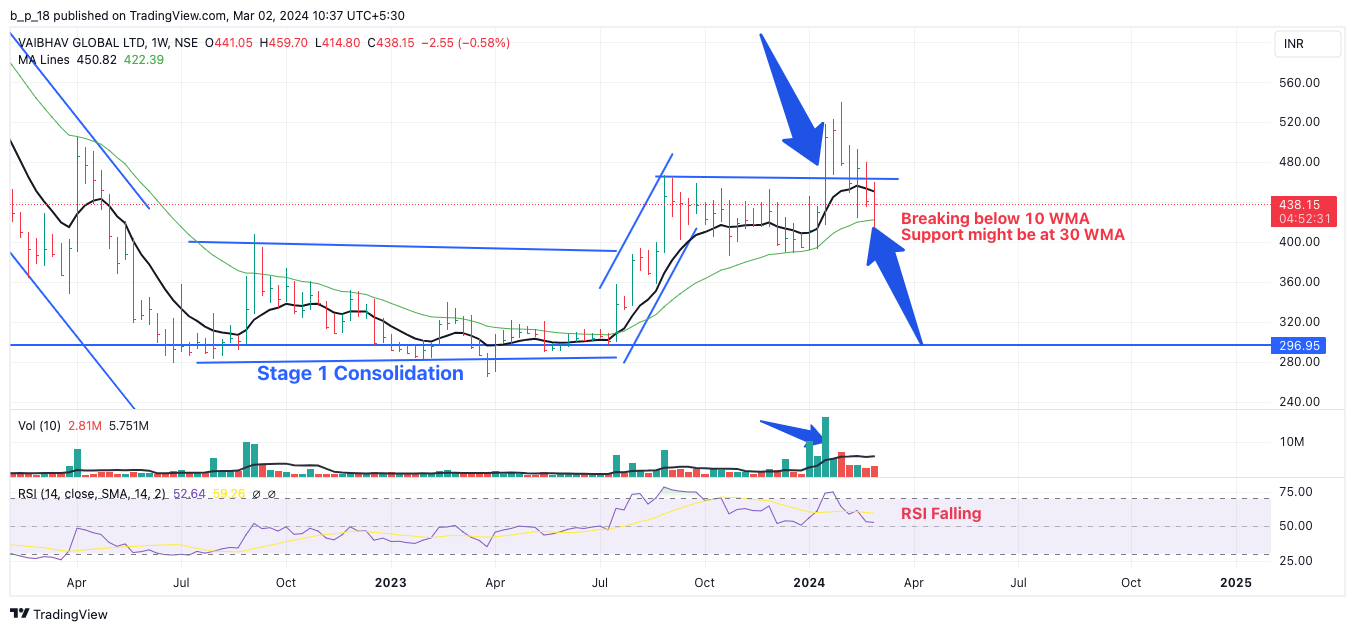
Looks like, Vaibhav Global falied to maintain above 200 MA line and falling below it. Need to see whether able to pull back and move to Stage 2 as it did in Jul/Aug’23.
If you have any other views, please share.
An updated chart,
2 points/ risks here to watch out for,
WMAs are looking to start into a declining slope, which never is a good sign from a momentum point of view.
RSI also is showing a declining trend. Still above 50 but close watch needs to be maintained.
As described in the post earlier, big red volume candle was not so encouraging. Might enter a consolidation stage if not further degradation.
A big green candle as a shoot up from 30 WMA might be encouraging in coming days. Of course this has to be after very low red candles (Signaling reduced volatility).
Disc. - No positions. Only for study purpose.
This post pertains to current market sentiment, perhaps not totally in line with thread objectives. I hope it can be excused until I start a thread of my own.
The returns you make from the market are a function of what the general environment is like, what the business does, what the fellow shareholders do and what you do. First two you don’t control. The last you control completely and the last but one, you can to a large extent control (by keeping away from social media so that it doesn’t influence your buy/sell decisions - so you are not in businesses with a lot of people with ultra-short term views trading beta).
In times like these we get to know who your fellow shareholders are. There was no reason for a lot of stocks to have run up in the last couple of months, just as there is no reason for them to fall now. In raging bull markets, everyone’s time horizons shrink unreasonably. Good stuff 3-6 months out get priced in 1-2 months and correct in 3rd month and recover in 4th month to get back to what was discounted in first 1-2 months. This has been the story of this bull market. If things keep with trend, recovery should happen in last week of March and April before Q4 numbers start rolling in - but not before weeding out holders who have no idea what they are holding by probably falling even further.
People know macro is good (oil, deficits, gdp, rupee, us10y), economy is good, and in all likelihood Q4 numbers are going to be good. Valuations though have been very expensive since about last Sept. A lot of it got backfilled with better earnings in Q3 as macros cooled off. Still there’s talk of a crash. I think a 10-15% correction at index level and a 20-30% at individual stock level is par for the course in small/micro caps even in a trending market. (You will be surprised by the number of 20% drawdowns even in a perpetually trending stock like VBL). Individual stocks irrespective of their caliber can fall more than a index or pf simply because their tops were made at a different time than the pf and they probably ran up lot more than the pf and carry different weights w.r.t each other.
A rush to exits though means throwing the baby with the bathwater. If you never marked up the pf when it went up unreasonably, you probably don’t feel the pinch as much as someone who rejoiced and posted PnL screenshots only to watch it all evaporate in a week. This is where understanding what you own and why and what your time horizon is makes a difference.
Instead of picking yet another business to analyse, sit down and analyse yourself. Read your old trade notes. Read what your expectation for the year was, when the year began. Read what you felt like in the last drawdown (say Sept or Dec or Feb) and at what level are you at currently from there and so on.
Writing this because there doesn’t seem to be room for sanity - only extreme optimism or extreme pessimism alternating with each other.
Disc: No recent trades since buying Shaily. P/f down ~10% from top as of today, up ~13% for the year. Would be very happy to close the year with ~20% returns which was my expectation starting the year after a phenomenal 2023. Just a novice sharing my thoughts.
Thanks for sharing your thoughts mate. I’m asking what I ask below out of genuine curiosity because there may be some lesson in how we calibrate and recalibrate expectations here.
Your expectation at the beginning of the year was to close with ~20% returns. Say, you started at 100. That would mean an expected 120 at year close. Today, you are up ~13% i.e. at 113. Since your portfolio today is ~10% below top, the top would have been 125+.
Which means you had crossed your return expectation for the full year in Q1 itself.
This is something all of us face (in lucky years!). Question is:
Essentially, did you recalibrate expectations upwards, or did you de-risk? Since you examine your thoughts, it may help illustrate something for us.
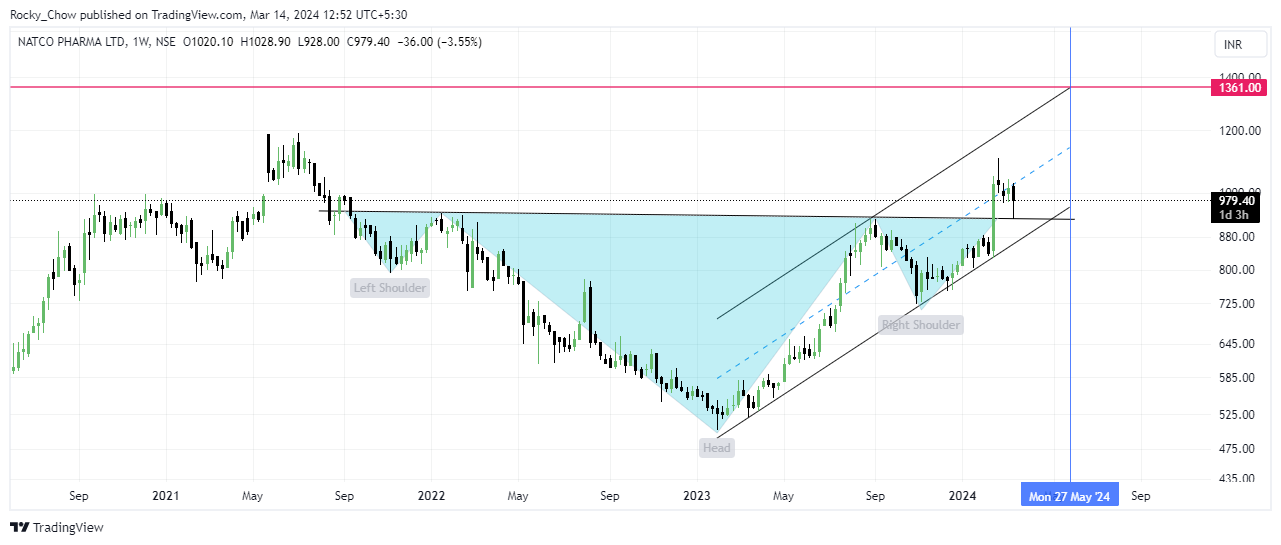
Stating the obvious here for all those tracking or invested in Natco Pharma
Price has given an Inverse Head & Shoulders pattern completion (on multiple time frames), whether or not retest has been done I leave it to ones own judgement… fundamentally, profits have never been greater, operating margins at an enviable 40% +, expecting contribution from grevlimid to continue in FY24-25 as well as the share price to break through the previous ATH by the time we are face to face with the Q4 results which willmost likely be around the last week of May… the market prices the share at a modest 14PE…the kothur plant usfda issue remains a thorn in the bullish thesis…
the neck of the h&s would be the logical stop loss area
@phreakv6 what are you views on hindustan oil exp , it is taking a good support near 160 , not uptodate with the thread but do you still hold/track it?
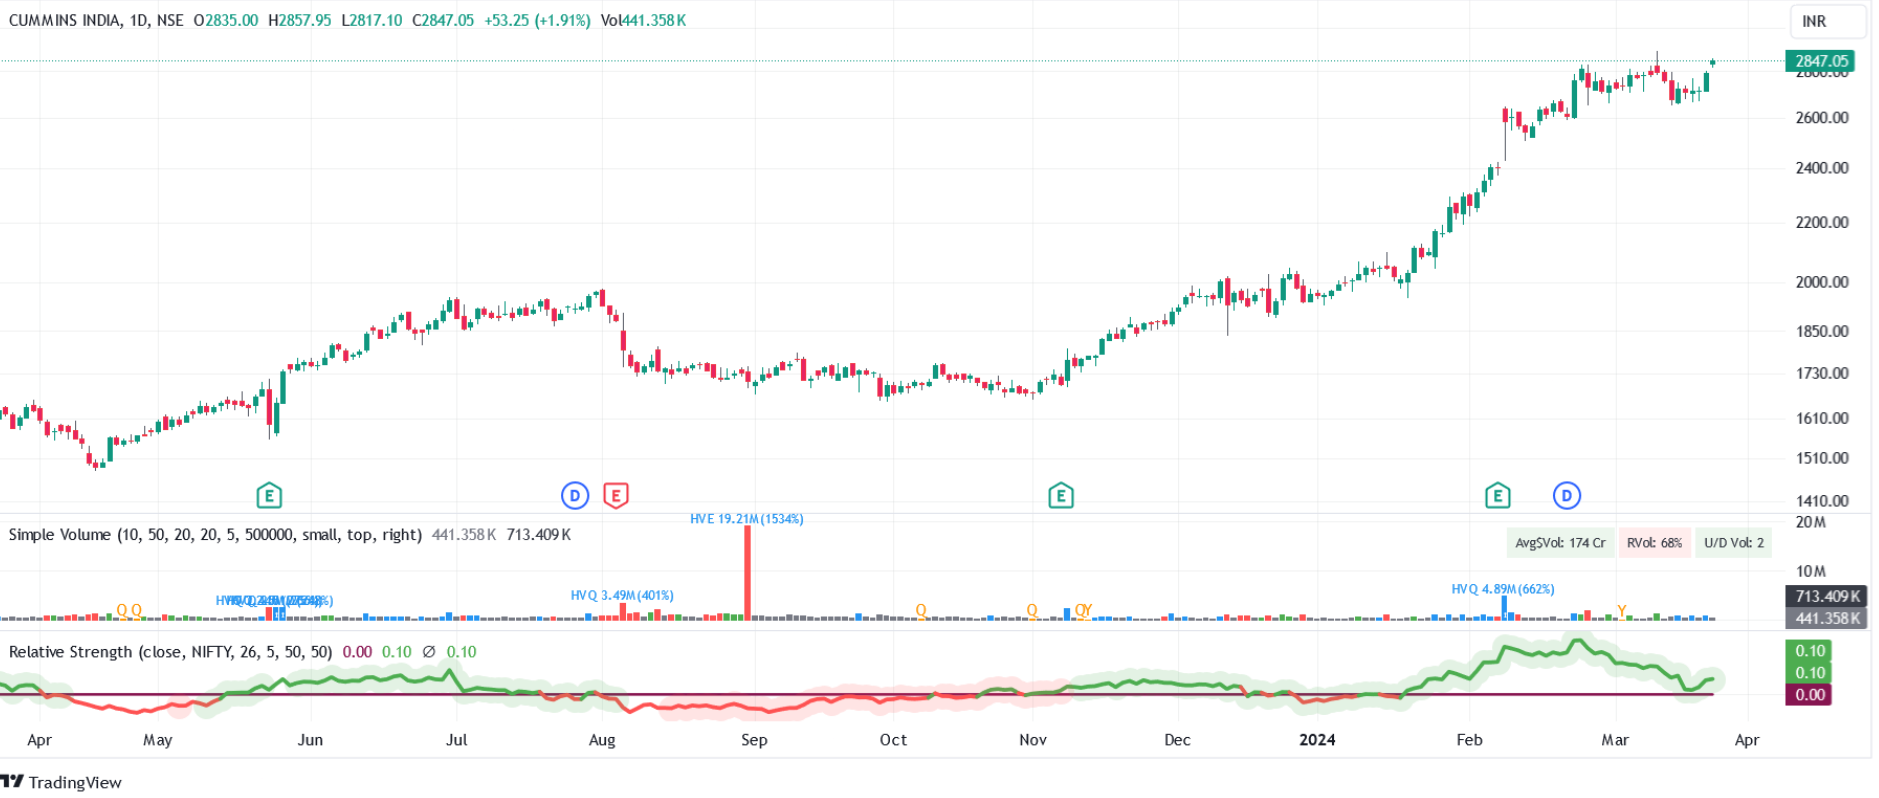
I’m trying to understand charts and have read ‘A complete guide to volume price analysis’ by Anna Coulling. But what’s happening in this chart. There’s a huge red volume candle in Sep 2023. Shouldn’t the price have corrected after this? I have been thinking red volume candles mean selling and a signal to get out. Can anybody help here? Does technical analysis not work or what?
Same scenario with Tips Industry on 20 dec 2023, huge selling done by promoters. But still stock is rising.
A huge red candle isn’t always a bearish pattern. All it means is a large volume of shares have been traded at a price lower than the last trading day. Now you need to check if there was a significant price drop on the same day? If not, it could be that shares where exchanged between two big institutations. A one time event like this can be seen in most stocks and can usually be ignored.
Thank you for sharing such queries that makes all of us to revise what we learnt once in a while.
Please refer the book’s Chap 4 - Volume Price Analysis – First Principles, Pg 69 , Fig 4.13
Quoting some excerpts from the text :
we can see a narrow spread candle with high volume which, is an anomaly.
There is only one conclusion we can draw.
The market is starting to look weak, and is typical of a candle pattern that starts to develop at the top of a bullish trend, or the bottom of a bearish trend.With the narrow spread candle and the high volume, the question we might reasonably ask, is 'who is actually selling here?
The specialists have driven prices higher, but the market is now struggling at this level.
They are selling to the market to clear their warehouse, but the buyers are not there in sufficient numbers to move the price higher, as it is constantly knocked back by longer term traders, selling out and taking their profits off the table.They maintain the price at the current level attracting more buyers in, who are hoping to jump into the trend and take some easy profits, but the sellers keep selling, preventing any real rise in price.
In this case, the stock went into consolidation once that anomaly candle appeared and was a good sign to get out.
The stock consolidated for the next 3 months and gave a breakout on Nov 8th, exactly above the high of the anomaly candle on a high volume.
You will also notice that this is also the point when 10 EMA went above the 20 EMA.
Again all this is in hindsight, I am also learning. VPA experts like Karthik Marar would have usually drawn a parallel line to the high and low of such anomaly candle and waited for the price to breakout of either of the line to take a decision.
Update :
Link to Karthik Marar’s channel
The script he wrote for Tradingview and which i regularly use to accelerate my learning of VPA is "VPA - 5.0.