Anchor rate of corporate earnings growth

@Moderators - I am creating a new topic because I do not know where else to post this. If there’s a better place you may hook it there.

Folks,

We often hear analysts, commentators, experts talk about earnings growth of 15 - 17% annually and base their Sensex and Nifty guidance based on that. But do earnings, on aggregate, really grow by that much? Or more? Or less?

I did an analysis to figure out what the ‘anchor rate of growth’ should be and posted it on a friend’s blog. I am attaching the same here. AnchorErngGrwth_25112015.pdf (531.8 KB)

Comments are welcome.

8 Likes

Wonderful work done Krishnaraj. :slight_smile:

I appreciate your tenacity to spare the time to collect these data and calculate on your own.

We often accept the data Brokerage houses throw to us. :smile:

Will Keep in mind.

1 Like

@diffsoft excellent work. No wonder Nifty can grow only at 10% or so.

1 Like

Thought I will share what I have for Sensex for the last 20 years.
This is BSE’s reported EPS for Sensex and not estimated ground up.
The growth rate there happens to be 15%+ for the period 2004-14.

Don’t know how it can be so different. Sensex.xlsx (46.6 KB)

1 Like

@hsriram Thank you for sharing the data.

If you compare FY 05 EPS to FY 15 EPS of these figures the EPS growth on a CAGR basis is 13.7% but we do not know how EPS is computed.

For FY 05 EPS we take March 05 EPS. This is 404.437

For FY 15 EPS we take Mar 15 EPS. This is 1464.49.

FY 15 / FY 05 is 3.62. This is a CAGR of 13.7% over 10 years.

The problem here is that EPS given for any month is taken as trailing 12 month EPS but this does not take into account changes in Sensex in that year. For instance if say Asian Paints was added in Oct 04 in place of Jet Airways, then does the EPS for FY05 take Jet Airways earnings till Sept 04 and Asian Paints later or Asian Paints for whole of FY 05? That is not clear.

Further there is some doubt on whether the EPS data is standalone or consolidated. I had mentioned elsewhere in the forum that at least the NSE Nifty data is for standalone; and for an equity investor consolidated numbers give the right earnings, not standalone. I suspect Sensex data is also standalone EPS and not consolidated EPS. Consolidated figures will give you a difference picture because in general overseas earnings (which constitute bulk of the difference between standalone and consolidated) growth are much slower than domestic earnings growth after the 2008 meltdown.

Unlike the Nifty the Sensex components and its weightages were not found in the BSE website so I cannot manually compute the EPS figures to verify.

Thanks,

1 Like

Interesting… my guess is that you will get a higher value if you do the calculations with current Index constituents only. When you sick with historical constituents, you are bound to get worse results as the non-performers move out of the index. When you keep changing the constituents, this would reflect the correct historical values. If you ignore the historical changes and only consider current constituents, checking their historical performance, it will be higher. It is for this better performance that they replace the laggards in the index. Also the better performers will have higher current weights in the index, further boosting the earnings figures. My guess is that the institutes might be doing these simple calculations rather than going to check the historical changes that happen in an index.

1 Like

Dear @akbarkhan

Your argument as I understand from the above is that the current constituents are better than historical constituents because historical non-performers go and only the performers stay. So we need to take the current constituents’ historical performance and infer growth in the future from that.

But the historical performance of current constituents has the benefit of hindsight. Suppose I create a portfolio today of stocks that has given a high earnings growth say in the past 5 years by choosing them obviously after I know their results, I cannot say that their their future earnings growth will be high. If you think about it, say the Nifty 5 years ago would also have thought the same as you are thinking now; ‘that I have removed laggards and only the performers stay’. But laggards continue to be there and Nifty continues to be revised; 2 - 4 changes every year. Even today’s Nifty will have laggards, no one knows which ones. For instance no one long back would have thought that RIL will be a laggard, and today I am sure you would laugh if I told you that Jet Airways was a part of Nifty. Similarly companies have been removed and brought back into the Nifty (Zee Enterprises, for instance) after a while!

So the best way to measure anchor earnings growth is to take Nifty portfolio as it was at that time in history and see how it did until the Nifty was changed; and again do the same.

I agree with most of what’s being pointed out. Standalone vs Consolidated, Change in constituents, Growth rate etc.

What the TV anchor claims does not reflect reality. Beyond that, trying to use these numbers as anchor for investment decisions is not the right thing to do for a value investor.

Focus on finding the intrinsic value of the individual stock. That’s the holy grail.

@hsriram - I get your point that a value investor needs to focus on the intrinsic value. But arriving at the intrinsic value often requires us to make some growth assumptions. So what growth assumptions should we make?

Looking at the growth assumptions that is touted around, I wanted to validate. Sure someone, somewhere, sometime will always be growing at a scorching pace; someone at a slower pace. So if I were to ask myself a question - suppose I throw a dart on the ticker board, what growth rate should I guess for the stock the dart hit? That led me to the question of anchor rate of growth.

You may ask well, just take the GDP growth rate. But as I conclude in my article, GDP growth rate has been poor, very poor, in explaining earnings growth. Maybe take sector growth, but they keep changing very now and then and hence not as reliable as I would like. Who fore saw negative growth for motorcycles a few years ago?

Very true. I see merit in what you say.
Like your work, I used to think with all this data. But I have moved on as I have got it wrong most times with these approximations.

Somewhere I read an academic paper - Best market returns happened in countries like Finland and Switzerland in the 80s when the economy was not growing fast. Reason attributed- In a stable slow growing economy, capital allocation was easier. Misallocation and experiments were minimized. Management didn’t waste money on so called innovation, but promptly paid it back to the shareholders saying “Thanks”.

Estimating growth rates is very difficult. You can have a range of outcomes. Market growth doesn’t guarantee company’s growth, to start with. Companies with increasing moat (~ increasing RoE) can claim at least existing growth rates. In bull markets, we try to estimate and invariably overpay for growth. In bear markets, we focus on value (with minimal growth projections) and get it right. Even though growth and value are connected at the hip, very few get it right focusing on growth estimates.

The only exact thing is the price you pay. Everything else is an approximation.

1 Like

@diffsoft I fully agree with what you say. I was only suggesting that it could be the way the institutions calculate and get a higher growth rate. Not saying this or that method is correct.

@akbarkhan Thanks for clarifying, I originally misunderstood what you had said. I also agree that many brokerages use this to show a higher growth.

Fantastic effort guys.

BTW, both Krishnaraj and Sriram’s data points to a 10 odd percent CAGR for the years 2005-15. As Sriram’s data is monthly, we need to consider June 05 EPS of 456 as EPS for the year 2004-05. Please remember that complete March quarter results come out only by June, so June EPS data has to be the correct data for the financial year end. Similarly, 2015 EPS should be taken as June 2015 EPS which happens to be 1245. And for these two EPS numbers we get a 10% CAGR for 10 years.

On the contrary, if we take 2004-14 for a 10 year calculation, we get more than 15% CAGR. So, the year taken for the calculation matters a lot. I think 2004-05 was a fantastic year for the Indian companies and 2014-15 was a pathetic one. These two years alone give us a CAGR differential of 5% for a 10 year period.

BTW, Krishnaraj how did you pick up sample companies for PAT to GDP calculation. Did you pickup only those companies which existed in 2004 as well as 2014 or you picked up all the companies existing in 2004 and all the existing companies now?

@gyansr

The companies are not the sample but the universe; the universe of all companies in the Prowess database. The Prowess database had 27,244 as on Nov 2015. So this covers around 23,000 unlisted companies - pretty much all the large companies (except say LIC, but LIC’s profits are not as high as you might think and negligible in comparison cumulative corporate profits above).

As for Sensex EPS figures supplied, I would say use them with caution because we do not know how they are computed for reasons cited in one of my earlier posts.

@diffsoft

Can you please try your anchor growth calculations for the years 2004 -2014 and not for 2005-15? You will need to add the data for only one year 2003-04. What CAGR do you get for the corporate earnings growth for 2004-14?

Can you please let us know the change in the number of companies as well for each year of GDP to PAT calculation? I think the number of companies used for PAT calculation will differ year on year. Also if it is possible, can you let us know how many of them were profitable and how many of them were loss making for each year? Is there a trend that more and more loss making companies are getting created now compared to the earlier?

@gyansr That’s a lot of work and not remunerative :smile:. I shared the analysis I carried out for my own work for VP members’ benefit.

As for doing it from 2003 - 2004, I also did not do it because TCS, India’s largest company by MCap was not listed (it was listed only on Aug 25 2004) and included in the index on 25 Feb 2005. For a rough figure for FY 04 you may look up the NSE website and look at their PE ratios and derive earnings growth.

PAT numbers were carried out on aggregate without individual break-ups; my own experience is that the top 5% will account for about 75% of PAT so I did not see any merit digging further once the question is answered.

I can give you the raw data of my analysis if you desire.

Thanks Krishnaraj. I can understand that it is a lot of hard work and thanks for sharing it with others.

1 Like

Adding to the useful thread, there is a recent Sage memo on the subject
http://sageoneinvestments.com/wp-content/uploads/2016/11/Indian-Market-Valuation-Analysis-SageOne-Nov-16.pdf
And globally, a famous Base Rate Book(Oct’16) by Michael Mabussian
https://doc.research-and-analytics.csfb.com/docView?language=ENG&format=PDF&source_id=csplusresearchcp&document_id=1065113751&serialid=Z1zrAAt3OJhElh4iwIYc9JHmliTCIARGu75f0b5s4bc%3D

While much of the discussions on this forum is focused on bottom up analysis of individual stocks we all agree that if the overall market has a good influence on price of a stock. In fact, after company’s own earnings, overall earnings growth of corporate India is IMO the most important indicator that drives the stock prices. We all keep hearing about Nifty earnings growth, earnings recovery etc but there is no definitive source of finding out aggregate earnings growth.

Calculating earning growth for a group of companies is not that difficult as we anyway track individual companies so we we just have to add up earnings of companies in a group to get earnings of the group.

I have made an attempt to calculate earnings growth for 3 broad group viz Large Cap, Mid Cap and Small Cap. I have used BSE Large Cap Index, BSE Mid Cap Index and BSE Small Cap Select Index to get a list of companies. Each index has about 60-75 companies with no overlap.

I have excluded very few companies from this list mainly if the reported earnings do not represent the underlying economics of the business (e.g. oil marketing companies like IOCL, MRPL, HPCL etc).

Here are the results

Large Cap - Annual Earnings and Revenue Growth
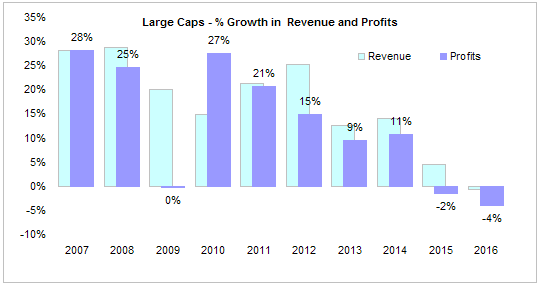
Source: Capitaline

During the boom years of 2004-2008, earnings grew at a phenomenal 25-30% per year. Financial crisis of 2008 put a break on the earnings growth and earnings did not grow in FY 2009. Govt responded with a stimulus package which boosted the earnings back to 27%. But it also unleashed high inflation of 2011-14 and earnings growth slowly dropped to -4% in FY2016. Part of the de-growth a result of huge losses reported by banks beginning Q3 of FY2015-16.

While the market started rallying in 2014-15 after election of the new government, earnings growth was actually rapidly slowing down. This could be the reason market gave up most of the gains of 2014-15 in 2015-16.

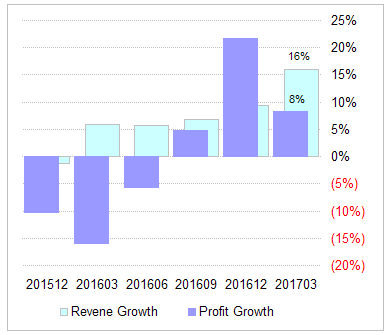
Large Caps - Quarterly Earnings and Revenue Growth
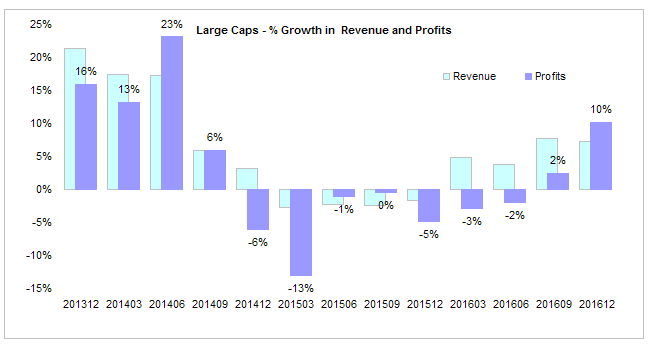
Source: Capitaline

As seen from this quarterly chart, earnings growth bottomed out in Q4 FY2015 and a patchy recovery began in 2015-16. As the earning recovery was gathering pace, RBI asked banks to perform stress tests of their portfolios and make additional provisions beginning Q3 FY16. This move resulted in earnings growth again going down to -5% in Q3 FY16. Over the next 4-6 quarters as banks made catch-up provisions, earnings growth resumed its upward move. Market however, largely ignored the bank earnings and instead focused on revenue growth and earnings growth excluding banks. Even the demonetization in Q3 FY17 does not appear to have any impact on the ongoing earnings recovery.

As we head into Q4 FY17 earnings season, we should see some better numbers even from banks as banks are largely done with their provisions. Recent rally in Nifty is largely on expectations of good earnings.

Mid Cap - Annual Earnings and Revenue Growth
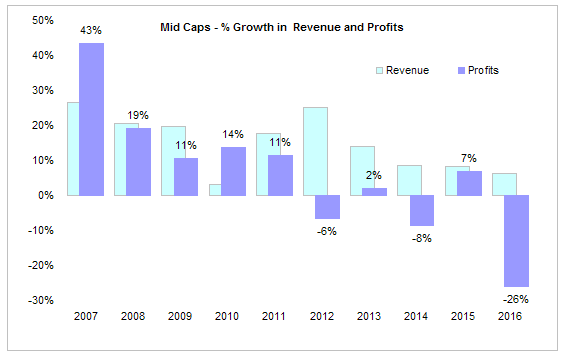
Source: Capitaline

Mid caps did well along with large cap during the 2007-2011 period but could not sustain the earnings growth during the high inflation period of 2012-14.Although they were able to pass on higher input costs to customers, they had to absorb some of the costs resulting in lower earnings. Although Mid caps began earnings recovery sooner than large cap, many PSU banks in Mid Cap index reported huge losses in FY16 hence midcap index as a whole reported huge losses in FY16. Excluding these banks, Midcaps have done well in since FY15 and that can partly explain out performance of midcaps over last 2-3 years.

Mid Cap - Quarterly Earnings and Revenue Growth
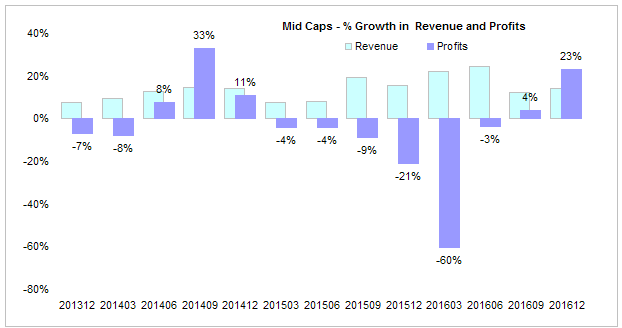
Source: Capitaline

Quarterly earnings chart revel the huge losses reported by banks in Q3 & Q4 of FY16. Since then earnings have began to recover and Q4 of FY17 should see some good numbers.

Small Cap - Annual Earnings and Revenue Growth
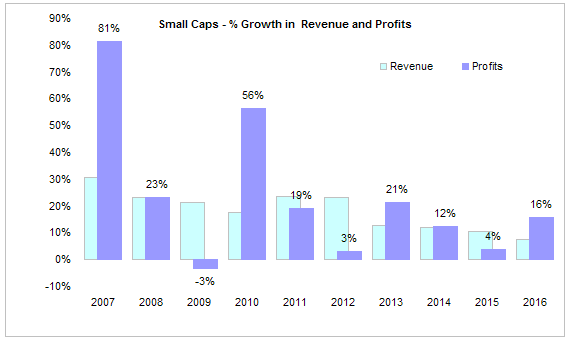
Source: Capitaline

Small caps have performed much better than mid large caps although the data set does have a survivorship bias. Since I took current members of BSE Small Cap Index and aggregated their earnings going back 10 years, only the good small caps have remained in this list. This kind of bias is most prominent in small caps than large and mid caps as current members of large cap index have been members of large cap index for much of the last 10 years.

Small Cap - Quarterly Earnings and Revenue Growth
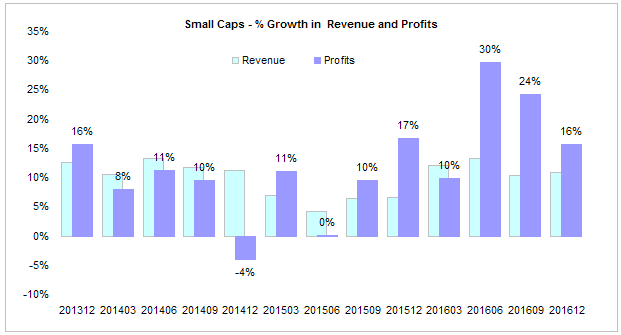
Source: Capitaline

Quarterly results also show that small caps have seen much better earnings recovery than mid and large caps. This is mainly because banks and commodity stocks are missing from this index. These stocks tend to be much larger in size so they are represented in mid and large cap indexes.

Overall I think earning recovery is well underway and we should see some good numbers in Q4 FY17. Its also the time of the year companies come up with annual forecasts (which analysts pick up and relay in their reports). If the commentary is good, it will add fuel to the fire.

6 Likes

Of the 101 companies out of BSE500 index that reported earnings so far in Q4 FY2017, revenue growth has come in at 16% and profit growth is at 8%. Most of the drag on profits in same period last year was from PSU banks none of which have reported earnings so far.

Source: Capitaline

2 Likes