The updated numbers are below. Some of the major highlights for me were:
ANDA filing rate has been maintained. US revenue per launch reduced drastically from 23.5 cr. in FY21 to 15.87 cr. in FY22
Gross margins were at ~73%, with all the pricing pressure they were able to maintain good gross margins
Domestic market is doing very well which is a reflection of change in strategy (MR productivity increased from 30 lakh in FY21 to 35 lakhs in FY22 + 500 new MRs were added).
Alembic Pharma was able to get one new brand in top 300. Domesti market share has increased slightly from 1.4% in FY21 to 1.5% in FY22 (mostly because of very strong growth in azithral which crossed 450 cr. sales in 2021)
Changed 3PL distributor in USA
In domestic markets, company doesn’t focus on new to market launches. The approach is to gain market share gradually in already existing molecules
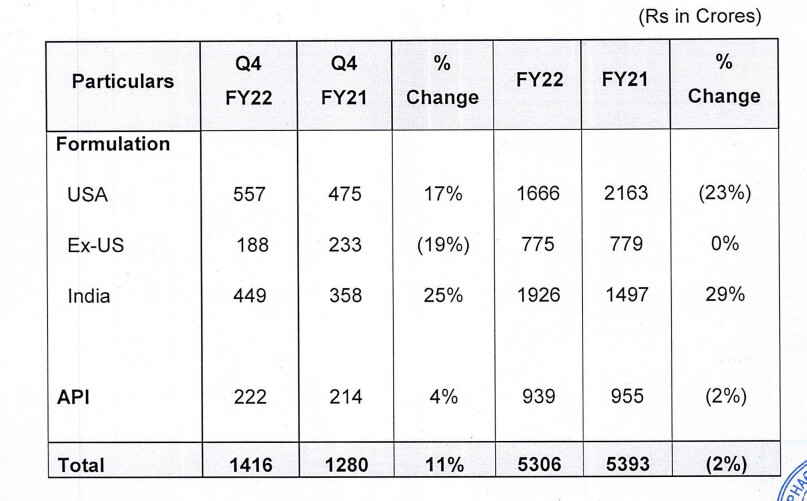
US growth has been due to increase in market share in some products + few shortages
Indian brands are currently valued very highly, not ready to acquire at these multiples
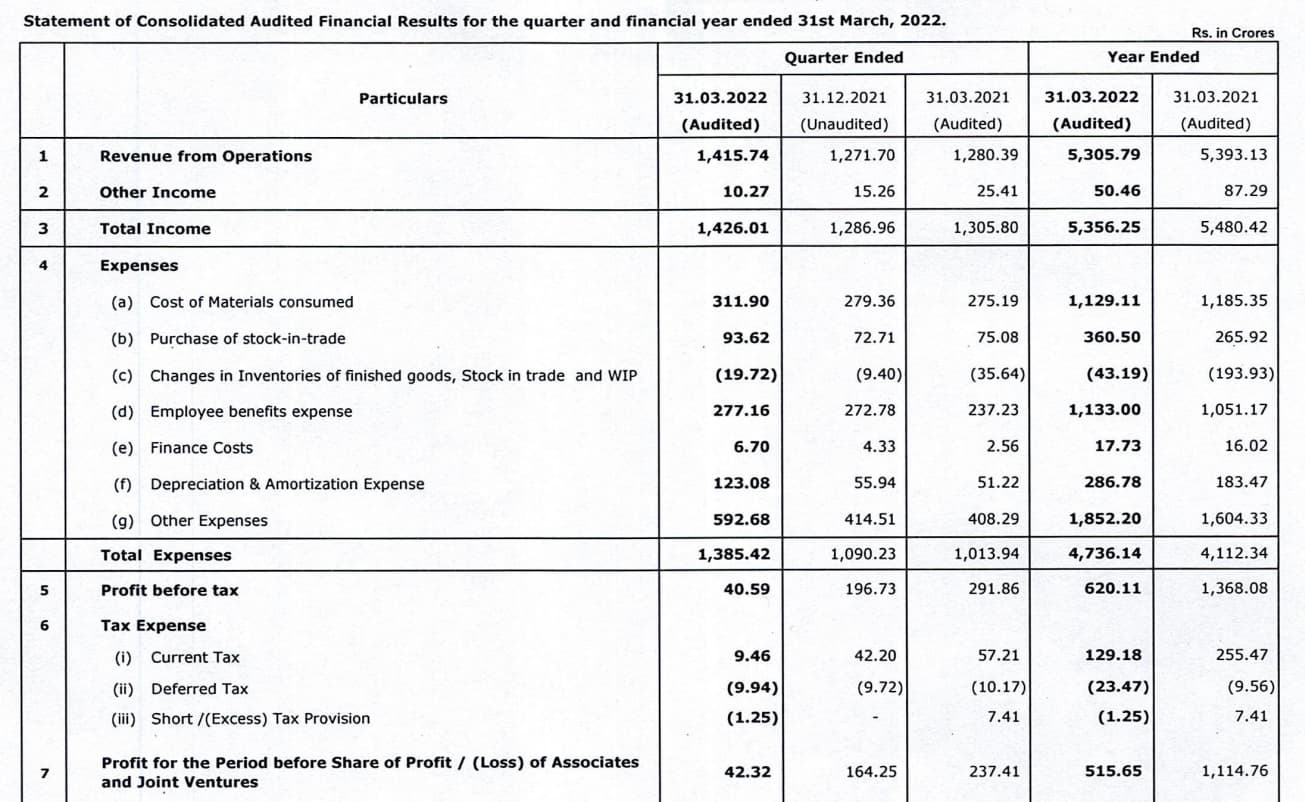
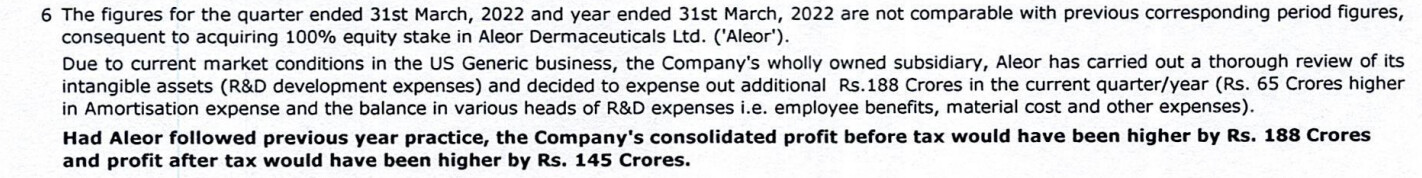
High R&D is because of accelerated amortization of R&D costs from Aleor
FY16
FY17
FY18
FY19
FY20
FY21
FY22
Cumulative ANDA filed
76.00
96.00
132.00
161.00
183.00
212.00
230.00
Cumulative ANDA approved (tentative excluded)
42.00
46.00
61.00
77.00
107.00
123.00
138.00
Products commercialized
34.00
37.00
44.00
53.00
76.00
92.00
105.00
Products commercialized (own frontend)
86.00
DMF filing
81.00
90.00
94.00
100.00
109.00
117.00
125.00
Consolidated revenue
3’181.20
3’134.00
3’131.00
3’935.00
4’606.00
5’393.00
5’306.00
US revenues (mn $)
130.38
177.56
India
1’103.60
1’254.00
1’274.00
1’382.00
1’425.00
1’497.00
1’926.00
International formulations
1’461.50
1’236.00
1’206.00
1’782.00
2’473.00
2’942.00
2’441.00
International generics
International branded
US
1’227.66
919.00
920.00
1’288.00
1’976.00
2’163.00
1’666.00
Non-US
233.84
317.00
286.00
494.00
497.00
779.00
775.00
Export incentives
APIs
524.90
643.00
651.00
771.00
708.00
955.00
939.00
R&D expense
10.88%
13.72%
13.09%
12.66%
14.00%
12.42%
15.80%
R&D (cr.)
346.00
430.00
410.00
498.00
645.00
670.00
838.35
CAPEX
320.00
480.00
600.00
626.00
697.00
687.00
467.00
EBITDA margin
31.62%
19.56%
20.50%
22.24%
26.34%
30.24%
18.00%
PAT margin
22.61%
12.73%
13.06%
14.84%
18.00%
21.84%
10.29%
Debt
ROCE (excluding new projects)
53.00%
27.00%
25.00%
30.00%
32.00%
41.00%
19.00%
Indian MR count
5’000.00
5’000.00
5’000.00
5’000.00
5’000.00
5’000.00
5’500.00
India acute share
37.00%
33.00%
34.00%
33.00%
36.11%
India specialty share
54.00%
58.00%
56.00%
57.00%
52.78%
India vet share
9.00%
9.00%
10.00%
10.00%
11.11%
India market share
1.73%
1.50%
1.57%
1.50%
1.40%
1.50%
India (brands in top 100)
India (brands in top 300)
5.00
5.00
5.00
5.00
3.00
2.00
3.00
India revenue per MR (lakh / year)
22.07
25.08
25.48
27.64
28.50
29.94
35.02
US revenue (mn $) per launch
2.96
3.35
US revenue (cr) per launch
36.11
24.84
20.91
24.30
26.00
23.51
15.87
US revenue (cr) per accepted
29.23
19.98
15.08
16.73
18.47
17.59
12.07
Disclosure: Invested (position size here, no transactions in last 30-days)
F3 (Karkhadi): General injectables (10 observations pushes back commercialization by few months; filed 15 ANDAs) + Ophthalmic (awaiting regulatory approval)
Launched 13 products (vs 16 in FY21), filed 23 ANDAs (vs 29 in FY21), got 15 final approvals (vs 16 in FY21), filed 8 DMFs (same in FY21)
Top-5 suppliers in 62 products (vs 47 in FY21)
Witnessed steep pricing pressure in FY22
FY22 is the new base and company will grow by launching new products. Plan to file 25 ANDAs annually and launch 15 products (OSD, injectables, ophthalmic, derma)
Pipeline of 131 ANDAs
Filling rates have stayed at 97-98% in last 3-years leading to high reliability. Refused few customers where back end supply chain was fully occupied
Aleor became wholly owned subsidiary (paid 76 cr. for 40% stake; FY22 sales: 38.9 cr.). Expensed out 188 cr. in intangible assets
Competitive pressure in derma space has increased significantly. Aleor is positioned as a low cost manufacturer
Non-US generic (sales: 775 cr., de-growth @(-1%))
149 filings
Have presence in 20+ countries in Europe. Mostly tender driven market
Australia: Few distributors control entire market. Currently have 23 dossiers commercialized or approved
South Africa: Ventured in 2014, have witnessed success recently. Currently have 23 dossiers commercialized or approved
Looking to venture in LATAM, filing aggressively in South-east Asian markets
Domestic business (sales: 1’926 cr., growth @29% vs 18% for industry)
10 therapeutic areas (vs 10 in FY21), 18 (vs 17 in FY21) marketing divisions, 5500+ MRs (vs 5’000 in FY21) catering to 2.22 lakh doctors (vs 1.75 lakh in FY21)
Launched 5 new products
1.51% market share (vs 1.4% in FY21), 3 brands in top-300 (vs 2 in FY21). 9-10 brands generating 50 cr.+ sales
Gained due to COVID and black fungus (azithral, amphotericin)
21.5% (vs 19% in FY21) product in NLEM, 64% (vs 69% in FY21) of sales came from chronic and 36% (vs 31% in FY21) from acute
Have revamped complete Indian MR team and infused young talent directly from colleges. 66% of field force is under 30
Migrated stockist to lower inventory model which led to higher demand-pull thereby improving MR attrition
Registered strong growth in women healthcare portfolio
API (sales: 939 cr., de-growth @(-2%))
Ex-azithromycin portfolio grew well
Manufactures 100 APIs, 38% captive consumption (vs 33% in FY21)
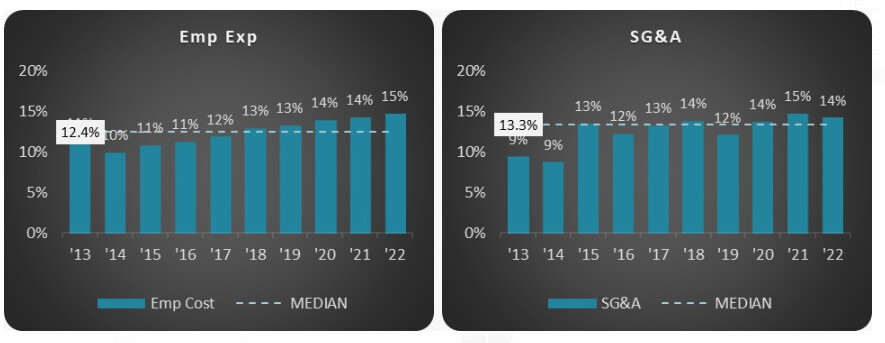
R&D (15.8% of sales vs 12.4% in FY21)
838 cr. (vs 694 cr. in FY21), 90% of R&D spends are targeted towards US market
Created a dedicated technology transfer team to facilitate seamless DMF/ANDA filing
Three R&D segments – formulations, API and peptides
Company has created a peptide R&D unit a few years back to develop peptide APIs for complex injectables. Company has built 100% in-house capability in doing characterization of peptide-based injectables
Intensified efforts to maximize solvent recovery, reducing consumption of fresh solvent in manufacturing process. Residue generated in the solvent recovery process, which used to be incinerated earlier, is now sent to cement factories in vicinity
1200+ R&D employee strength (same as last year)
Facilities in Vadodara, Hyderabad and New Jersey
o Vadodara unit is the mainstay innovation center developing non-oncology molecules
o Hyderabad unit develops oncology and non-oncology molecules
o US unit is focused on developing and filing oral solids and liquid products. It adds complimentary skill sets in soft gelatin based oral solids and oral liquids
Capex (482 cr. vs 687 cr. in FY21)
Have cumulatively invested 3’000+ cr. over last 5-years
Financials
Revenues de-grew by (-2%) to 5’306 cr., EBITDA margins: 18% (vs 30% in FY21), PAT margins: 10% (vs 22% in FY21), R&D: 15.8% of sales (vs 12% in FY21), ROCE (excluding new projects): 19% (vs 41% in FY21), ROE: 11% (vs 23% in FY21), Debt to equity: 0.12 (vs 0.1 in FY21)
Miscellaneous
Hedge 35-40% of net exposure
Employees: 11’974 (vs 12’160 in FY21)
KMP remuneration (including close members to KMP): 86 cr. (vs 88 cr. in FY21)
Related party purchases from Shreno Publications: 31.96 cr. (vs 26.16 cr. in FY21)
CSR: Spent 22 cr. (vs 17.6 cr. in FY21) (no outstanding obligations)
Shareholders: 108’622 (vs 101’950 in FY21)
Auditor remuneration: 1.51 cr. (vs 1.4 cr. in FY21)
Contingent liability: No major liability except corporate guarantee of 61.35 cr. (vs 96.04 cr. in FY21)
Disclosure: Invested (position size here, bought shares in last-30 days)
APL CWIP is more than “net asset”. Many of the projects have started 3 years back.
3000 Cr CAPEX in last 5 Years, went into:
following theoretic areas/delivery mechanism:
a) Dermatology,
b) Ophthalmology,
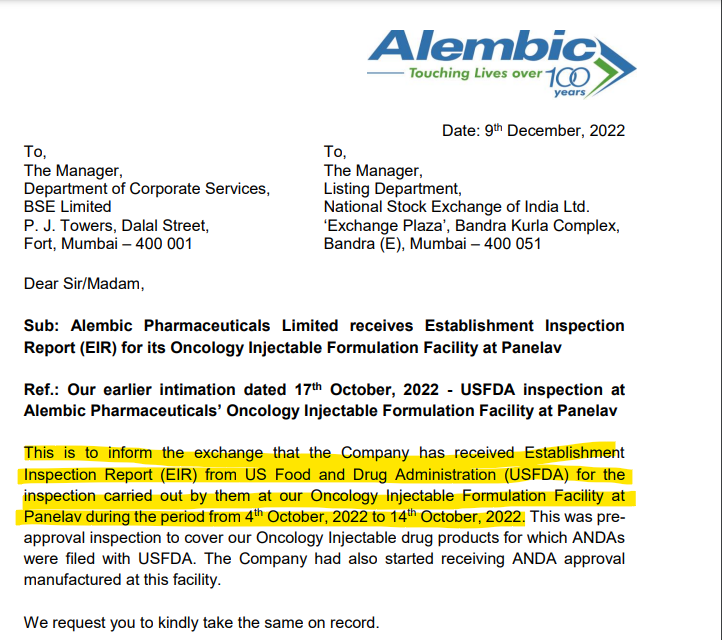
c) Oncology
d) Injectable Formulations
which have reasonably less competition
3 facilities are waiting for approval
a) F2 - oral solids - already approved
but, waiting for patent expiry
My interpretation: meaningful revenue 2-3 years away
b) F3 - injectable unit
USFDA observation setback
remediation - 1 year
validation batches - 1-1.5 years
commercialization ramp up - 1-1.5 years
My interpretation: meaningful revenue 3-4 years away
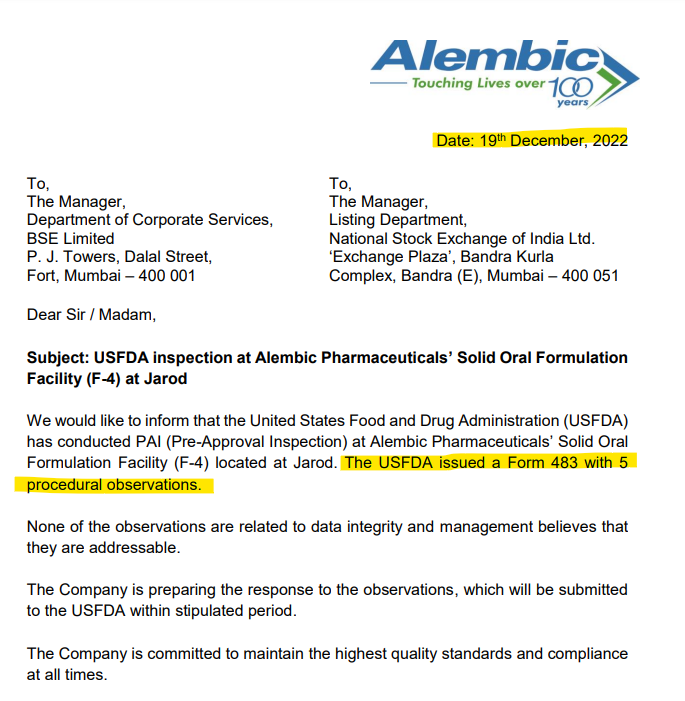
c) F4 - manufacturing oral solid dosages
My interpretation: meaningful revenue 3-4 years away
Current plants in Gujarat (6) are running in full capacity.
AP is turning away new customers.
Above average topline growth (15% or above) seems to be
3 to 5 years away. As these CAPEX are funded from internal
accrual, no worries about interest payment. However, aggressive
depreciation policy, if adopted, might reduce profit in
the next few years.
Another bad set of numbers, revenues de-grew by (5%) and company reported net losses (largely due to Aleor R&D expensing). Ex-of that, margins have been hit and came at around 10% vs 18-20% in last year. Price erosion is mid double digits in US. Concall notes below.
FY23Q1 concall
US generics sales was flat despite gain in market share in existing products + launch of 5 new products. Will launch 5-6 in Q2 and 15-18 products in FY23
US base business is $50-55mn. Next quarter it will be close to $50mn as company is seeing lot more price erosion (low double digits) right now vs what they were seeing at end of Q4
In domestic business, branded business (ex-covid) grew @20%
R&D write-offs in Aleor worth 115 cr. – 100 cr. was booked in other expenses + 15 cr. in depreciation (40 cr. is residual value)
Total Aleor R&D spends were ~350 cr. in last 3-4 years. Alembic itself expenses out its R&D
R&D costs will stay at 650-700 cr. annually
Of the operational expenses in CWIP, 180-200 cr. will be cash expenses and 150 cr. of depreciation (once the plants are operationalized)
Disclosure: Invested (position size here, bought shares in last-30 days)
Sales growth look a bit higher than they actually are due to one-time opportunities in US. The good news is they have finally started getting approvals for injectables. Concall notes below.
FY23Q2 concall
US base business is $45-50m, quarterly revenues were higher at $52mn due to certain one time opportunities
US price erosion was in high teens. In some products, it was as high as 30%
Normalized API business growth is 10%, it was higher this quarter
F2 & F3 plants have 50 filings of which 7-8 are oral solids and rest are injectables
gBrovana: Market share increased to 10% (commercialized through CMO)
Ex of covid (amphotericin-B) sales, Indian business growth was 11% YOY
15% of domestic portfolio is under NLEM
Disclosure: Invested (position size here, no transactions in last-30 days)
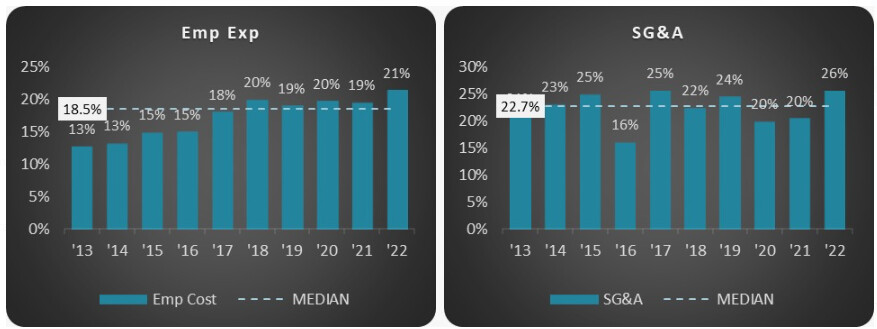
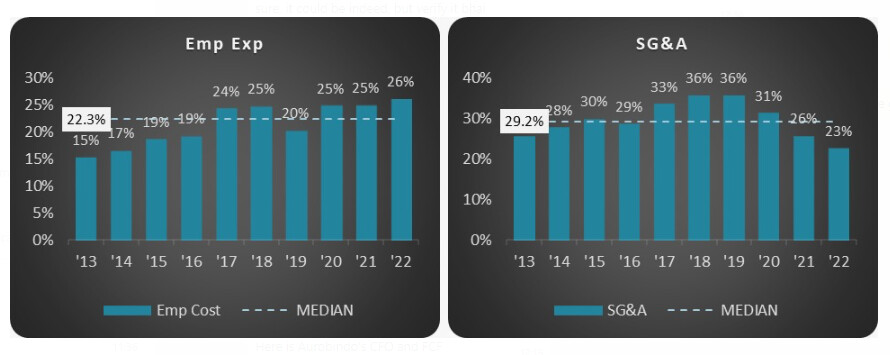
When we compare Alembic with it’s peer Aurobindo / Unichem they are burning too much under Employee expenses and SGNA, could you please share your thoughts ?
Employee expenses:
As per FY22 Annual report, Alembic Pharma spent 838cr which is 15.8% of revenue 5306 cr. Has 1300+ employee in R&D out of 12,216 employee. R&D employee salary will be far higher than non-R&D employee.
Aurobindo has only 1500+ in R&D out of 23000+ employees as per FY22 Annual report.
so you need to consider these factors as well when looking at employee expenses.
Any way to check the classification assigned to the below - OAI (Official Action Indicated), VAI (Voluntary Action Indicated), NAI (No Action Indicated)?
Alembic Pharma – Management Meet Update (Source Nirmal Bang 25 Nov 22)
In Indian and RoW markets, the company continues to expect double-digit growth on a normalized base. However, in the US, it continues to face acute pricing pressure due to the only OSD portfolio. Alembic has reiterated US$45-50mn quarterly US sales guidance in the near term. However, this run-rate may increase once injectable approvals start contributing meaningfully next year onwards. Despite aggressive spends on capex and R&D for the US market, we do not see any meaningful visible large launches. Also, margins are expected to remain under pressure due to
~Rs2bn of addition cost incurred on new plants, which are likely to start reflecting in P&L 4QFY23 onwards.
Alembic has reiterated US$45-50mn quarterly US sales guidance in the near term.
The company is only into Oral Solid Dosages (OSD) and continues to face high double-digit price erosion in the base business.
As per the management, the US is sitting on decadal high inventory levels and given the limited shelf life, there is a frenzy to sell products before expiry. Many players are recovering only partial costs. Distributors too are skeptical about filling lines today, which stand at 80-85% as against 90-92% earlier. The situation has improved over the last quarter though.
The company is expecting 25-30 approvals, including 10-15 injectable approvals for the next year.
It has filed ~50 injectable products, for which approvals are expected over a 3-year timeframe.
The share of OSD formulations would remain higher in future ANDA filings. However, current pending approvals are equally divided betweenOSD and injectables.
The company cumulatively has ~250 ANDA filings, with 100+ global authorization and 126 DMF filings
The management expects small and meaningful market share in gApriso. There are already 10 players in the market for this product.
The company has aspiration to clock ~US$350-400mn in annual US sales over the long-term horizon.
CWIP of ~Rs24bn pertains to F2, F3 and F4 facilities. F2 is an oncology facility while F3 is an injectables facility and F4 is an extension of F1 facility, which manufactures OSD.
The new F2 and F3 facilities will start taking batches from Dec’22/Jan’23 and post that will start commercialising products.
The company has received product approvals from the new facility, but plant approval is still pending.
For the new plants to achieve breakeven levels at the current gross margins, ~Rs5-5.5bn of sales are required
India
The company expects the domestic business to continue to grow at 10-12% annually.
Domestic business growth is expected to be driven by continuous strong growth in high focus brands, expansion of customer base and optimization of business operations.
Current MR strength stands at ~4,700, which may inch up to ~5,000 by the end of FY23. The company is not looking for any large MR addition in the near term.
500 MRs have been assigned to the Animal Health business, with the rest equally split between Acute and Chronic therapies.
MR productivity stood at Rs0.35mn. MR productivity for Speciality and Acute business varies by (+/-) Rs25,000.
The Acute business would be driven by growth in Macrolide Antibiotics such as Azithromycin and Clarithromycin among others.
The Animal Health business is reporting robust growth of 30%. It is largely a B2C business for the treatment of diseases in both Poultry and Large animals.
Others
The RoW markets are expected to report strong growth of 10-15%. Most of these markets have better realizations and higher gross margins than the US business. The company is increasingly focusing on GCC and South East Asian markets.
It has guided for Rs6bn of R&D spending in FY23 and Rs5.5bn in FY24
The company has guided for Rs2.5bn of annual capex for the future.
from the concall i gather that this $500M was anyways an aspirational target and not their current run rate… and the management may have decided to scale that down given the low margin environment in the US.
Market has definitely read it negative, price down another 10% from the already battered levels…
what do you make of this @harsh.beria93.
Most of the Indian Parma serving US are having pricing pressure for the past 5+ years. A few years back, the reason given was buyer consolidation and bargaining power of them. Is it the only reason for current pricing pressure or any other reasons?
Many Indian Parma companies are adding capacity at break-neck speed. Is the industry overspending on capacity?
Impairment is like valuating the assets i.e. machinery and other things to market value to current period. As a result company can show it up as loss incurred. One question here in this case is, the recent capex has been written as impairment- which shows company lack of understanding the macro situation and capex done at wrong time. Company is writing of half value of assets now and half value of assets once new sites start making money.
As a result reserves are going to decrease for now.
This is like management telling the shareholders:
a) that they took big decisions like investing in new P&M in India to cater to US market, without doing detailed homework.
b) Now that there is substantial price erosion faced by the Co, in US market, the new capacity will never be fully utilized and if not written off partly/substantially, the depreciation hit would be a major drag on the Co.'s P&L, going forward.
c) hence, the management prefers to bite the bullet in the FY 2022-23, by writing off Rs. 1150 cr worth of CWIP.
d) for maintaining an optical illusion, this write-off would be done by reducing the balance in the General Reserve rather than the FY 2022-23 PBT.
Big question here is how detailed was the management’s homework before taking the investment decision? Had they sought the opinion of US based pharma consultants or not?
Disc.: Was invested for over 4 years, but sold off after reading the doom & gloom in management commentary post Q1 FY 2022-23 results.
Ok, so eps will not look ugly because of this right? And also I wanted to know, since they are tapping general reserve for this, is their a possibility that this amount is being siphoned off from company in this way for their own use…? Just guessing, not good in all this…