US FDA finds quality control, equipment issues at Alembic Pharma unit
Read more at:
US FDA finds quality control, equipment issues at Alembic Pharma unit
Read more at:
Since the observations are for the new facility, their existing revenues will not be impacted and it will be business as usual. The share price is already in depressed state considering the latest US growth and increased competition in Sartans space. So I don’t think there will be much downside from here but upside will depend on how quickly the company can resolve the issues and bring the new revenue streams online. Purely my personal view. Thanks!
However are there not chances that product launch from this plant may be delayed by a few months, thus no revenue but recurring fixed costs of the plant?
Good results posted a few Q back were due to \sartans\ drug which is facing huge competition now. Also, 483 observations will delay the new launches for 6/9 months which will further put pressure on earnings. The stock price will be in pain for the next 1 year. If the view is 3+year then can hold or add on dips.
I prefer to shift to Alkem or Gland both are better when it comes to USFDA.
What’s the basis behind saying the 483 observations will delay new launches for 6/9 months? As per management the observations were procedural in nature and they’ve already got anda approval for Trepostinil injection which is an injectable from the same facility that these observations are from… so again… why 6/9 months?
Also, sartans and USA growth was expected to slow down and hence why management had given EpS guidance for next year which they don’t usually give and they’ve given in clear numbers what they expect USA market to be at in 3 years. Domestic and Other countries is picking up so they do have other growth drivers too.
The injectable facility approval will only help them further and as of now there is no indication that it will be an issue whatsoever.
Btw alembics track record with the usfda is fantastic… there are reasons to shift to other companies… I do agree… But the usfda is not usually one when it comes to alembic. This was their first every injectable facility and getting an approval for these is tricky. The fact they managed to get just 5 procedural observations is good news imo. Anyway… we’ll know either way in about a week or so
I like the company but I am bearish in the short term.
delay in 6/7 months to launch means earnings growth gets delay but the fixed cost related to the plant will be there and may put margins under a bit of pressure.
the second major reason is technically bearish.
I do not stay in a stock that closes below and sustains 200 DMA. Be it a blue-chip or best of the best stock.
in the future, If it closes above 50 DMA and sustains I will re/enter agin.
Hi Sandeep,
Looking at the packaging label here for Treprostinil:
Specifically this image:
https://dailymed.nlm.nih.gov/dailymed/image.cfm?name=treprostinil-1-mg-carton.jpg&setid=4a684b13-669d-4721-8ed4-30cc7762b0b8&type=img
It appears that for this ANDA of Treprostinil, Alembic is getting this manufactured by “Corden Pharma”. So essentially, Corden Pharma may be the CMO for Alembic in this case. Therefore, this may NOT indicate that Karkhadi injectible facility has a green signal from US FDA.
Amit Rajan, whom @harsh.beria93 had spoken to for pharma insights, also hinted at the same in his tweet:
Can we validate this from some industry connect ?
Meanwhile…
Good find, Manprit. This is Corden Pharma S.p.A. manufacturing as per source: here. No mention of Alembic Karkhadi plant in there. Indeed, this ANDA approval is no green signal for F-3 Karkhadi facility. I stand corrected (my bad). Thanks for finding and writing.
Now both alembic and Aurobindo is trading with P/E below 15 . And industry’s average is 39 .
Both are fantastic companies sales growth, profit , valuations all good …
May be Coz of US facing business , cut throat competition in generic druy, USFDA issues n low pricing power it remains undervalued.
Will it re- rate in near future or underperformance will continue?
Suggestions will be helpful.
Hi Sandeep,
The fact that the ANDA approval was for Alembic Global Holding SA and not Alembic Pharma made me look further and that led me to the link to Corden Pharma.
I am still new to pharma and learning the ropes. Do you have further insights on the following:
Thanks in advance.
Aleor has received final approval from the USFDA for its Abbreviated New Drug Application (ANDA) for Testosterone Gel, 1.62%. It has an estimated market size of $86 million for twelve months ending December 2020.
Thanks!
Alemic announced today that its joint venture Aleor has received tentative approval from the US Food & Drug Administration (USFDA) for its Abbreviated New Drug Application (ANDA) for Efinaconazole Topical Solution, 10%.
The approved ANDA is therapeutically equivalent to the reference listed drug product (RLD), Jublia Topical Solution, 10%, of Bausch Health Americas, Inc.
Efinaconazole is indicated for the topical treatment of onychomycosis of the toenail(s) due to Trichophyton rubrum and Trichophyton mentagrophytes.
Efinaconazole has an estimated market size of USD 233 million for twelve months ending December 2020 according to IQVIA.
Alembic came with the results and declared the dividend of Rs. 14
Some observations -
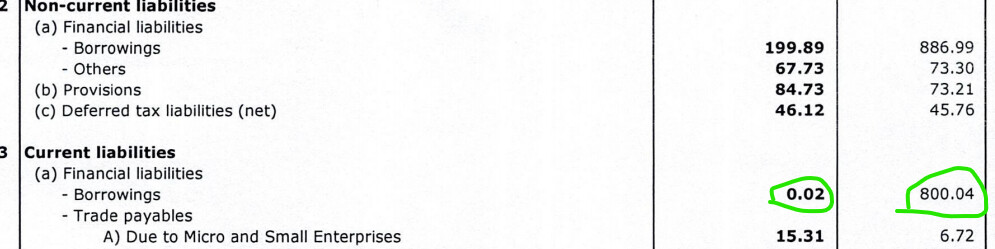
-Working capital loan seems to have completely paid off
-Strong cash flow on account of better profits and realizing receivables
Any insights from fellow members on state and outlook of the business would be really helpful.
Not aware about size and time
I am sharing some of my notes on Alembic Pharma.
Rapid growth phase (FY10-16)
Alembic filed their first US ANDA in FY07 and launched their first product in FY09. The number of filings per year were 8-10 which resulted in 76 ANDAs filed by FY16, 42 approvals (excluding tentative) and 34 commercialized products. As Alembic was a bulk drug manufacturer (aka API), their strategy was to be backward integrated in a majority of their filings reflected in their DMF of 81 by FY16.
International formulation sales became 10x in 6 years growing from 148 cr. in FY10 to 1462 cr. in FY16. Domestic sales and API growth were much lower at 11% and 10% rates in this time period. Valuations grew from <1 EV/sales to a peak of >6x EV/sales.
| FY08 | FY09 | FY10 | FY11 | FY12 | FY13 | FY14 | FY15 | FY16 | |
|---|---|---|---|---|---|---|---|---|---|
| Cumulative ANDA filed | 11.00 | 18.00 | 26.00 | 38.00 | 45.00 | 57.00 | 61.00 | 68.00 | 76.00 |
| Cumulative ANDA approved (tentative excluded) | - | 4.00 | 7.00 | 15.00 | 19.00 | 24.00 | 32.00 | 33.00 | 42.00 |
| Products commercialized | 21.00 | 26.00 | 34.00 | ||||||
| DMF filing | 17.00 | 28.00 | 39.00 | 53.00 | 62.00 | 60.00 | 66.00 | 72.00 | 81.00 |
| Consolidated revenue | 1’034.97 | 1’206.64 | 1’467.89 | 1’526.00 | 1’868.40 | 2’067.70 | 3’181.20 | ||
| India | 584.90 | 693.44 | 782.61 | 886.30 | 971.30 | 1’103.50 | 1’103.60 | ||
| International formulations | 147.76 | 223.92 | 298.50 | 279.90 | 542.00 | 582.00 | 1’461.50 | ||
| International generics | 102.00 | 173.77 | 241.80 | 235.80 | 468.40 | 518.50 | |||
| International branded | 45.76 | 50.15 | 56.70 | 44.10 | 73.60 | 63.50 | |||
| US | 316.00 | 1’227.66 | |||||||
| Non-US | 266.00 | 233.84 | |||||||
| Export incentives | 10.10 | 14.87 | 13.32 | 9.30 | 16.30 | 15.70 | |||
| APIs | 292.21 | 274.41 | 373.46 | 350.50 | 338.80 | 366.50 | 524.90 | ||
| R&D expense | 4.51% | 3.60% | 4.30% | 4.01% | 4.74% | 5.05% | 7.01% | 6.72% | 10.88% |
| R&D (cr.) | 44.50 | 48.40 | 69.60 | 77.00 | 131.00 | 139.00 | 346.00 | ||
| CAPEX | 130.00 | 320.00 | |||||||
| EBITDA margin | 13.28% | 15.02% | 16.77% | 19.14% | 19.64% | 31.62% | |||
| PAT margin | 7.08% | 8.87% | 10.83% | 12.60% | 13.68% | 22.61% | |||
FY16 was a turning point where Alembic made windfall gains from abilify. All this money was invested back into R&D and capex. Additionally, they setup their front end in the US market moving away from the partnership model.
Starting FY17 with a nimble frontend team, Alembic started aggressively expanding into US generics market, with filed ANDAs expanding from 96 in FY17 to 212 in FY21 (average 29 ANDAs filed each year from 8-10 in previous years). To provide some context, only Aurobindo filed more ANDAs than Alembic.
This reflected in higher R&D spends varying between 12-14% of sales. However, R&D per ANDA is in-line (or lesser) than other peers (as shown by Yachna earlier).
Interestingly, higher amount of money was spent on capex (3090 cr.) compared to R&D (2653 cr.) over FY17-21. In general, capex productivity is higher than R&D productivity (attached a report from Phillip capital) and Aurobindo is an absolute maverick in this.
From FY17-21, Alembic’s consolidated sales grew at 14.5% which was because of higher non-US sales (growing at 25.2%) and US growing at 23.86%. APIs and domestic business again lagged growth at 10.4% and 4.5% respectively.
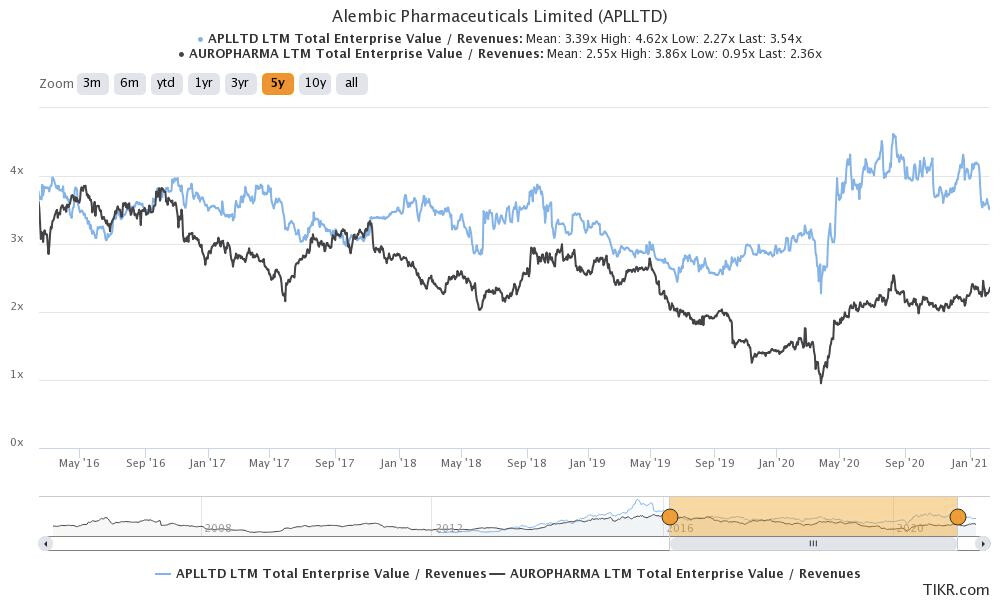
FY20 was the next year when company made windfall gains from the sartans shortage. However, this time market didn’t take valuations to an extreme (>6x EV/sales) as this story had been seen in the past.
One notable thing is market has consistently valued Alembic higher than Aurobindo although both make money by being backward integrated. Aurobindo uses scale to its advantage i.e. they launch everything whereas Alembic is more measured in their launches which is also reflected in their difference b/w ANDAs approved vs launched products. This is why Alembic has higher gross margins than aurobindo.
| FY17 | FY18 | FY19 | FY20 | FY21 | |
|---|---|---|---|---|---|
| Cumulative ANDA filed | 96.00 | 132.00 | 161.00 | 183.00 | 212.00 |
| Cumulative ANDA approved (tentative excluded) | 46.00 | 61.00 | 77.00 | 107.00 | 123.00 |
| Products commercialized | 37.00 | 44.00 | 53.00 | 76.00 | 92.00 |
| Approved ANDAs not launched | 9.00 | 17.00 | 24.00 | 31.00 | 31.00 |
Here is the detailed breakup.
| FY17 | FY18 | FY19 | FY20 | FY21 | GROWTH | |
|---|---|---|---|---|---|---|
| Cumulative ANDA filed | 96.00 | 132.00 | 161.00 | 183.00 | 212.00 | |
| Cumulative ANDA approved (tentative excluded) | 46.00 | 61.00 | 77.00 | 107.00 | 123.00 | |
| Products commercialized | 37.00 | 44.00 | 53.00 | 76.00 | 92.00 | |
| DMF filing | 90.00 | 94.00 | 100.00 | 109.00 | 117.00 | |
| Consolidated revenue | 3’134.00 | 3’131.00 | 3’935.00 | 4’606.00 | 5’393.00 | 14.53% |
| India | 1’254.00 | 1’274.00 | 1’382.00 | 1’425.00 | 1’497.00 | 4.53% |
| International formulations | ||||||
| US | 919.00 | 920.00 | 1’288.00 | 1’976.00 | 2’163.00 | 23.86% |
| Non-US | 317.00 | 286.00 | 494.00 | 497.00 | 779.00 | 25.20% |
| APIs | 643.00 | 651.00 | 771.00 | 708.00 | 955.00 | 10.39% |
| R&D expense | 13.72% | 13.09% | 12.66% | 14.00% | 12.42% | |
| R&D (cr.) | 430.00 | 410.00 | 498.00 | 645.00 | 670.00 | 11.73% |
| CAPEX | 480.00 | 600.00 | 626.00 | 697.00 | 687.00 | 9.38% |
| EBITDA margin | 19.56% | 20.50% | 22.24% | 26.34% | 30.24% | |
| PAT margin | 12.73% | 13.06% | 14.84% | 18.00% | 21.84% |
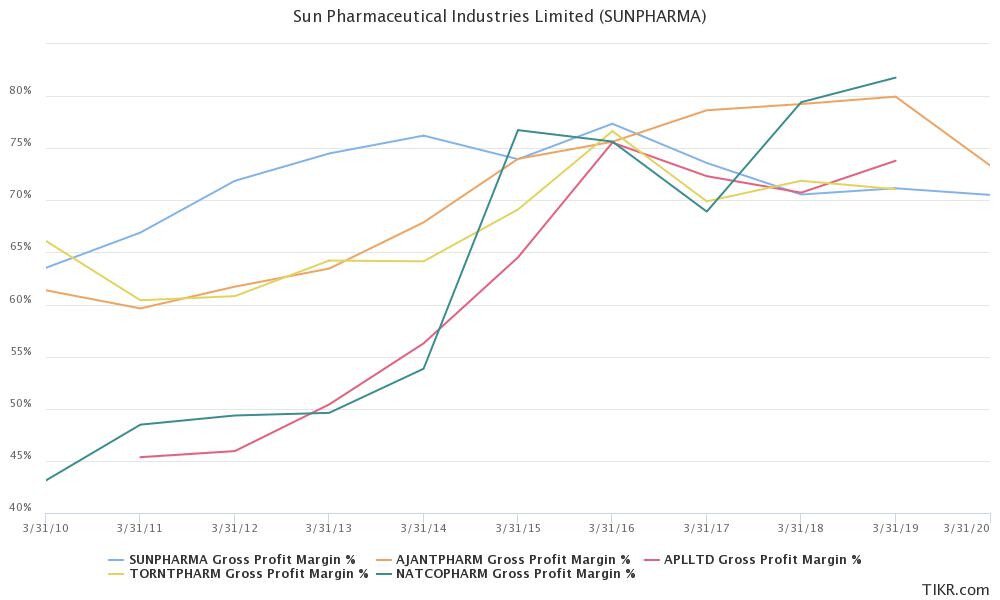
Margins
Due to Alembic’s business model of being backward integrated in a majority of their filings and limited launches, their gross margins are >70% (since FY15). There are only five Indian pharma companies that make >70% gross margins (Alembic, Ajanta, Sun pharma, Natco, Torrent). Alembic’s operating margins look lower (20-22% band) because of their very high R&D spends compared to peers.
India business
Alembic has consistently struggled to grow India business in-line with IPM. In FY11, they had a market share of 1.78% and in FY21 it stands at 1.4%. Additionally, they are losing in their key brands. Until FY19, Alembic had 5 brands in top-300 and in FY21 this has been reduced to 2. Their MR productivity at ~30 lakh/year is way lower than industry leaders, who make 50-60 lakh/year.
| FY14 | FY15 | FY16 | FY17 | FY18 | FY19 | FY20 | FY21 | |
|---|---|---|---|---|---|---|---|---|
| India revenue (cr.) | 971.30 | 1’103.50 | 1’103.60 | 1’254.00 | 1’274.00 | 1’382.00 | 1’425.00 | 1’497.00 |
| MR count | 4’000.00 | 5’000.00 | 5’000.00 | 5’000.00 | 5’000.00 | 5’000.00 | 5’000.00 | 5’000.00 |
| MR productivity (lakh / year) | 24.28 | 22.07 | 22.07 | 25.08 | 25.48 | 27.64 | 28.50 | 29.94 |
US revenues per launch
This number has largely varied between 20-25 cr. and is broadly in-line with industry standards ($2-3mn revenues per ANDA launched). Alembic spends $1-2mn per filed ANDA (7-14 cr.).
| FY15 | FY16 | FY17 | FY18 | FY19 | FY20 | FY21 | |
|---|---|---|---|---|---|---|---|
| Products commercialized | 26.00 | 34.00 | 37.00 | 44.00 | 53.00 | 76.00 | 92.00 |
| US revenues (cr.) | 316.00 | 1’227.66 | 919.00 | 920.00 | 1’288.00 | 1’976.00 | 2’163.00 |
| US revenue (cr) per launch | 12.15 | 36.11 | 24.84 | 20.91 | 24.30 | 26.00 | 23.51 |
International operations
Alembic is aggressively expanding into other international markets, with their international sales (ex-US) growing at 25%+ levels. Their ex-US operations are partnership dependent and focused on Australia and Europe. Australian pharma market has an oligopolistic structure and Europe is tender driven (lowest cost wins). My guess would be a large part of ex-US growth is coming because of EU operations.
Future growth areas
Alembic has identified four key pillars (Injectables, oncology, dermatology, ophthalmology) for future growth.
Disclosure: Not invested
Here are my notes from their FY21 annual report (link).
Manufacturing facilities:
Strategy
US (sales: 2’163 cr., growth @9%)
Non-US generic (sales: 779 cr., growth @57%)
Domestic business (sales: 1’497 cr., growth @5%)
API (sales: 955 cr., growth @18%)
Novel
R&D (12.4% of sales)
Financials
Miscellaneous
Modified opinion for financials of Aleor Dermaceuticals
Disclosure: Invested
Todays results confirms price erosion in US Generics. Company is trying to increase the home sales. Is it a trend for all pharma companies or this alone.