
R&D expenses
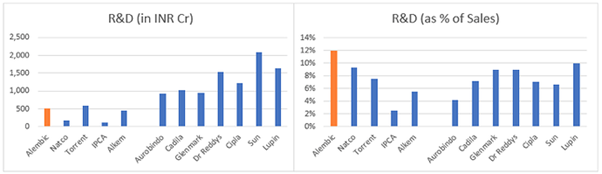
One of the concerns was the high R&D expenses as % of sales c. 13-14% of sales vs 4-8% for most other pharma companies (see chart below). The plausible explanation was the accelerated investment program of Alembic as compared to other players, on account of their late entry into US markets. (Pic source mgmt q&a).
To verify the above, I compared the total R&D expenses across few pharma companies over last 10 years divided by the incremental ANDA filings done by them in this period – to get an average R&D cost per filing over the years (see attached excel for details).
| Name | Avg R&D Cost per ANDA in Rs crs |
|---|---|
| Ajanta Pharma | 19.0 |
| Alembic Pharma | 18.8 |
| Torrent Pharma | 27.6 |
| Lupin | 44.7 |
| Cipla | 26.9 |
| Aurobindo Pharma | 18.2 |
The above methodology is only an approximation as it does not consider non-US sales of the company, sample set for comparison is small, does not consider time lag between R&D expense and ANDA filing, complexity of pipeline etc. But overall, over 10 years it averages out some of these elements. And this data broadly tells us that Alembic’s R&D costs are in line with competition and seem high as % of sales only due to the accelerated R&D program.
The same thing is also evident in the table below – which shows that Alembic has higher ANDA filings and higher pending approval ANDAs relative to the sales of the company:
| Name | Last 1-year turnover (annualized) | ANDA Filings | ANDAs pending approval |
|---|---|---|---|
| Ajanta Pharma | 2,588 | 55 | 23 |
| Alembic Pharma | 4,612 | 183 | 64 |
| Torrent Pharma | 7,939 | 145 | 45 |
| Lupin | 16,092 | 424 | 152 |
| Cipla | 17,132 | 259 | 62 |
| Aurobindo Pharma | 22,587 | 572 | 154 |
For instance, Cipla’s topline is 4x that of Alembic but number of pending approvals is similar and total filings is only c. 1.5x. This also reaffirms that as Alembic’s topline catches up, this aberration of high R&D expense % should correct, thereby aiding margins
alembic_R&D.xlsx (19.6 KB) .