Ajanta Pharma

I did an analysis of Lupin, Aurobindo and Ajanta as i felt these were in the Value range in the Pharma sector. I find Ajanta better Quantatively in some aspects like Sales/profit gowth, Ratios and Du Pont Analysis.

One discomforting thing i see for Ajanta is 17% Promoter’s holdings are pledged.
Any thoughts on the pledging part?

On pledging: Promoters total holding is 70% out of which 17% is pledged that means un-pledged holding is 58%. This means they still have significant risk in company even assuming pledges shares are sold out.

1 Like

Results: https://www.bseindia.com/xml-data/corpfiling/AttachLive/07ed911f-61de-4c01-9738-21635ef3516f.pdf

image

5 Likes

Good performance by ajanta.

All export geographies seem to be doing well. US business though small in size is growing well.

Total exports were 490 crores in q4 fy 20 as compared to 343 crores a growth of 43%. For fy 20, total exports was 1790 crores vs 1324 crores for fy 19. Out of total revenues of 2588 crores, export component was 1790 crores which is almost 70% of total sales.

Even dr reddys results today were quite good. There too export sales stole the show.

It seems most export facing pharma companies are on a strong wicket. Going ahead, strong dollar should also benefit these companies.

13 Likes

Hitesh bhai… any idea why Ajanta is lagging in dermatology segment in past quarters when it used to be a front runner in the dermatology? They have been consistently under performing the industry in this segment while doing well in others.

@akbarkhan

I think the marketing and product launches has been poor from Ajanta of late. Plus competition has intensified because of other biggies being aggressive in the segment.

Key area to monitor for ajanta and for most pharma companies for me is exports. That’s where the growth needs to be monitored. And I would prefer to look at companies which have large component of income from exports or companies that are majorly into APIs. There seems to be good growth shown across the board by most API companies.

14 Likes

My notes from Ajanta Pharma AR 2020

Ajanta Pharma:

Notes from AR 2020

Key business updates:

  • Ajanta pharma is a specialty pharma company engaged in development, manufacturing and marketing of quality finished dosage. 70% of business comes from branded generics and 30% comes from generics in USA and anti-malarial institutional business in Africa

  • Company has done Rs 2588 crore of revenue, has 8 manufacturing facilities and 7000+ employees

  • Revenue distribution: 30% from India, 26% of rest of Asia, 24% from Africa and 20% from USA

Business Segment:

Branded Generics:

  • Indian branded generics grew at 13% against industry growth of 11%

  • Branded generics in rest of Asia and Africa grew at 27% and 14% respectively with launch of 27 new products

Generics and Institutional:

  • Anti-Malarial institutional business grew at 25% on back of lower base of previous year. In the near term, expect this business to be volatile

  • US market had 82% growth through 7 new launches. Company is very positive about US business and expecting a reasonable growth in high teens in next couple years at the back of 10-12 new filings every year

Financial Performance:

  • Consolidated revenue grew by 26% to Rs 2588 crore whereas the markets performed well across generics and branded generics in emerging Asia and Africa

  • EBITDA margin was at 26% as operating cost of new plants to continue to charge to P&L whereas utilization levels of these new plants were still low.

  • Once these plants reach reasonable level of utilization, operating leverage benefits would kick in and lead to margin improvement

  • PAT grew by 21% to Rs 468 crore

  • Branded generics in emerging Asia and Africa grew at 22%

  • Despite capex of Rs 240 crore, FY20 generated operating free cash flow of Rs 235 crore. This will improve going forward as capex comes to an end

  • Return on capital employed is up from 23% to 26% but still lower than 44% 5 years back

  • With capex coming to an end, we expect easing of pressure on operating free cash flows

  • Out of total export, Asia is 38%, USA is 29%, Africa branded is 19% and Africa institutional is 14%

  • Material cost is up from 19% to 25% due to increase in share of US business and some raw material price increases. This is expected to remain in same range

  • Employee cost is up from 19% to 21% and other expenses down from 33% to 29% of sales

  • Some deterioration in working capital cycle is due to growing USA business

  • Rs 13 dividend declared with Rs 114 crore payout

  • Total R&D expenses is 7.57% of revenue and most of it is expensed

Annual Review of Management:

  • Major impact of covid will be seen in quarters ahead

  • Though demand disruption of covid on pharma is least compared to other industries, operational challenges are still huge

  • Launched 18 new branded generics product out of which 7 were first to market. Eye drop Ripatec, anti-hypertensive drug Azusa are some of launches. MetXL, Softdrops etc. keep climbing new highs

  • US generic business has started contributing meaningfully

  • New oral solid manufacturing facility inaugurated at Pitampur

Market Trends:

  • Developing nation growing at 2-5%, pharmerging growing at 5-8% and rest of world growing at 2-5%

  • Global pharma invoice spending has been $1.2 trillion

Guidance:

  • Growth drivers are multiple first to market products, specialty segment in India, 10-12 ANDAs lined up annually in USA, leveraging brand power of key products and 22 ANDAs waiting for approval in USA

  • In last 6 years, company has invested almost Rs 1600 crore capex which comes to an end as of now. This included 3 greenfield manufacturing facility and expense in R&D center. The tail end of this capex cycle ends with ophthalmic section at Guwahati to be commissioned in Q2 FY21. This was completely funded with internal accruals. This capex will meet growth demand for next 5 years

  • Over last 5-6 years, net margin has gone down from 25% to 18% and some of this will be covered through operating leverage with better capacity utilization of new facilities.

  • Branded generics contributes 70% of overall revenue. This generated 17% growth and expected to grow in the range of low teens

Other Points:

  • 71% holding with promoter, retail down from 7.2% to 6.6% and 18% owned by institutions

  • Mirae asset is one of key shareholders and has increased its holding over the years

  • 20-30% of salary is through variable commission. Remuneration is within regulatory limit

  • Non managerial remuneration hike is 12% and managerial remuneration hike is 10% which is in line with performance

Risks and Open Questions:

  • 70% of revenue comes from export and hence there is a forex risk. Company has a hedging policy with hedging 50% of foreign currency exposure with plain vanilla forwards

  • Ajanta pharma Mauritius and Philippines is highly profitable but Ajanta Pharma USA has generated only Rs 13 crore PBT on Rs 599 crore of sales

  • Significant jump in receivables from Rs 460 crore to Rs 776 crore which more than 60% jump

  • Significant jump in cost of material consumed

  • What is Rs 74 crore of exchange different in other income, this may not be sustainable

  • In other expenses, selling expenses is up from Rs 240 crore to Rs 303 crore which is 25% jump, in line with revenue growth

16 Likes

As companies become bigger they start encroaching spaces they are not present in value chain, See how

Ajanta Pharma is – Pivoting its fortunes

Let me refresh your memory from this [2015 on how Ajanta pharma, Granules India and Suven Life Sciences were operating in different sections of the industry

Five years and things have turned on their head in 2020

  • Ajanta Pharma – Started selling in regulated markets
  • Granules – Set upfront retail shop in the US
  • Suven – Has moved into API manufacturing at scale

each of them had their own niche and slowly [build](complementary capabilities. Nothing depicts the pivot made by Ajanta pharma better than below chart

from no presence to getting 1/5th of their is sales from the USA is no mean feat. Typically when a company moves its sales from the unregulated market to the regulated market, you expect margins to improve. However, the net margin has dropped from 21% in 2015 to 18% in 2020. Winning US business takes time and effort along with it comes the cost of compliance operating in the regulated market.

The other big change which is not visible in the income statement is that the asset size of the company has grown by 250% in 5 years

When your asset base increases by 250% but your top line increases by only 78% percent a lot of return ratios get hit. This news has not been hidden from the market and the market cap of the company hasn’t breached their 2015 highs

Management firmly believes that they are turning the corner

When we started building business in the US, five years ago – we were fully aware of the challenges. The need for building US FDA approved facility was just the beginning. The dynamics of the business does not even allow quick ramp-up of production at a facility as product filings and approvals take their own time. This, naturally, put pressure on our return ratios as we continued to incur fixed cost. Though we were fully aware of it, we needed to do it as we knew it will eventually start paying – and this year saw the beginning of it

This brings us to the tail end of a major capex cycle , with only ophthalmic section at Guwahati remaining to be commissioned in Q2 FY 2021.

Annual Report 2020

Now let’s focus on some of the current year’s highlights

  • The Company outgrew Indian Pharmaceutical Market (IPM) recording 13% growth compared to 11% for the industry, maintaining its healthy track record for the last 5 years
  • Launched a total of 18 new products in India across 4 specialty therapies. Out of this, 7 were first-to-market
  • Anti-malaria institution business for Artimether-Lumefnatrine in Africa grew 25% in the year, the business being lumpy in nature as it depends on funding bodies. However, the company expects to protect its market share in the business
  • 7 new product launches and market share by our existing products in the US business

What’s in store for the future?

  • Going forward, as the manufacturing capacity utilization improves for the newly set up facilities, expect margins to further improve over a period of time
  • With major capex cycle coming to conclusion with all major greenfield projects getting completed, expect the free cash flows to improve in coming years

As the US business becomes more prominent for Ajanta we need to watch out for pricing pressure and have to see if margins and ROCE revert back to 2014 and 2015 levels

While Ajanta pharma may look expensive when viewed from an earnings point of view (July 2020 market Cap INR 12000 crore), however, we know that earnings are likely to improve as scale builds.

28 Likes

Covid Updates from the company:

Disc: Invested

3 Likes

Q1 RESULTS

SUPER COOL !!!

3 Likes

Pledge released on 5 lakhs shares, equivalent to 0.57% share capital of the company.

The promoters have been de-pledging the shares almost on a daily basis over the last 1 week. The reason cited is ‘reduction in margin call money’. Can someone please share insights as to how this works? Is it due to the run up in the share price lately as a result of which shares might have been released and still retain the required margin call?

1 Like

This is dated 2nd Oct…Looks a $100M opp size but it is a crowded space and there are many with existing lines

2 Likes

Good set of results from the company, operational income grew by 11%, EBITDA margins zoom to 38% leading a PBT increase of 46% YOY. Revenue split is shown below:

  • Domestic business de-grew by 1% (company was losing market share in their derma division, now they have lost a bit of market share in cardiology)
  • US business continues to ramp up very well with 39% YOY growth
  • Africa institutional business de-grew by 28% whereas the Africa branded business grew by 36% offsetting losses from the institutional business
  • Asia branded business de-grew by 1% YOY.

The very high EBITDA margins is because of lower R&D spend (4% of revenues) and improvement in gross margins (to 78%). Such high gross margins are surprising given that close to 30% of revenues now come from the US market (any suggestions?). Receivables were kept under control leading to healthy cashflow generation.

Company announced a dividend of 9.5/share and a buyback at 1850/share. Buyback quantum represents 0.84% of equity shares. Last year buyback was for 0.87% of equity at a price of 1300/share.

Disclosure: Invested (position size here)

5 Likes

I have a small investment in Ajanta pharma . Just wanted to know how to participate in “buy back “

Detailed process to be followed is available here

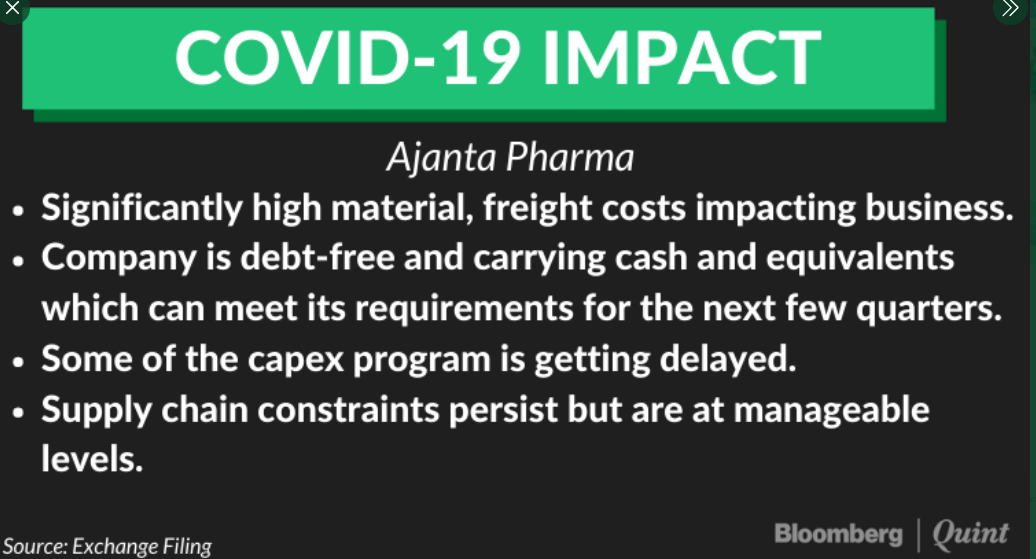
Ajanta Pharma Q2 highlights -

  1. Segment wise growth in India vs IPM -

Ajanta Pharma vs IPM -

Opthal - (-) 1 pc vs (-) 1 pc
Cardio - 10 pc vs 13 pc ( underperformance )
Derma - (-) 2 pc vs 4 pc ( underperformance )
Pain Management - 8 pc vs 1 pc ( outperformance )
Overall - 4 pc vs 5 pc ( underperformance )

Last 4 yr growth Ajanta vs IPM -

FY 17 - 16 pc vs 9 pc
FY 18 - 6 pc vs 6 pc
FY 19 - 16 pc vs 11 pc
FY 20 - 13 pc vs 11 pc
HY 21 - 4 pc vs 5 pc

  1. Q2 India sales - 202 cr- flat YoY

Cardio - 44 pc
Opthal - 29 pc
Derma - 20 pc
Pain Management - 7 pc

  1. Segment wise ranking of Ajanta Pharma -

Opthal - 2nd
Derma - 14th
Cardio - 16th
Pain management - 39 th
Overall - 31st

  1. Global Business -

US business - 33 products on shelf, 37 final approvals, 19 under approval, focus on sound execution for customer delight

US sales at 154 cr vs 111 cr
Africa branded sales - 112 cr vs 82 cr
Asia sales - 180 cr vs 181 cr
Africa institutional sales - 51 cr vs 72 cr

Overall exports - 499 cr vs 447 cr

  1. India + Export sales - 701 cr vs 650 cr

India sales - down 1 pc
Export sales - up 12 pc
Overall - up 8 pc

R&D expenses at 29 cr vs 40 cr YoY at 4 pc of sales

Last 5 yr R&D spending trend ( as pc of sales ) -

6 pc, 8 pc, 9 pc, 9 pc, 6 pc

  1. Manufacturing facilities -

Formulations -
3 facilities in Aurangabad
1 facility in Dahej
1 facility in Guwahati ( Opthal bloc - to commence production in Q4 )
1 facility in Pithampur ( newly comissioned )
1 facility in Mauritius

APIs -
1 facility in Walunj ( captive consumption )

  1. Financial highlights -

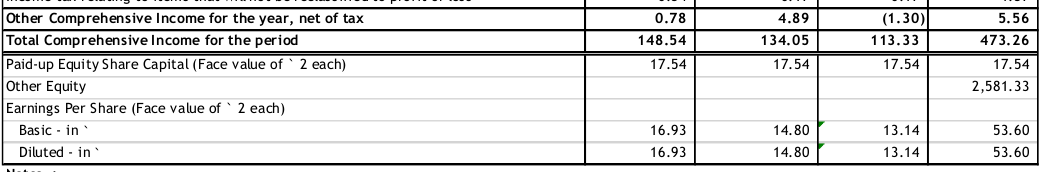
Total sales - 716 cr vs 643 cr, up 11 pc
EBITDA - 274 cr vs 178 pc, up 54 pc, margins at 38 vs 28 pc
PAT - 170 cr vs 116 cr, up 46 pc

EBITDA expansion due - lower cost of RW as a percentage of sales, lower other expenses as a percentage of sales, lower R&D costs

Disc : invested

1 Like

Not the latest news but didn’t see a mention of it on the thread -

Initiating coverage report by HDFC Securities

1 Like