Ajanta Pharma

Pledge released on 5 lakhs shares, equivalent to 0.57% share capital of the company.

The promoters have been de-pledging the shares almost on a daily basis over the last 1 week. The reason cited is ‘reduction in margin call money’. Can someone please share insights as to how this works? Is it due to the run up in the share price lately as a result of which shares might have been released and still retain the required margin call?

1 Like

This is dated 2nd Oct…Looks a $100M opp size but it is a crowded space and there are many with existing lines

2 Likes

Good set of results from the company, operational income grew by 11%, EBITDA margins zoom to 38% leading a PBT increase of 46% YOY. Revenue split is shown below:

  • Domestic business de-grew by 1% (company was losing market share in their derma division, now they have lost a bit of market share in cardiology)
  • US business continues to ramp up very well with 39% YOY growth
  • Africa institutional business de-grew by 28% whereas the Africa branded business grew by 36% offsetting losses from the institutional business
  • Asia branded business de-grew by 1% YOY.

The very high EBITDA margins is because of lower R&D spend (4% of revenues) and improvement in gross margins (to 78%). Such high gross margins are surprising given that close to 30% of revenues now come from the US market (any suggestions?). Receivables were kept under control leading to healthy cashflow generation.

Company announced a dividend of 9.5/share and a buyback at 1850/share. Buyback quantum represents 0.84% of equity shares. Last year buyback was for 0.87% of equity at a price of 1300/share.

Disclosure: Invested (position size here)

5 Likes

I have a small investment in Ajanta pharma . Just wanted to know how to participate in “buy back “

Detailed process to be followed is available here

Ajanta Pharma Q2 highlights -

  1. Segment wise growth in India vs IPM -

Ajanta Pharma vs IPM -

Opthal - (-) 1 pc vs (-) 1 pc
Cardio - 10 pc vs 13 pc ( underperformance )
Derma - (-) 2 pc vs 4 pc ( underperformance )
Pain Management - 8 pc vs 1 pc ( outperformance )
Overall - 4 pc vs 5 pc ( underperformance )

Last 4 yr growth Ajanta vs IPM -

FY 17 - 16 pc vs 9 pc
FY 18 - 6 pc vs 6 pc
FY 19 - 16 pc vs 11 pc
FY 20 - 13 pc vs 11 pc
HY 21 - 4 pc vs 5 pc

  1. Q2 India sales - 202 cr- flat YoY

Cardio - 44 pc
Opthal - 29 pc
Derma - 20 pc
Pain Management - 7 pc

  1. Segment wise ranking of Ajanta Pharma -

Opthal - 2nd
Derma - 14th
Cardio - 16th
Pain management - 39 th
Overall - 31st

  1. Global Business -

US business - 33 products on shelf, 37 final approvals, 19 under approval, focus on sound execution for customer delight

US sales at 154 cr vs 111 cr
Africa branded sales - 112 cr vs 82 cr
Asia sales - 180 cr vs 181 cr
Africa institutional sales - 51 cr vs 72 cr

Overall exports - 499 cr vs 447 cr

  1. India + Export sales - 701 cr vs 650 cr

India sales - down 1 pc
Export sales - up 12 pc
Overall - up 8 pc

R&D expenses at 29 cr vs 40 cr YoY at 4 pc of sales

Last 5 yr R&D spending trend ( as pc of sales ) -

6 pc, 8 pc, 9 pc, 9 pc, 6 pc

  1. Manufacturing facilities -

Formulations -
3 facilities in Aurangabad
1 facility in Dahej
1 facility in Guwahati ( Opthal bloc - to commence production in Q4 )
1 facility in Pithampur ( newly comissioned )
1 facility in Mauritius

APIs -
1 facility in Walunj ( captive consumption )

  1. Financial highlights -

Total sales - 716 cr vs 643 cr, up 11 pc
EBITDA - 274 cr vs 178 pc, up 54 pc, margins at 38 vs 28 pc
PAT - 170 cr vs 116 cr, up 46 pc

EBITDA expansion due - lower cost of RW as a percentage of sales, lower other expenses as a percentage of sales, lower R&D costs

Disc : invested

1 Like

Not the latest news but didn’t see a mention of it on the thread -

Initiating coverage report by HDFC Securities

1 Like

Another good set of results from Ajanta with revenue growth of 15%, EBITDA growth of 32% and PAT growth of 64%. Gross margins are still quite high at 77%. Growth has been broad based, with India growing at 13%, emerging branded business (including Africa) at 19%, Africa institution at 58% and 1% growth in US. R&D spends are still quite low (~5% of sales).

Within India business, cardio segment is still growing at a slightly lower pace than industry average (13% vs industry growth of 14%). Derma seems to be coming back (4% vs 3% for industry) and pain management growth is really good (14% vs -1% for industry). Overall good set of results, lets see how US business does going forward and if the Africa institution recovery is a 1-quarter phenomenon.

Disclosure: Invested (position size here)

4 Likes

Any thoughts on the inventory days and receivable days which is keep on increasing QoQ?

Ajanta got FDA approval for generic equivalent of brand glumetza (metformin hydrochloride; extended release tablets). US sales for these was ~$192 mn for 12-months ending November 2020 (link). One theme evolving out of Ajanta’s US portfolio is their focus on slightly complicated delivery methods (like extended release, delayed release, etc.) in oral solids.

https://www.accessdata.fda.gov/scripts/cder/daf/index.cfm?event=overview.process&ApplNo=213962

Disclosure: Invested (position size here)

4 Likes

Ajanta announces a concall after a very long time.

5 Likes

Stable set of numbers from Ajanta.

Here are my notes from the concall

  • US:
    o API sourcing: Outsourced and do not plan on backward integration. Have strong partnerships and will stay focused on this approach
    o Growth: For the next couple of years, comfortable with product pipeline in oral solids to achieve desired growth; Filed only 2 ANDAs in FY21 because of the hard lockdown in the beginning of F21. Currently R&D is not operating at full capacity, but will try to maintain 10-12 ANDA filing in FY22. ANDA approvals are largely in-line with filings, and they have been fairly consistent with both filings and launches in US barring FY21. US strategy is focused on being very calibrated with the filings so that the end products actually get launched
    o Pricing: Has been much better post buyer consolidation compared to scenario few years back. Competition will always be there and now it depends on the strategy adopted by individual company; Will not like to give any future guidance on growth
    o R&D can go up to 6% of sales
  • Domestic business
    o Reason for superior growth: Introduced very good products in FY20 which yielded results in FY21 (such as new brand launches in rheumatoid arthritis). Had 21 new brand launches in domestic market (5 first time launches) in FY21
    o Dermatology: Have four teams in dermatology which held a lot of webinars and group meetings to bring the division back to growth. Expect productivity improvement going forward
    o Cardiology: 5-6 lakhs productivity per month by 2 teams and the rest 2 teams are catching up
    o Ophthalmology: at optimum MR productivity compared to #1 and #3 player; Not a large market, so productivity will be lower compared to other divisions
    o With commissioning of Guwahati facility, a large of outsourcing is discontinued. Margins will be similar to current levels and will get better control on product + income tax benefit
    o Takes 4-6 years for building a domestic brand to achieve peak sales
    o Invested 25 cr. in ABCD Corp. (bring in more efficiency in domestic pharma chain)
  • Working capital: Higher inventory in FY21 (98 days vs 71 in FY2) was due a mix of API and formulation; Lower receivable days of 95 in FY21 vs 111 in FY20 should persist going forward
  • CAPEX: FY21 capex ~ 150cr. (30cr. on corporate office), FY22 capex will be ~ 200-250cr. (largely maintenance (should be 150-200cr.) + expansion of corporate office which will be 60-80cr.). Fixed asset turns for FY21 ~ 1.75x (on net fixed asset) and should improve going forward. Current gross block ~ 1765cr.
  • Africa institutional business: going forward wish to make similar level of sales (outlook is very hard to give)
  • Improved gross margins of 78% is due to better product mix and wearing off the impact of FY20 product recall; Should be in the range of 75 ± 2% gross margins going forward
  • 176cr. sales in Asia and 97cr. sales in Africa Institution business in Q4FY21
  • Seeing disruption in Asia and Africa business but this should stabilize soon, do not see any long term disruption
  • 34% EBITDA margins should go down in the future because of exceptionally low costs in H1FY21

Disclosure: Invested (position size here)

11 Likes

Thanks Harsh for your Notes. Useful

If I heard correctly, the answer was that margins will obviously reduce (because of very low levels of outsourcing) as cost of bringing in-house will be higher but to an extent these will be offset by Income tax benefits that they get for the Guwahati facility

http://www.ajantapharma.com/AdminData/Results/EarningsCallAudioQ4(Jan-Mar)2020-21.mp3
Transcript will also be made available at company website, in due course.*

2 Likes

The broader context was they were doing margins of 80%+ due to outsourcing which will come down to 75 ± 2% kind of levels which is broadly similar to what they did in FY21. So margins will come down from historical numbers of 80%+ but will remain broadly similar to what they are currently doing (i.e. in mid 70s).

The concall is already available on youtube.

1 Like

Ajanta came out with their FY21 annual report, here are my observations.

http://www.ajantapharma.com/AdminData/AnnualReports/AjantaPharma_AR2020-21.pdf

Product launches:

  • 10 new products in branded generics business (Africa, Rest of Asia excluding India)
  • Launched 21 new branded generics product in India out of which 5 were first to market spread across the four key therapies. Have a basket of 300 products
  • 9 launches in USA and 12 approvals (including tentative). 36 products on-shelf
  • Developed 23 APIs

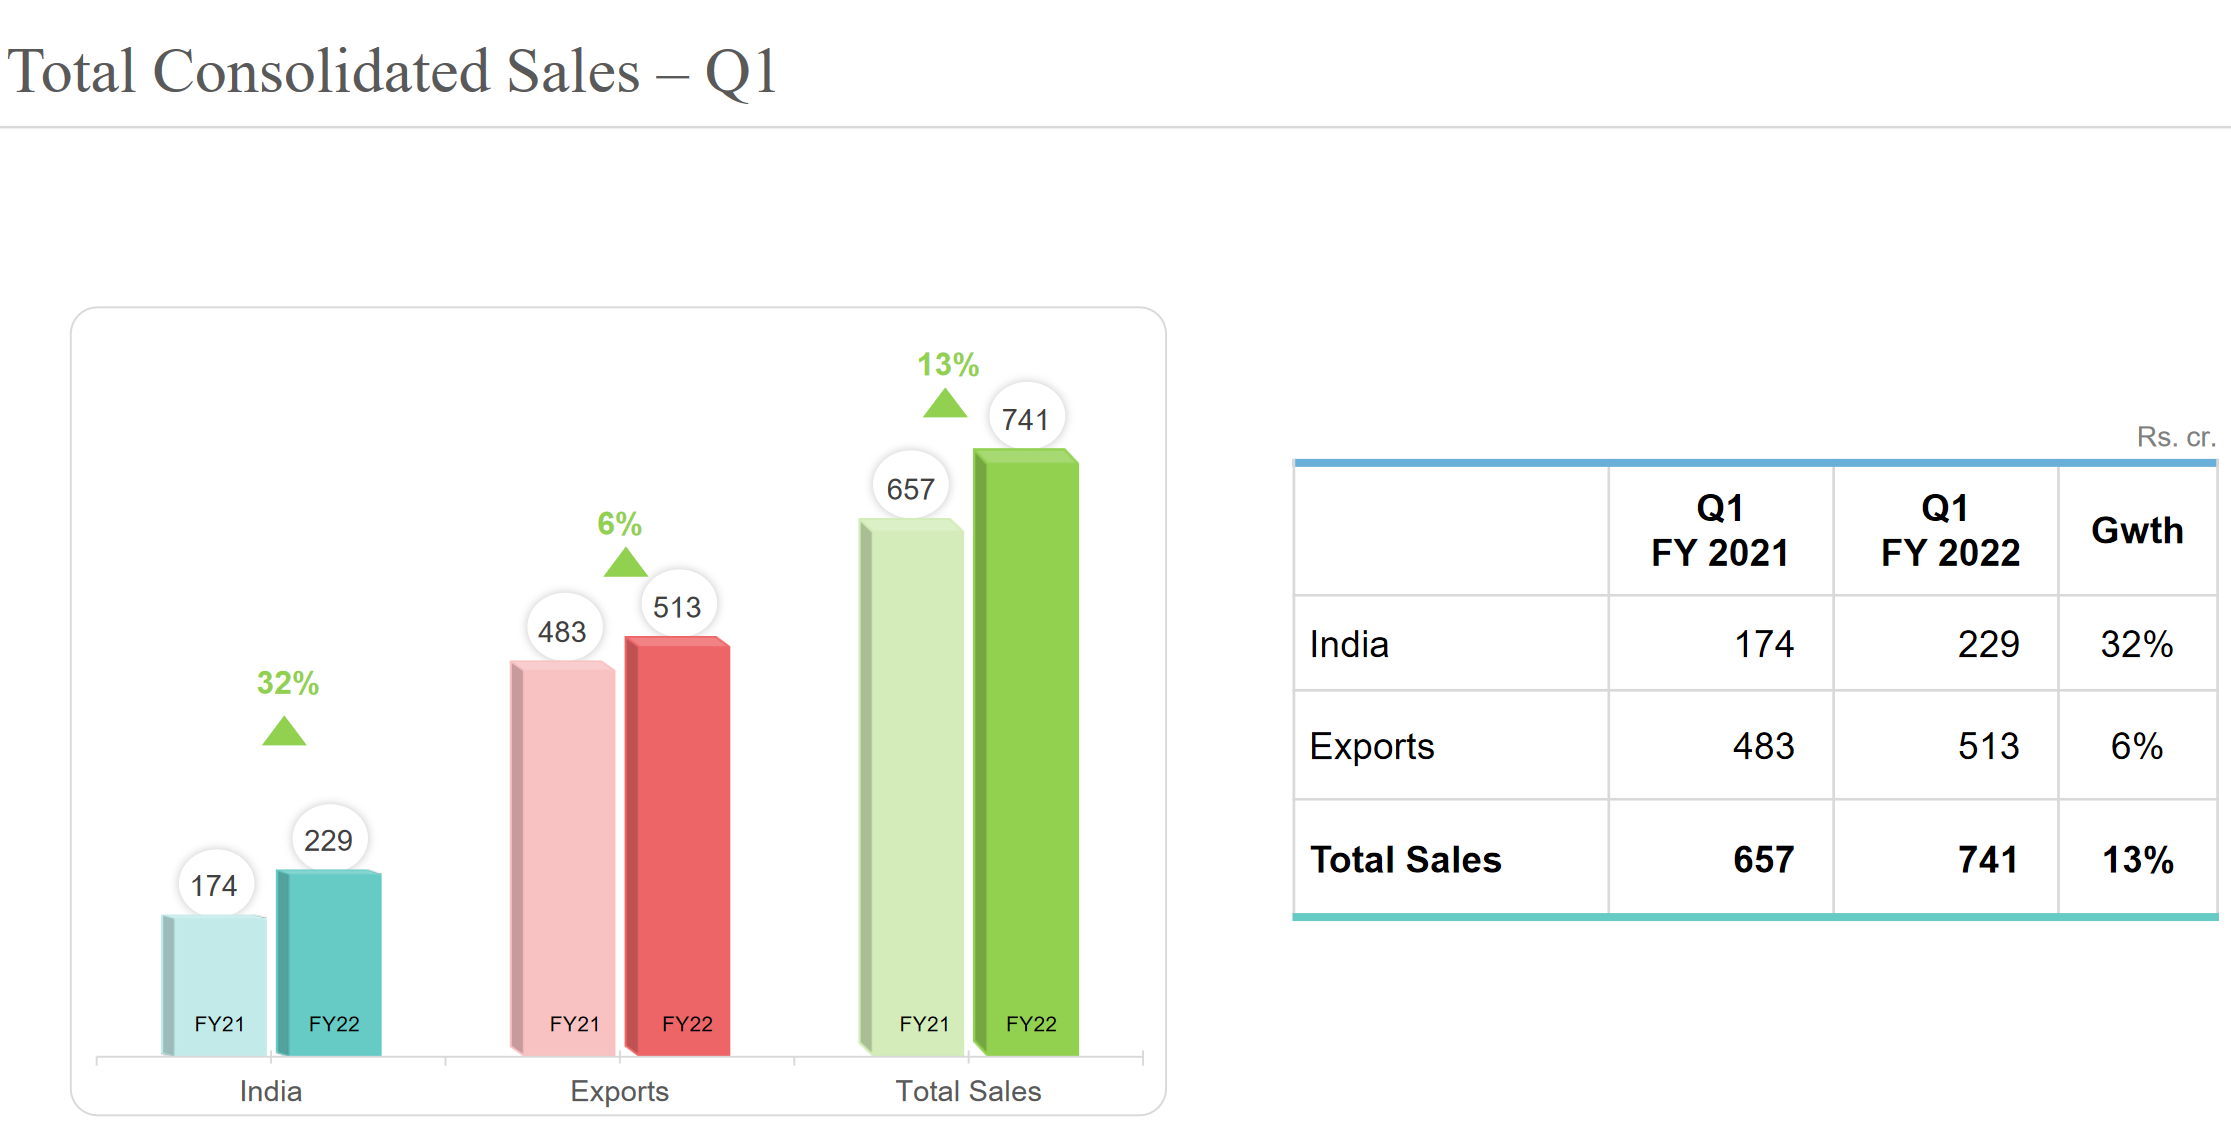
Branded Generics (68% of revenues; grew @8% to 1’937 cr.):
• Indian branded generics (813 cr.) grew at 6% (IQVIA reported Ajanta growth of 8% vs 4% for IPM). IPM rank improved to 28 from 30 in FY20
• India ophthalmology: Growth of 1% vs industry de-growth of 1% (IPM rank maintained at 2)
• India cardiology: Growth of 14% vs industry growth of 13% (IPM rank at 18 vs FY20 rank of 17)
• India dermatology: Growth of 8% vs industry growth of 6% (IPM rank at 15 vs FY20 rank of 14)
• India pain management: Growth of 18% vs industry de-growth of 1% (IPM rank at 33 vs FY20 rank of 39)
• Emerging market branded generics (1’124 cr.) grew at 9% with launch of 19 new products. Growth was lower than expected due to impact of pandemic in few countries.

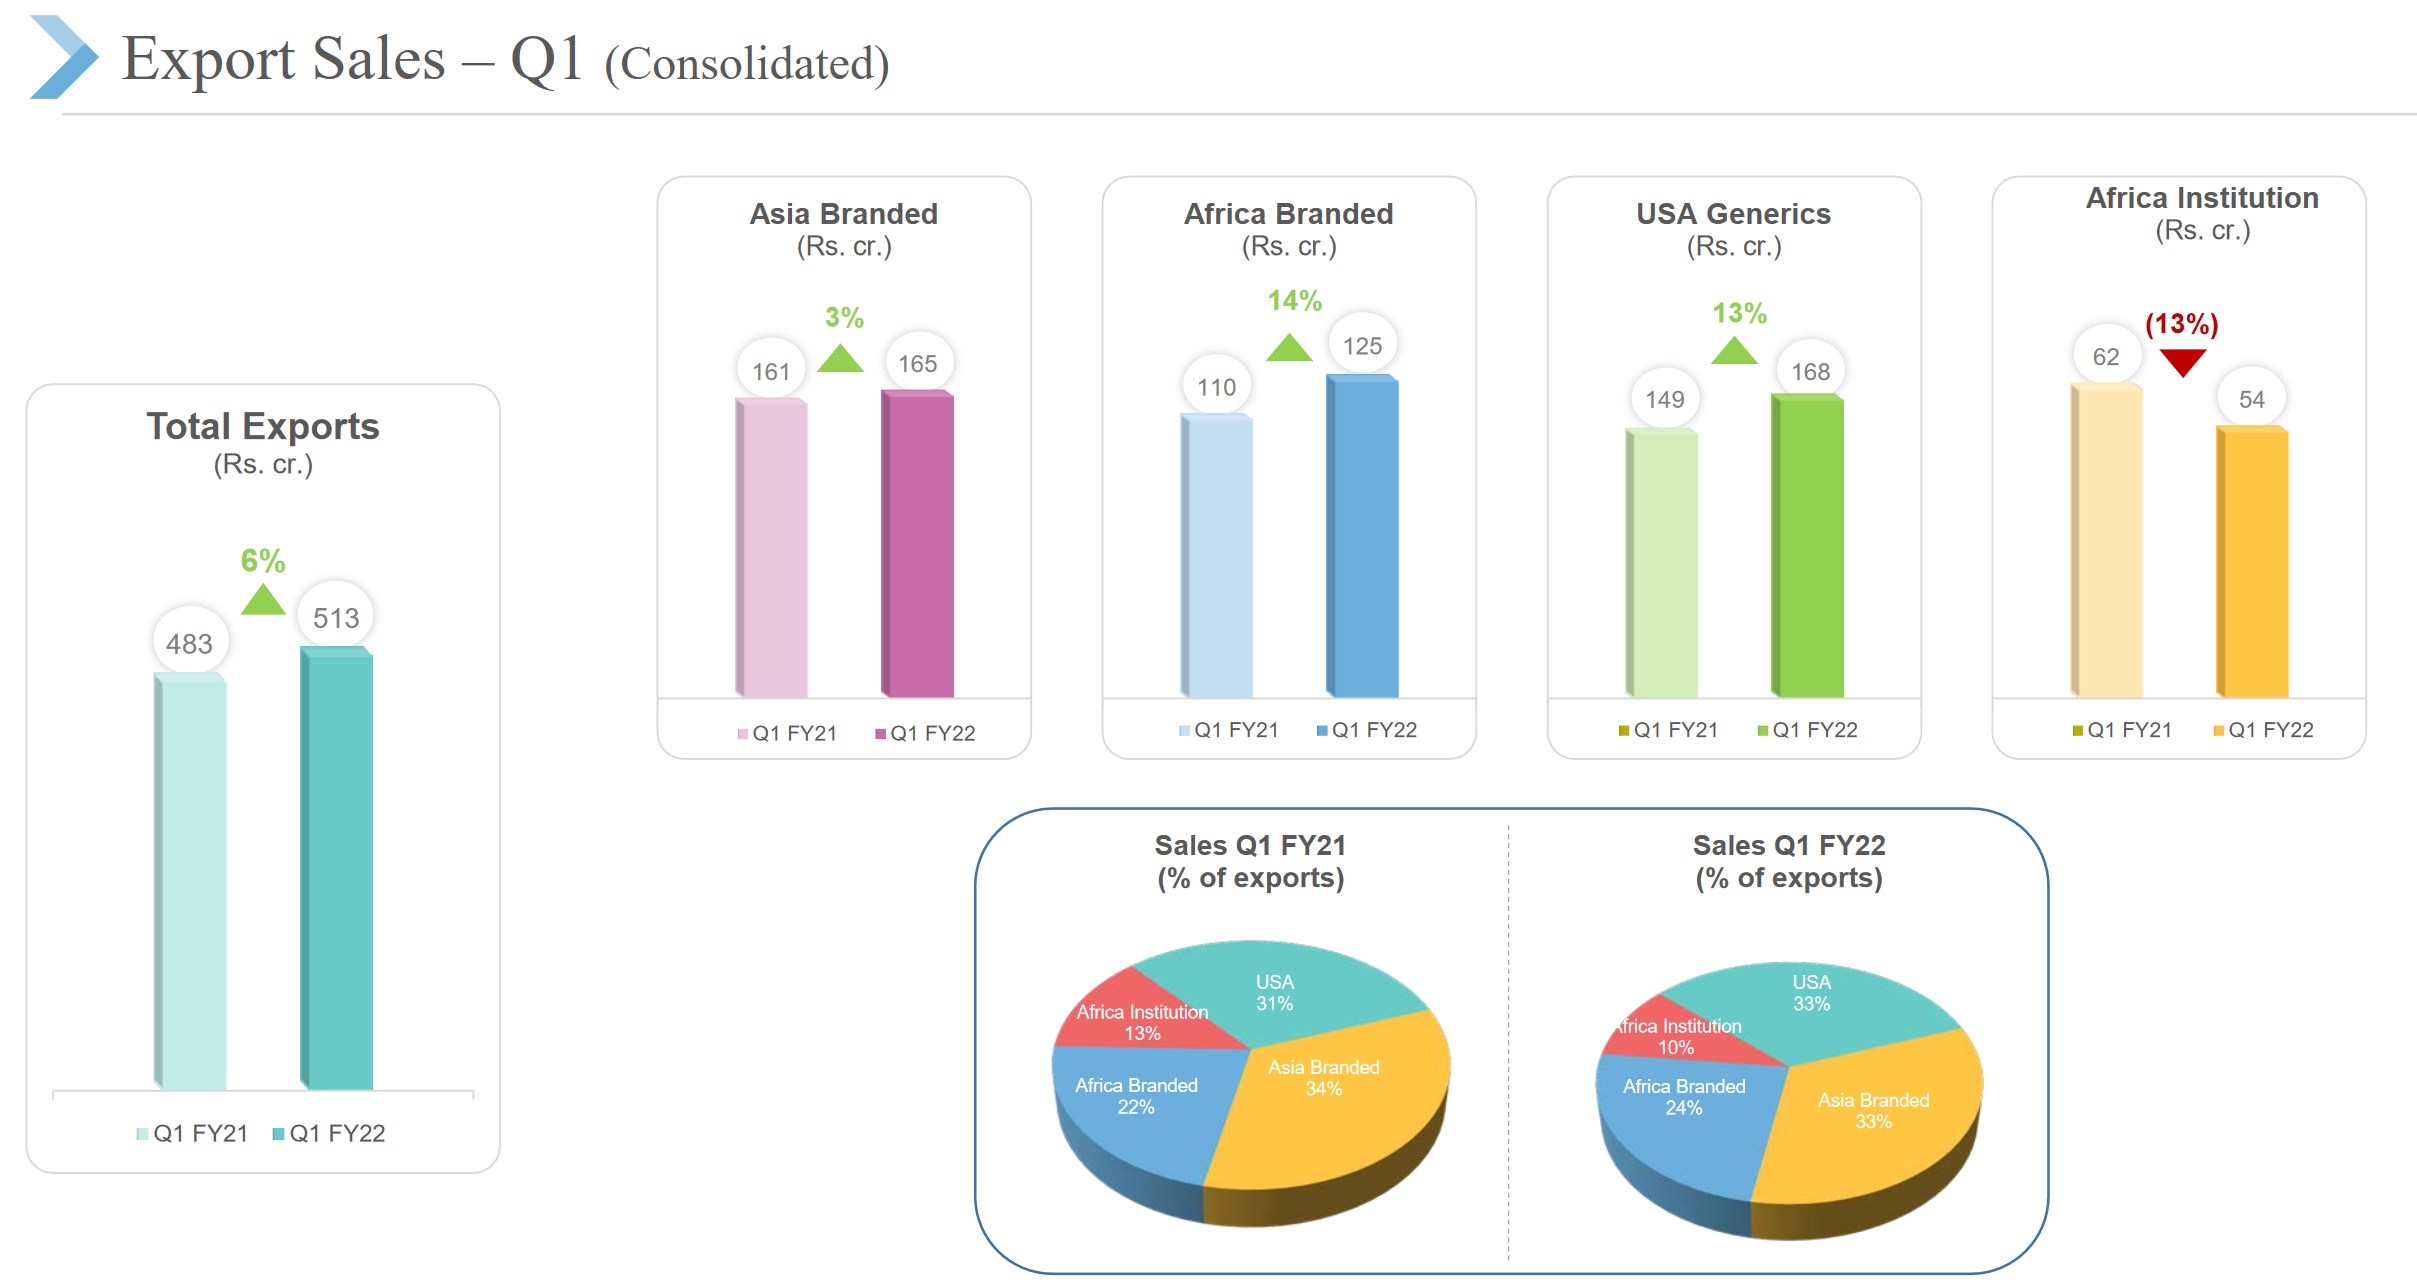
Generics and Institutional (32% of revenues; grew @19% to 908 cr.):

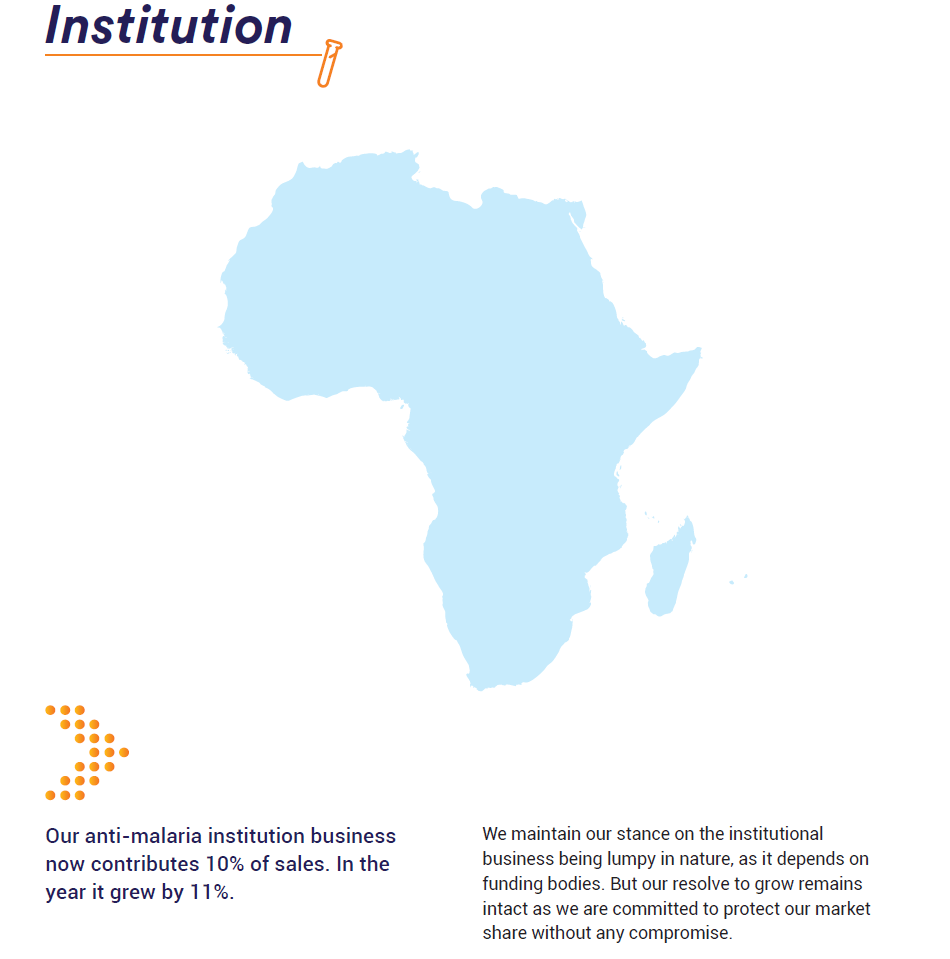
  • Africa anti-malaria institutional business (271 cr., 10% of revenues) grew at 11%; Have retained market share
  • US generics business (637 cr., 22% of revenues) grew at 24%. Could only file 2 ANDAs vs target of 10-12 ANDAs. Expect continued growth momentum in US on the back of new product launches and market share gain in existing products

R&D
• Developed Extended-Release/Delayed-Release oral solid dosage form products using Matrix technology
• Developed products based on solid dispersion technology similar to innovator products
• Total R&D expenses was 5% of revenue (139 cr. vs 164 cr. in FY20) most of which was expensed; R&D activities suffered due to lockdown leading to delays in completion of projects as a result of which Ajanta missed their product filing target across global markets (only 2 ANDAs filed vs target of 10-12 in USA); Next year target is to file 10-12 ANDAs in USA

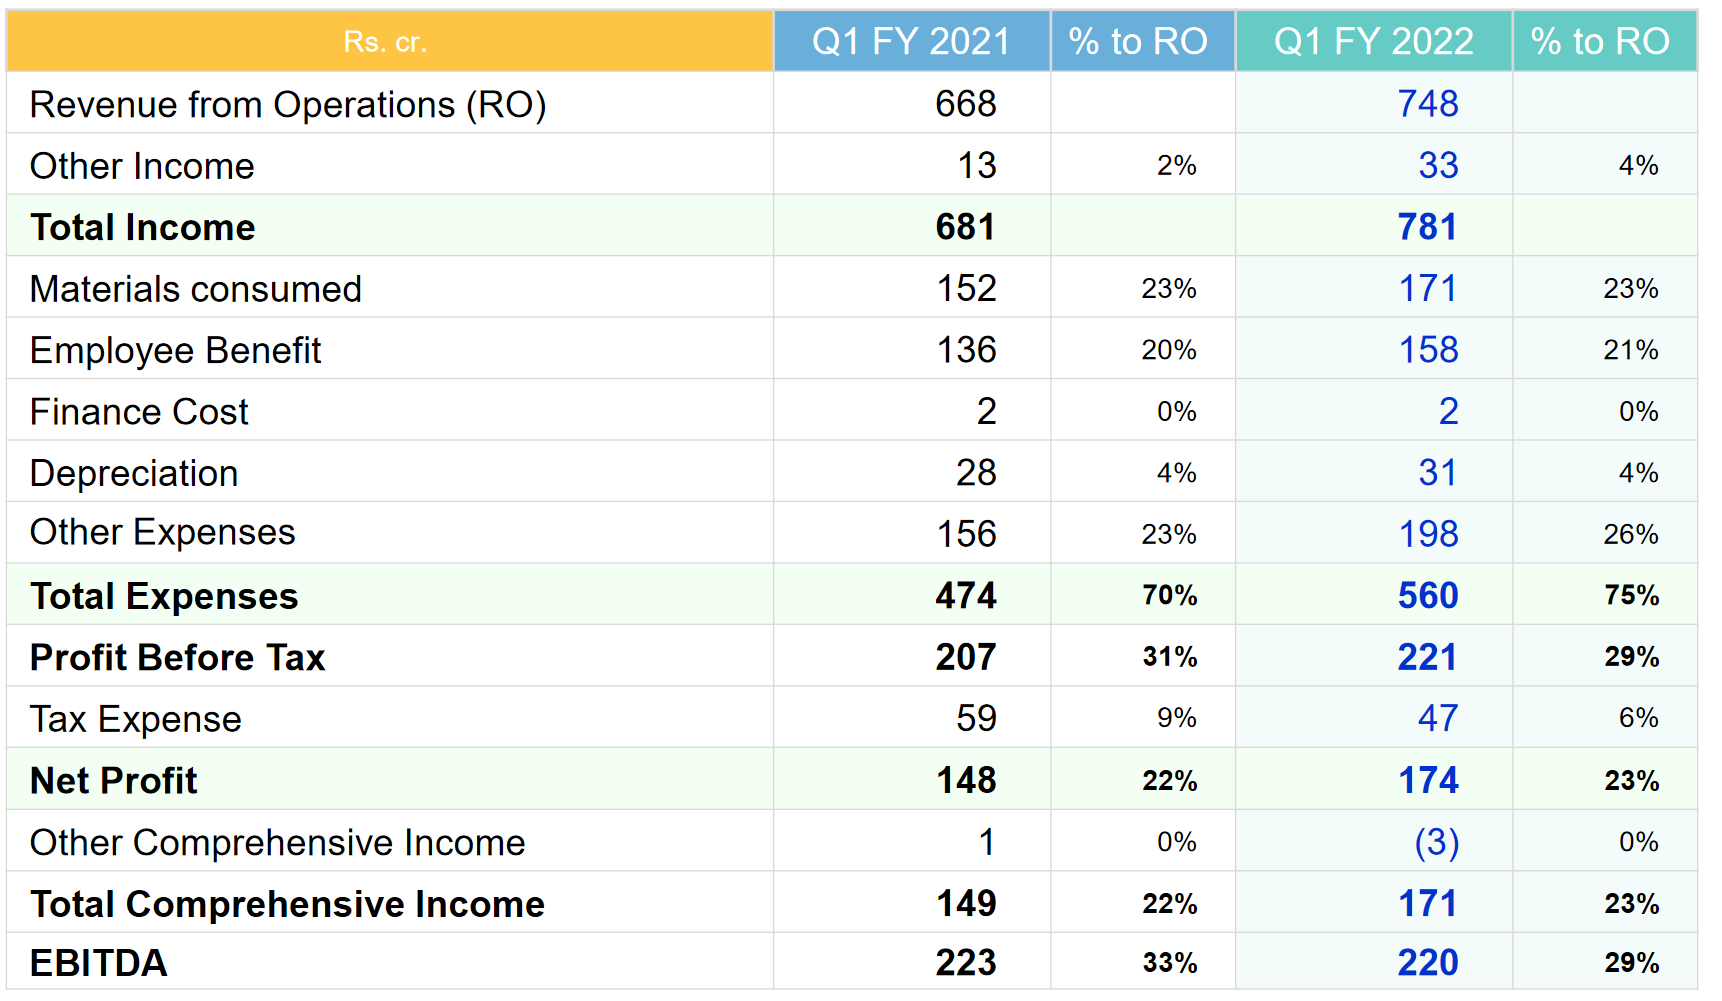
Financial Performance:
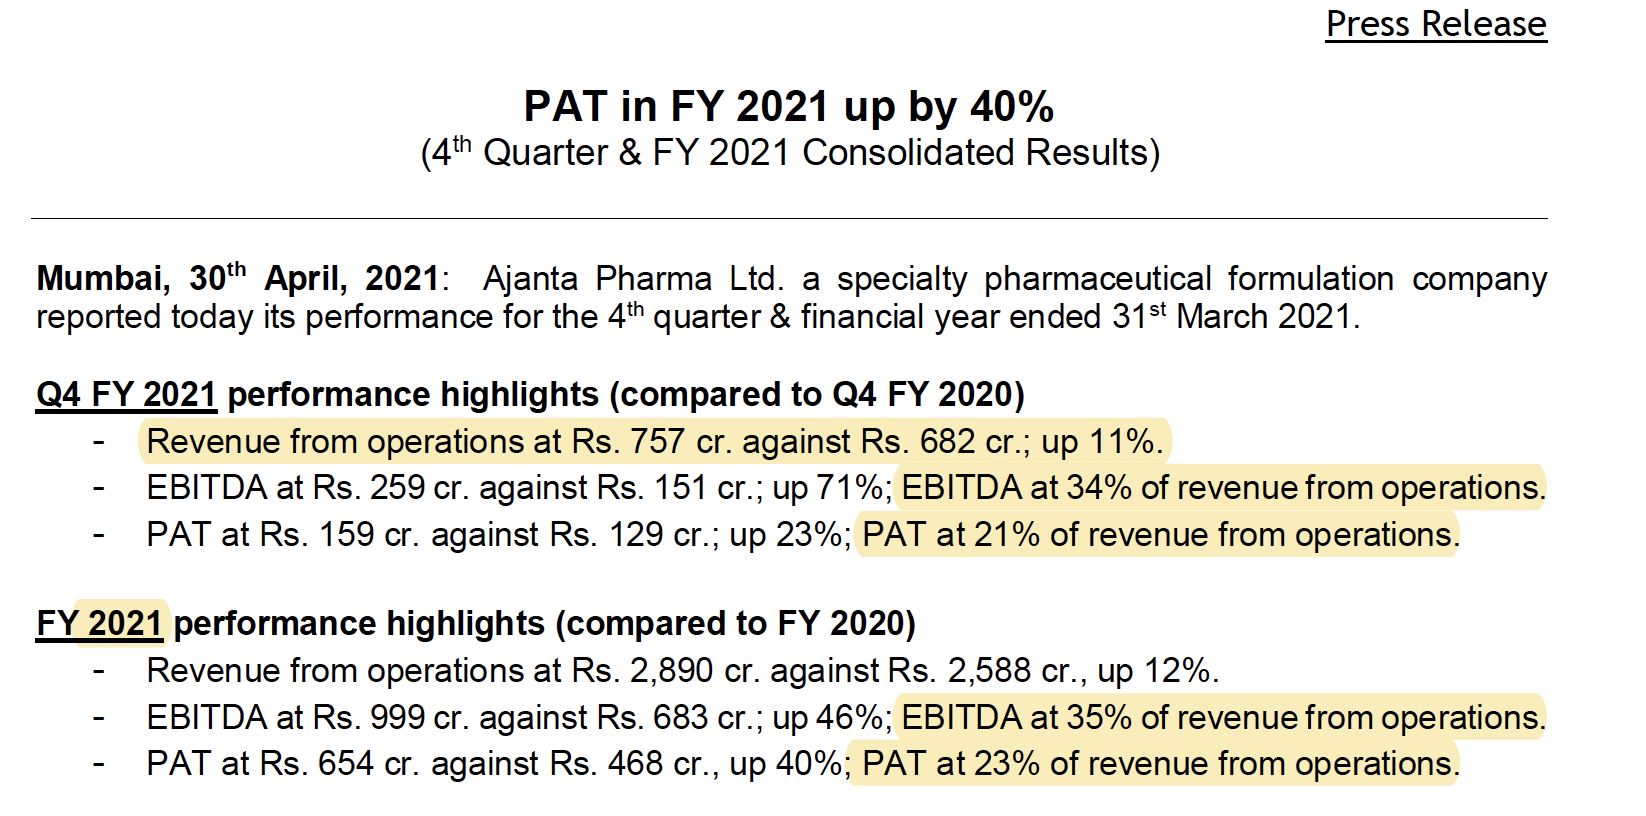
• Consolidated revenue grew by 12% to 2’890 cr.
• EBITDA margin was at 35% (vs 26% in FY20) on account of savings in marketing, R&D and other costs due to lockdown in H1FY21 which are one-time in nature. These expenses normalized in H2FY21.
• PAT grew by 40% to 654 cr.
• Cash ~ 375 cr., Paid back 250 cr. (buyback + dividend) and generated operating free cashflow of 284 cr.
• ROCE was up from 26% in FY20 to 30% in FY21
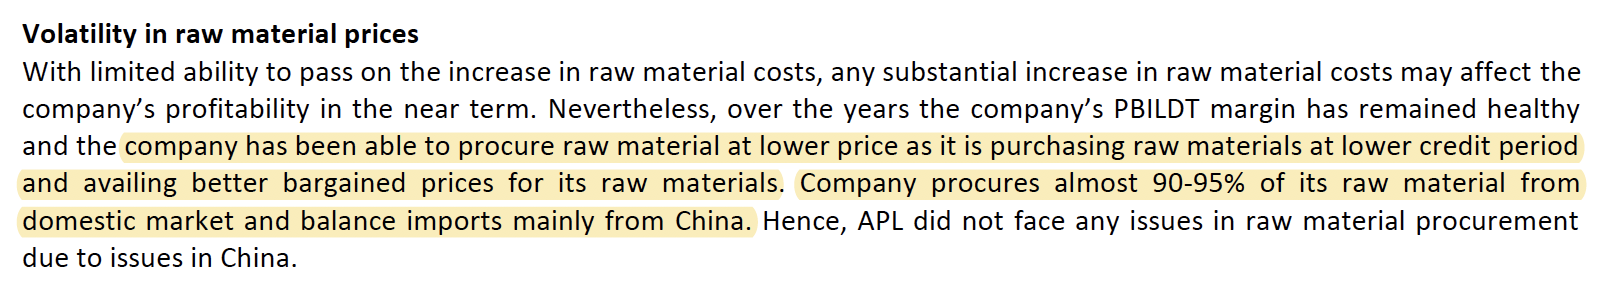
• Material cost went down from 25% to 22% due to rupee depreciation + positive product mix
• Employee cost remained at 19% of sales and other expenses came down from 29% of sales to 24%

Strategy:

  • Be a niche player in global pharma space and enhance value for all stakeholders
  • Customized market specific product portfolio
  • Focus on 1st to market products
  • Leverage brand power of key products
  • US: launch of limited competition products and have an impeccable service record thus becoming a preferred partner for customers
  • Inventory levels were strategically increased to 98 days vs 71 days in FY20 to hedge against any supply chain disruptions due to pandemic conditions. The absolute amount stood at 766 cr. in FY21 against 496 cr. in FY20
  • Management monitors the return (EBIT) on capital, as well as the level of dividends to equity shareholders. Group’s target is to achieve a return on capital above 30% in 2020-21 the return was 30% and in 2019-20 the return was 26%.

Share issuances:

  • ESOP: During the year, 5’500 shares were issued against the options exercised and 3’000 new options were granted under the SBIP 2019 to employees of overseas subsidiary
  • Bought back 735’000 shares at 1’850 price

Miscellaneous:
• Commissioned first production line for sterile ophthalmic products at Guwahati facility
• Spent 145 cr. on CAPEX
• Receivable days improved to 95 days vs 111 days in FY20
• Auditor remuneration at 0.99 cr. (vs 0.83 cr. in FY20)
• Hedging policy: ~70% of company’s income via exports with major currency exposure being in USD, the company generally does currency hedging up to a maximum period of 6 to 12 months and up to the extent of 50% to 75% of its net foreign exchange earnings.
• No major contingent liability other than financial guarantee of 73.11 cr.
• Employee count: 7’035 (vs 7’167 in FY20) (median salary increase: 8.8%)
• Non managerial remuneration hike was 8.8% and managerial remuneration hike was 20% (in-line with performance)
• CSR: Spent 12.78 cr. vs obligation of 10.49 cr. (no unspent amount)
• Share price high: 1884.55, low: 1235.2
• Number of shareholders: 45’826 (vs 40’090 in FY20)
• The Company had entered into a Joint Venture (‘JV’) with JV Turkmenderman Ajanta Pharma Limited (TDAPL) where it had management control during the first 10 years of this contractual arrangement. However, in terms of the JV agreement, the Company subsequently surrendered the management control in favor of the local partner and since then ceased to have any control on the operations of the JV. Further, TDAPL operates under severe restrictions that significantly impairs its ability to transfer the funds. Consequently, the Company had impaired its entire investment in TDAPL and considers this as an unrelated party. The Company is also unable to obtain reliable and accurate financial information in respect of the said JV
• Planning to add renewable energy sources for captive consumption
• During the year, Company’s step-down subsidiary, Ajanta Pharma Mauritius (International) Limited has applied for de-registration as part of reorganizing the business operations in Mauritius due to rationalization of tax structure
• The Company has also implemented an Internal Financial Control (IFC) framework to ensure proper internal controls over financial reporting. These controls ensure that transactions are authorized, recorded and reported on time. They ensure that assets are safeguarded and protected against loss or unauthorized disposal. It is also designed for effectiveness and efficiency of operations, compliance or regulations backed by strong audit framework at all the locations.

Global trends:
• As per Global Medicines & Usage Trends to 2025 report by IQVIA in April 2021, the total cumulative spending on Covid-19 vaccine through 2025 is projected to be USD 157 billion, largely focused on the initial wave of vaccinations to be completed by 2022
• In 2016-2020 period, growth was 3.8%, 7.4% and 3.9% for developed, pharmerging and ROW markets. 2020 invoice was $960bn, $291bn and $15bn for developed, pharmerging and ROW markets (total spends: $1.265 trillion)
• Global pharma invoice spending is expected to reach $1.6 trillion (3-6% CAGR growth) by 2025 with developed markets projected to grow at 1.5-4.5%, pharmerging market at 7-10%, and ROW at 3-6%.
• Among pharmerging markets, China, Brazil, India, Russian Federation and other markets had 2020 sales of $134bn, $29bn, $21bn, $18bn and $89bn, with growth (FY16-20) of 4.9%, 10.7%, 9.5%, 10.8% and 9.6% respectively.

Disclosure: Invested

12 Likes

Came across this thread:

JST Investments on Twitter: “Ajanta Pharma FY21 Annual Report Takeaways. ‘A niche player in the Global Pharma space’ Hit the ‘retweet’ & help us educate more investors. A Thread :thread::point_down:” / Twitter

1 Like

Q1FY22 result out. Consol revenue up 12%, Domestic business grew 32% yoy and exports grew 6%. Asia branded sales and Africa institutional business dragged exports
EBITDA margins came in at 29% vs 33%

4 Likes

http://www.ajantapharma.com/AdminData/AnalystSpeak/SystematixJuly2021.pdf

Very detailed report. Source: Company website

2 Likes