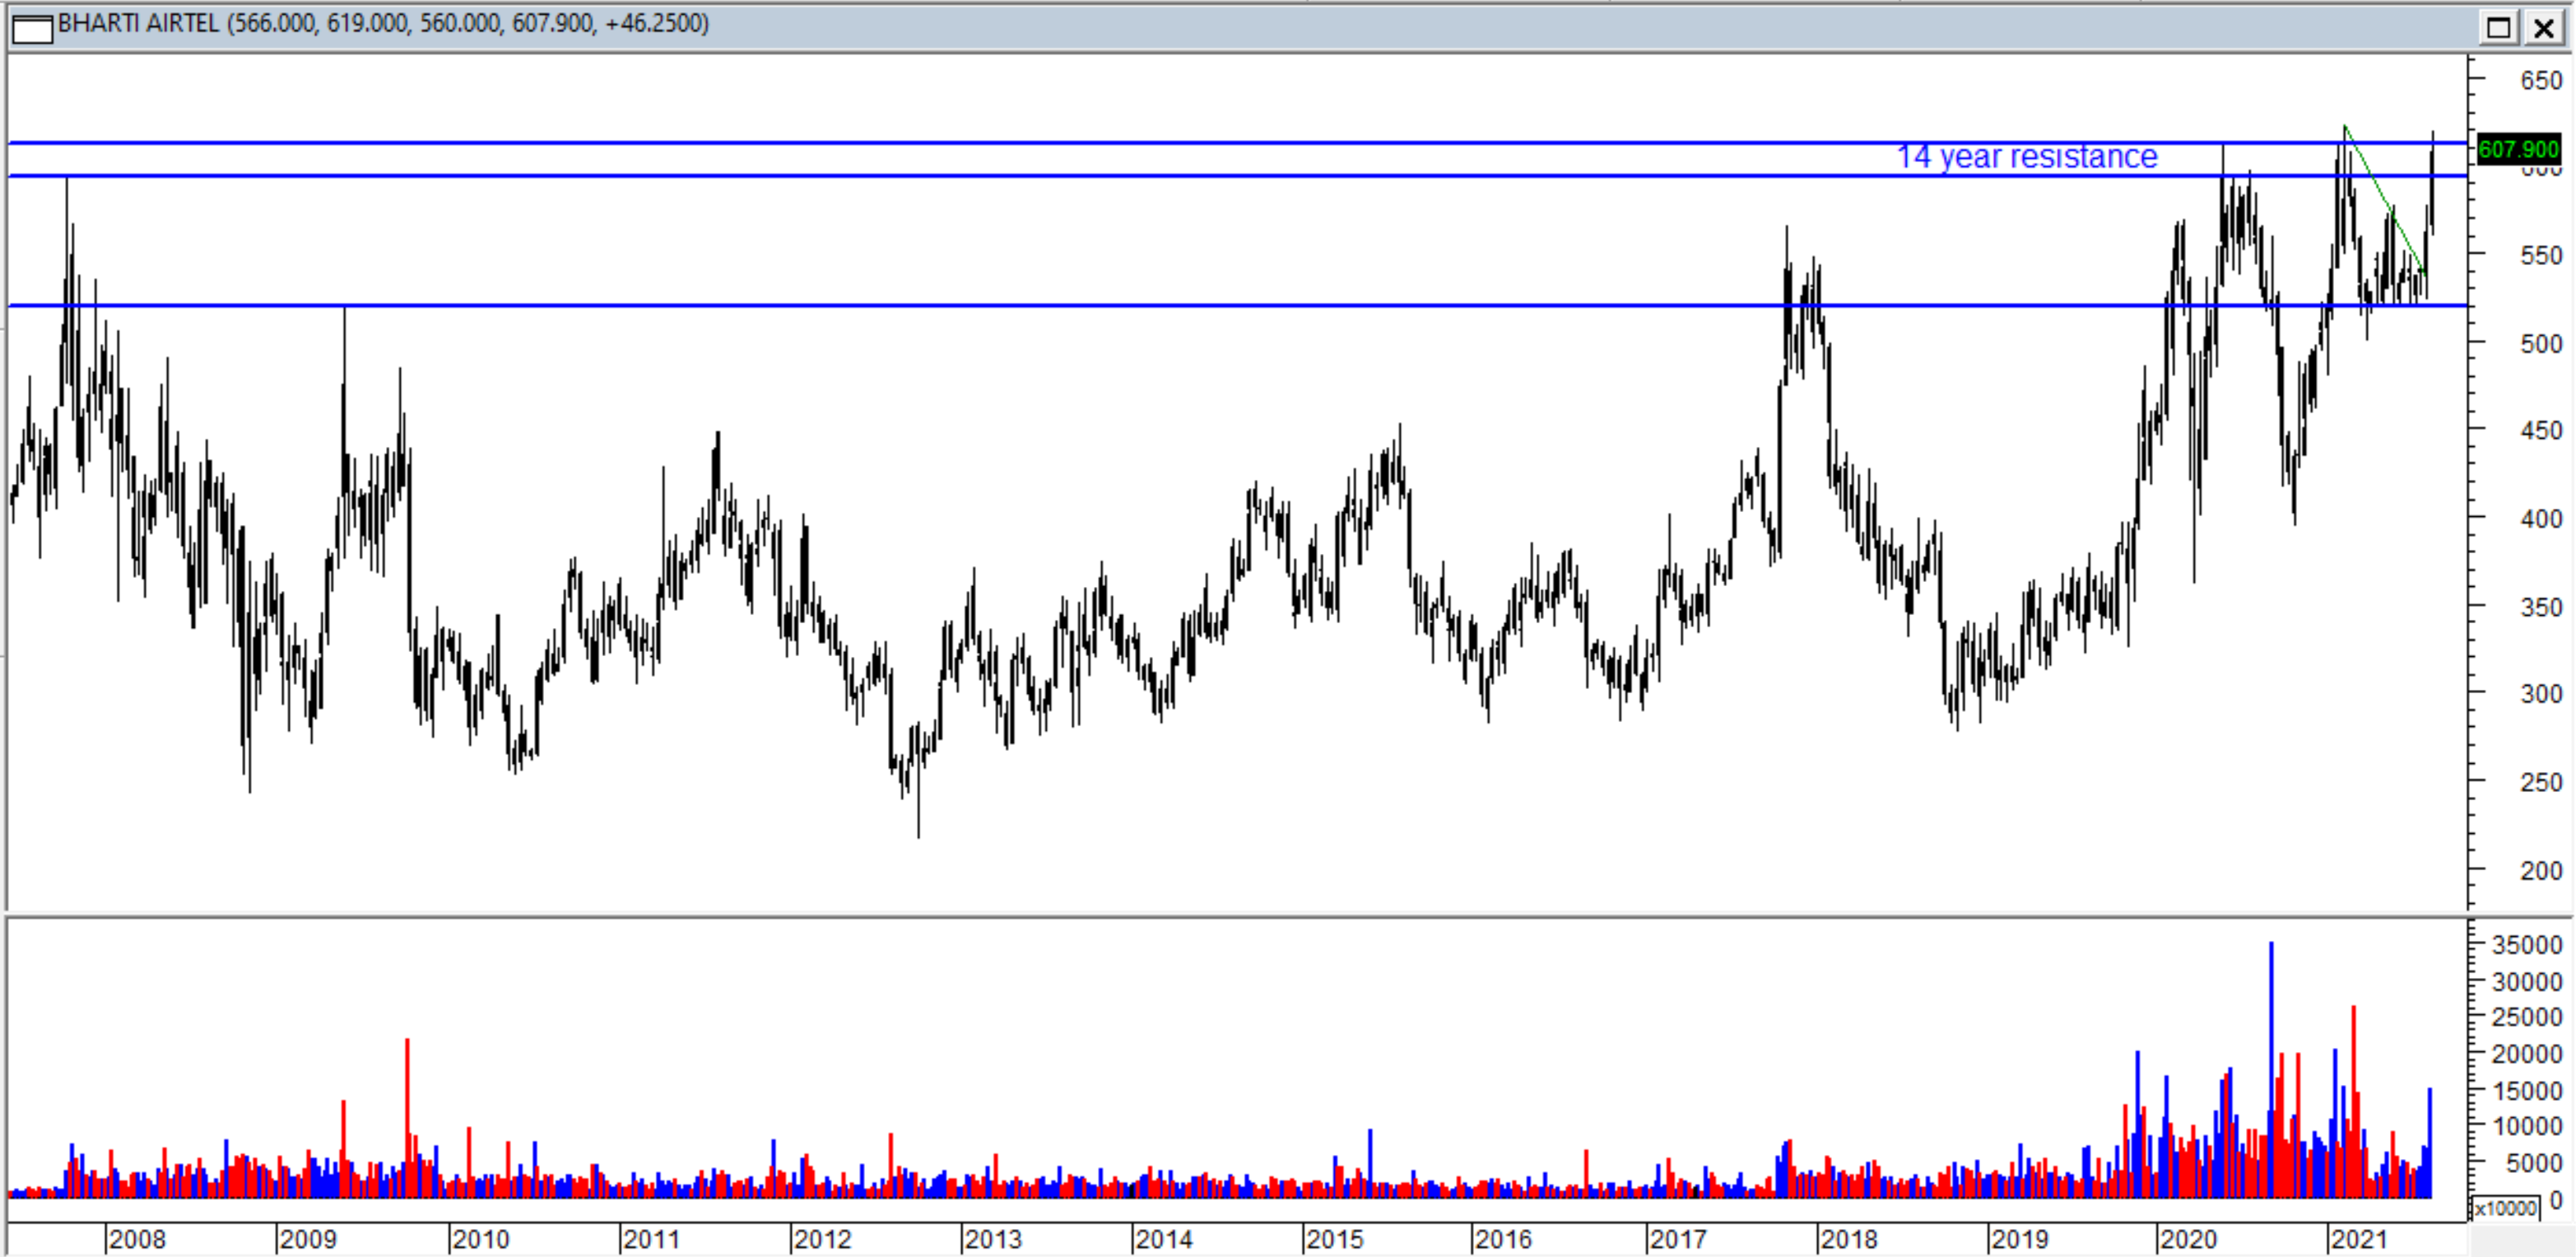
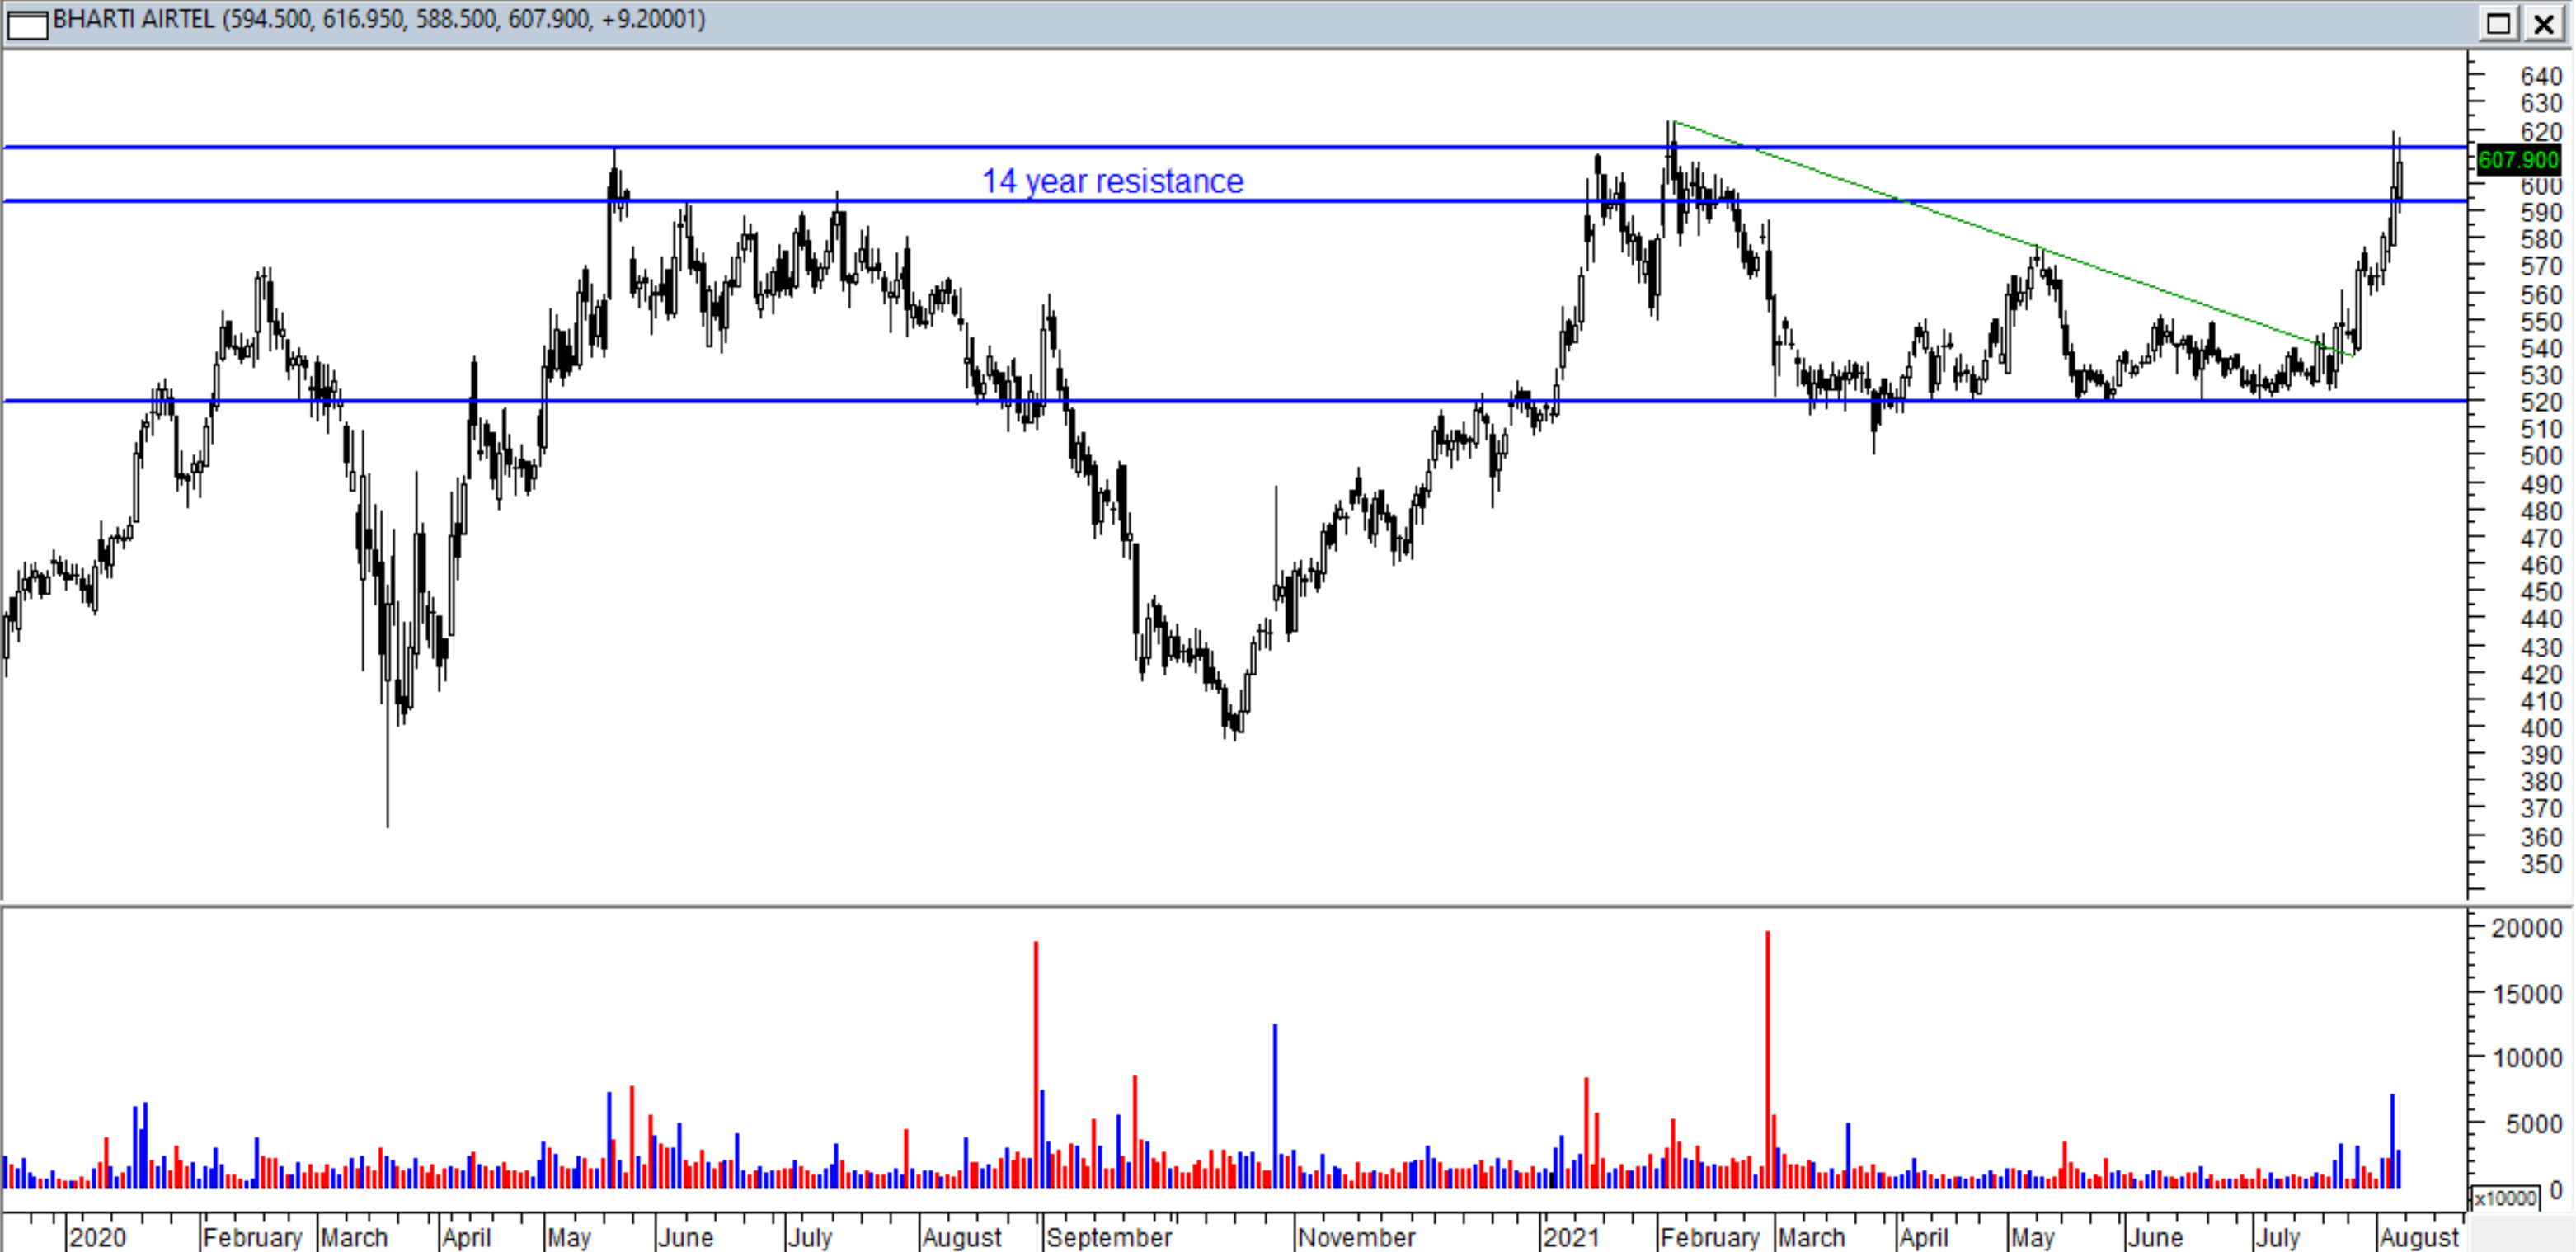
Daily chart showed an extremely strong base around 520. The breakout post price hikes and then the Vodafone Idea news has moved it near highs. Lets see whether it can cross this zone quickly or spend some time here before a big move.
On GICHF can you pls confirm C&H Pattern from 1908/2019 till 28/06/2021 with base formation at around 52-53. I am learning Technical analysis hence request your confirmation. Secondly is the C&H is confirmed and if the Break out happens around 190 levels would the target be around 310 levels ( Depth of cup = 180-50=130) added to the current price of around 180. Look forward for your guidance
Please scroll back a few posts, GIC HF charts posted and patterns described. If you start a thread especially on technicals and you want to learn technicals, try to read it from the beginning and read what is the key message at the beginning of the post when it started. Then look at all the examples posted by various boarders and see if patterns have played out as described and which kind of patterns have highest success rate and which ones have the lowest success rate. And try to figure out the reason why it happens so. Will be a great learning experience.
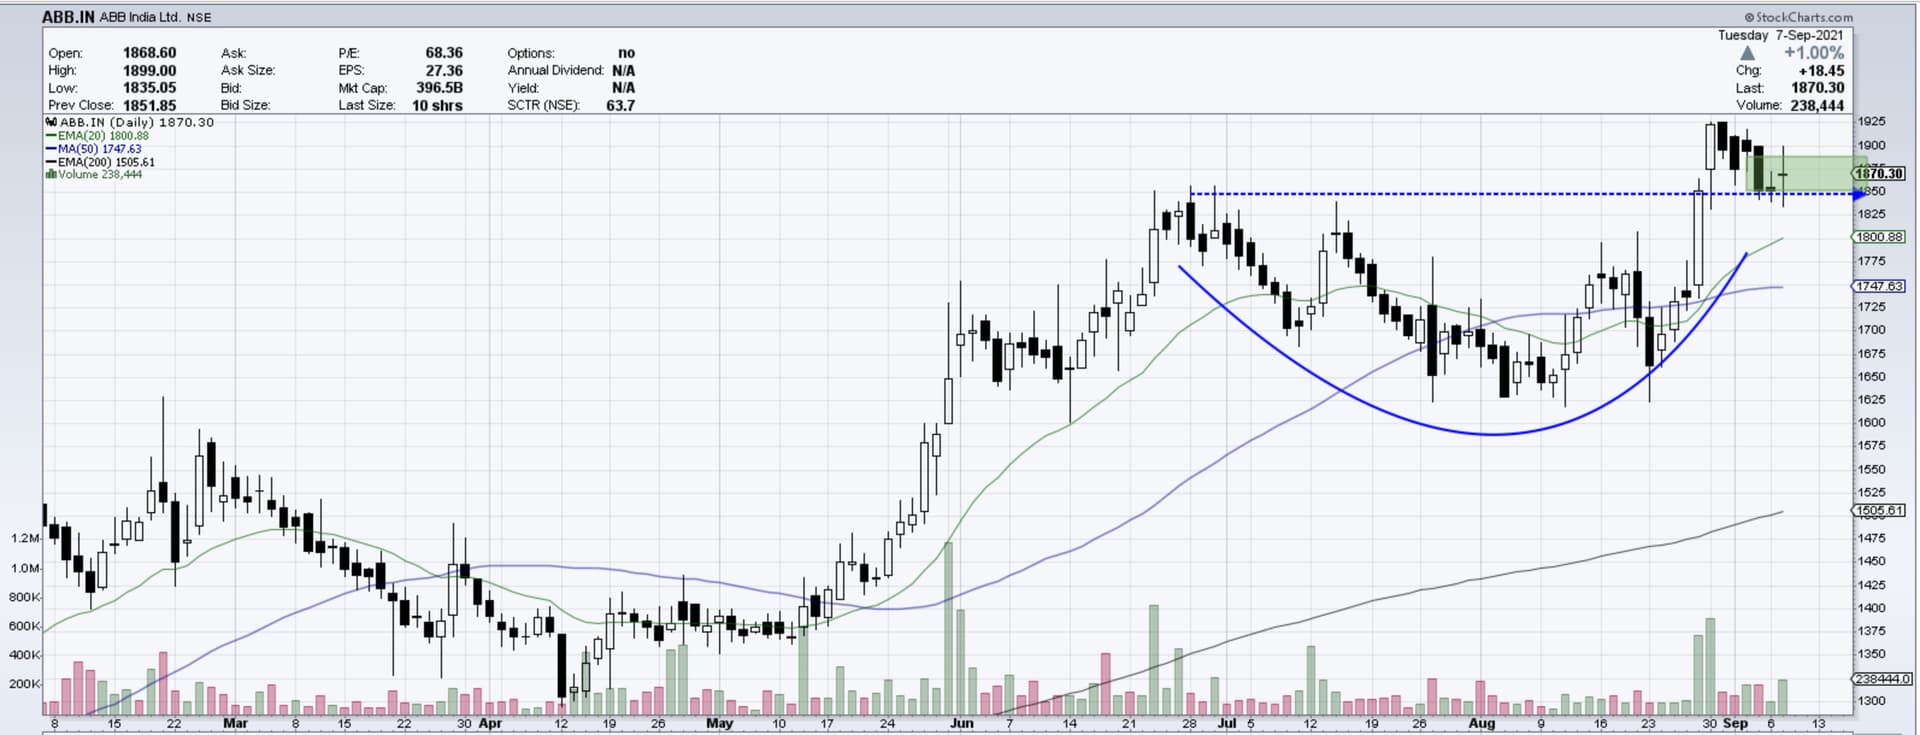
Pl see the attached latest weekly chart after the 2 days spike. The 2 support lines are drawn based on weekly levels on a daily chart. First position is initiated after seeing support at 1753 with sl of 1753 and second after seeing support at 1941 . Buying your investment for LT -this is a buy in dip strategy on a stock which is good on fundamentals. Exit when you feel overvalued. Investing is an ART and belongs to the Individual and not to me.
Hi Hitesh bhai,
I had a specific query regarding the techno funda approach when technicals are in place but fundamentals change.
Case in Point - GIC Housing Finance - In the Q1 results, wherein we saw a steep rise in NPAs (probably one reason why market is punishing the stock).
In such a scenario, how do we take a call about the pattern playing out in near term ?
One factor that always affects stock price is earnings. One always has to keep that in mind. So while playing technical patterns when results are expected in near future, one has to be very careful and be on the toes and follow strict stop losses. There is no shame in getting stopped out. It helps to preserve capital to live another day.
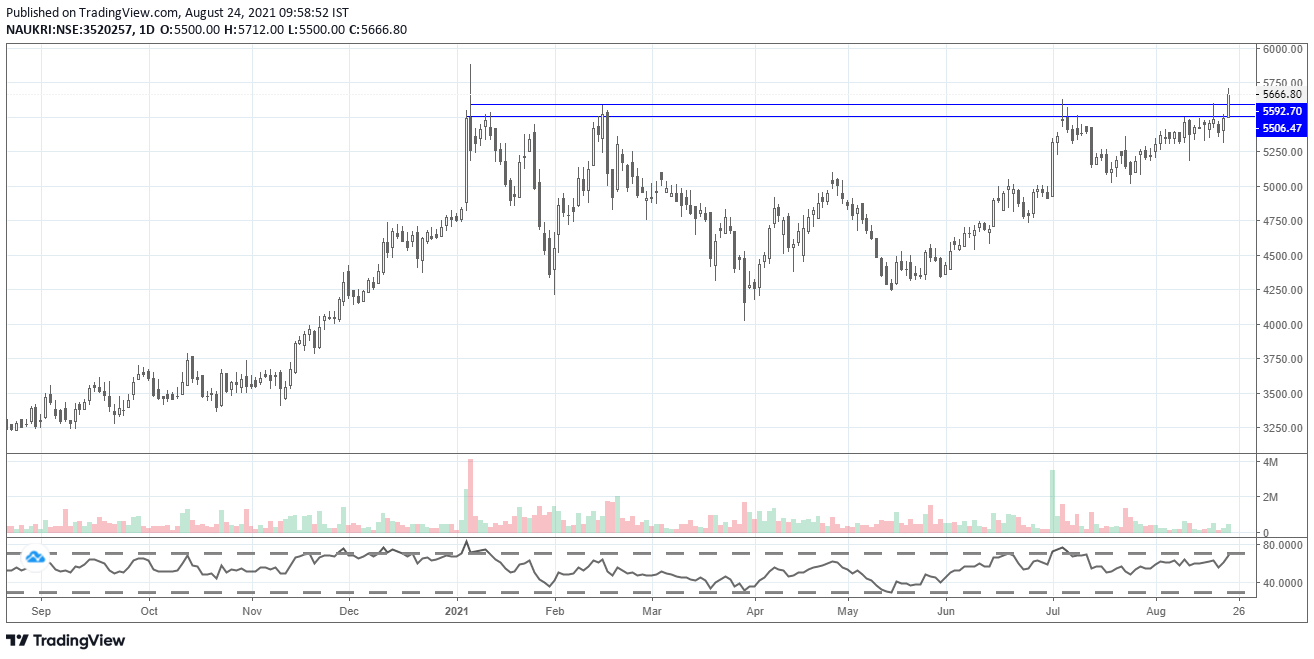
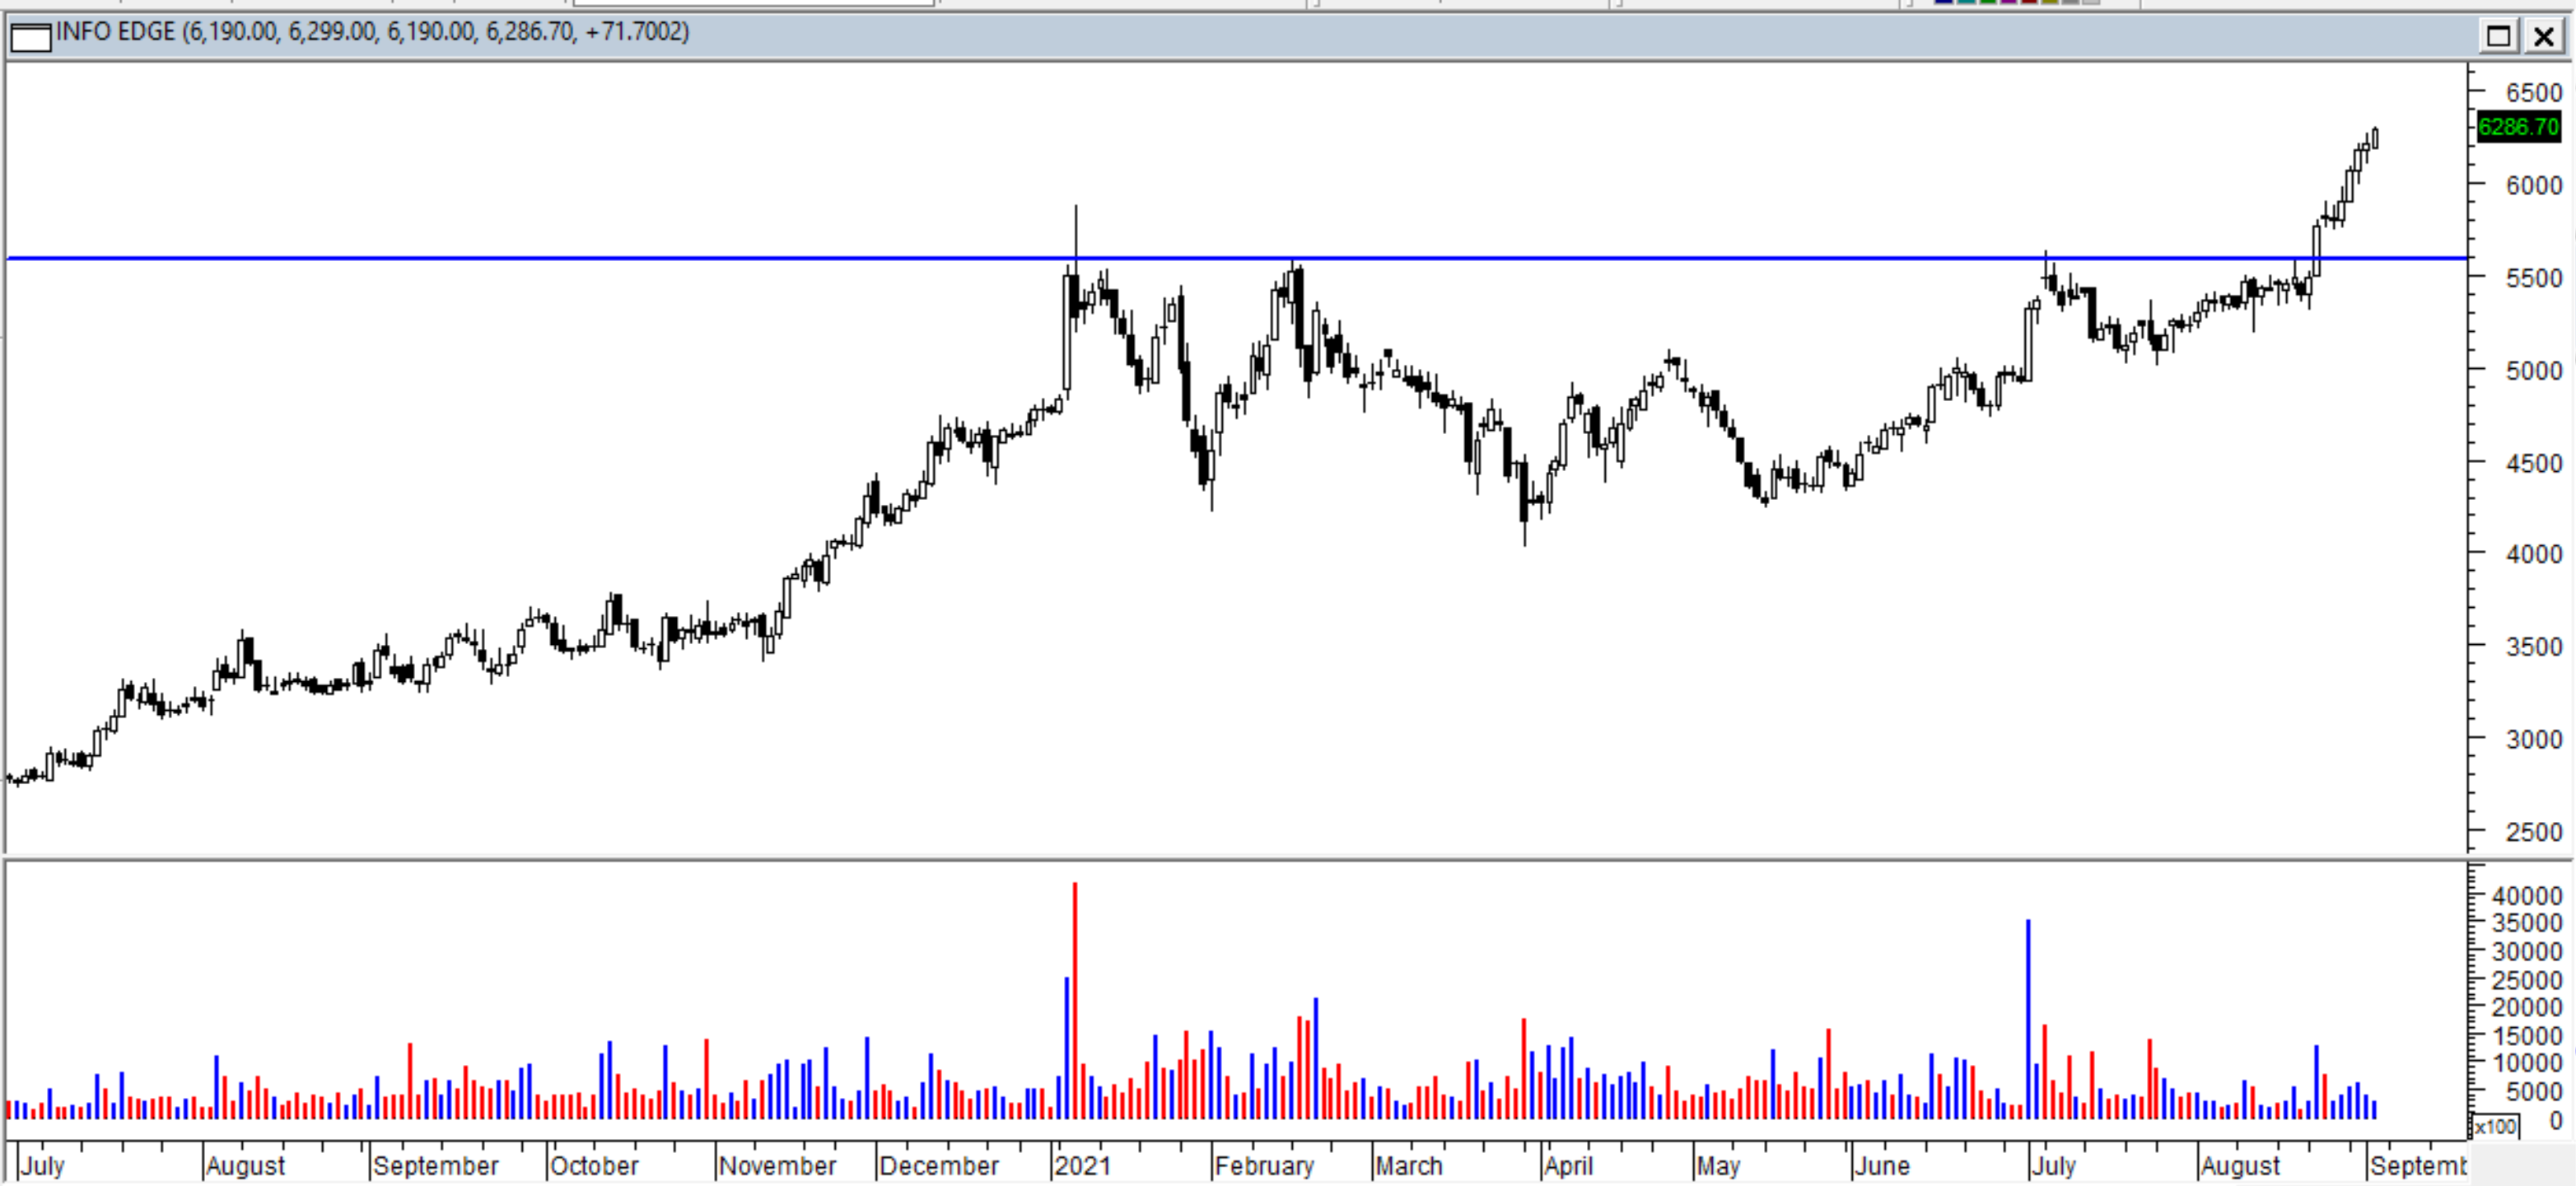
Infoedge/Naukri has been consolidating after a big previous upmove. It has formed a VCP pattern or inverted H&S pattern. Today it seems to be breaking out with volumes already much higher than Monday. 52 week high is closer to 5900 but that was a level seen for a short time only.
Sentimental positives of recent Zomato listing and upcoming Policybazaar IPO.
Also, attrition in IT sector is at all time highs, which should be positive for Naukri
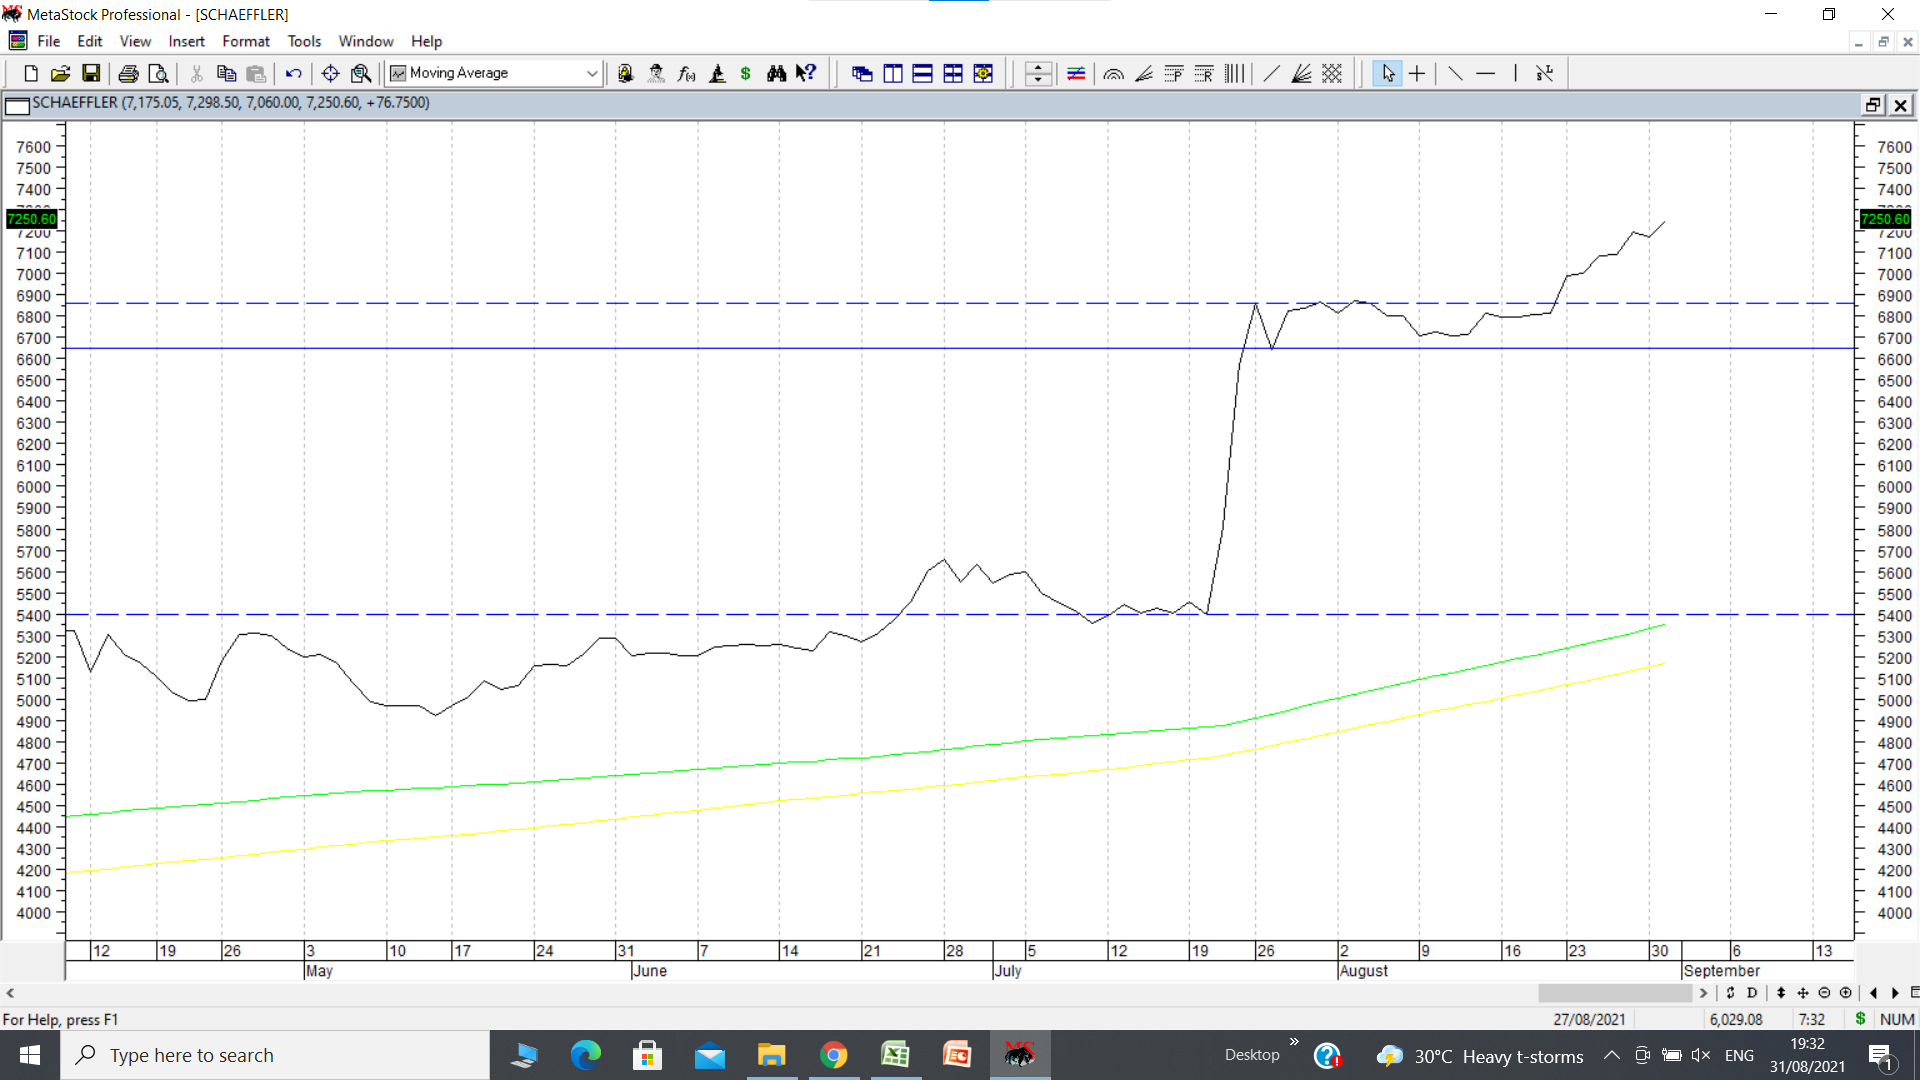
Schaeffler India has been discussed in a previous post as an all time high breakout candidate. Putting up a chart which I find interesting in same company. Stock price has broken out of a flag pattern. Height of flagpole is from 5400 to 6860, a height of 1460. Adding that to breakout point of 6860 provides a target of 8320. Previously it was mentioned at around 6700 when stock price broke out of all time high of around 6000. Results and concall have been good.
Tata Power is a company that is transforming itself in terms of business model and there seem to be multiple triggers fundamentally. Following chart is interesting and findings are written on chart. disc: invested based both on technicals and fundamentals.
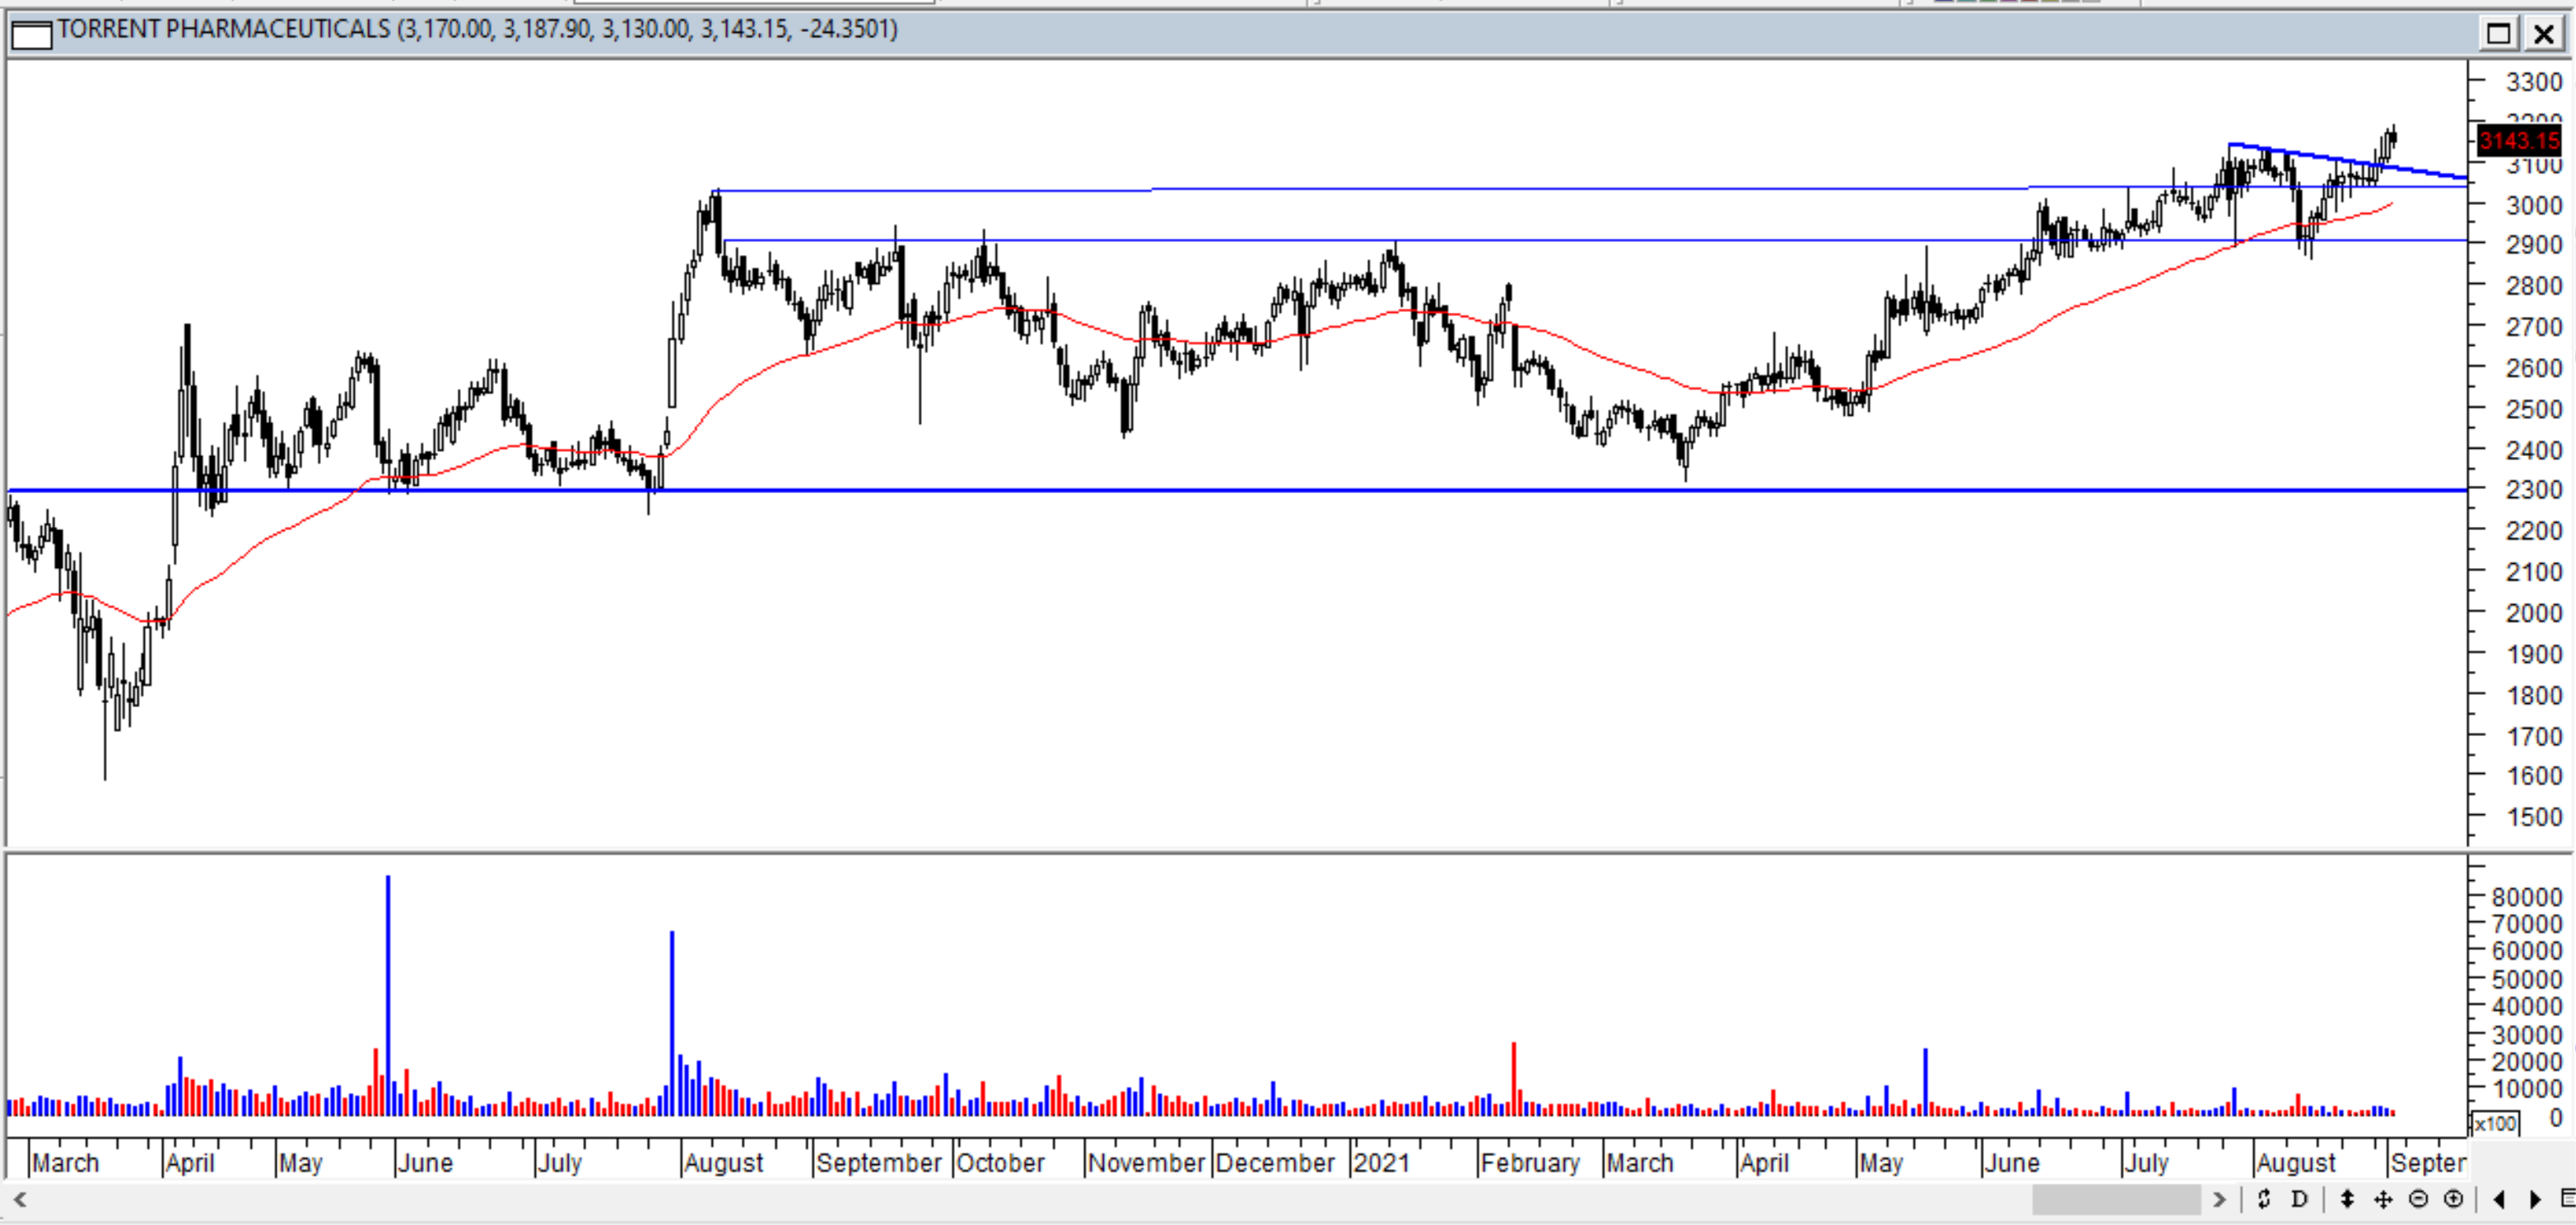
Most Pharma names have been correcting sharply after disappointing results. However, one large pharma name that is making new all time highs is Torrent Pharma. However, the volumes continue to shrink on the right side of the pattern. Lets see if we can get a move with volumes
Have booked profits in Naukri. Here is the updated chart showing a very clean move from Breakout. Nothing wrong even here but the first targets were done and I had a positiong in F&O so sold into strength.
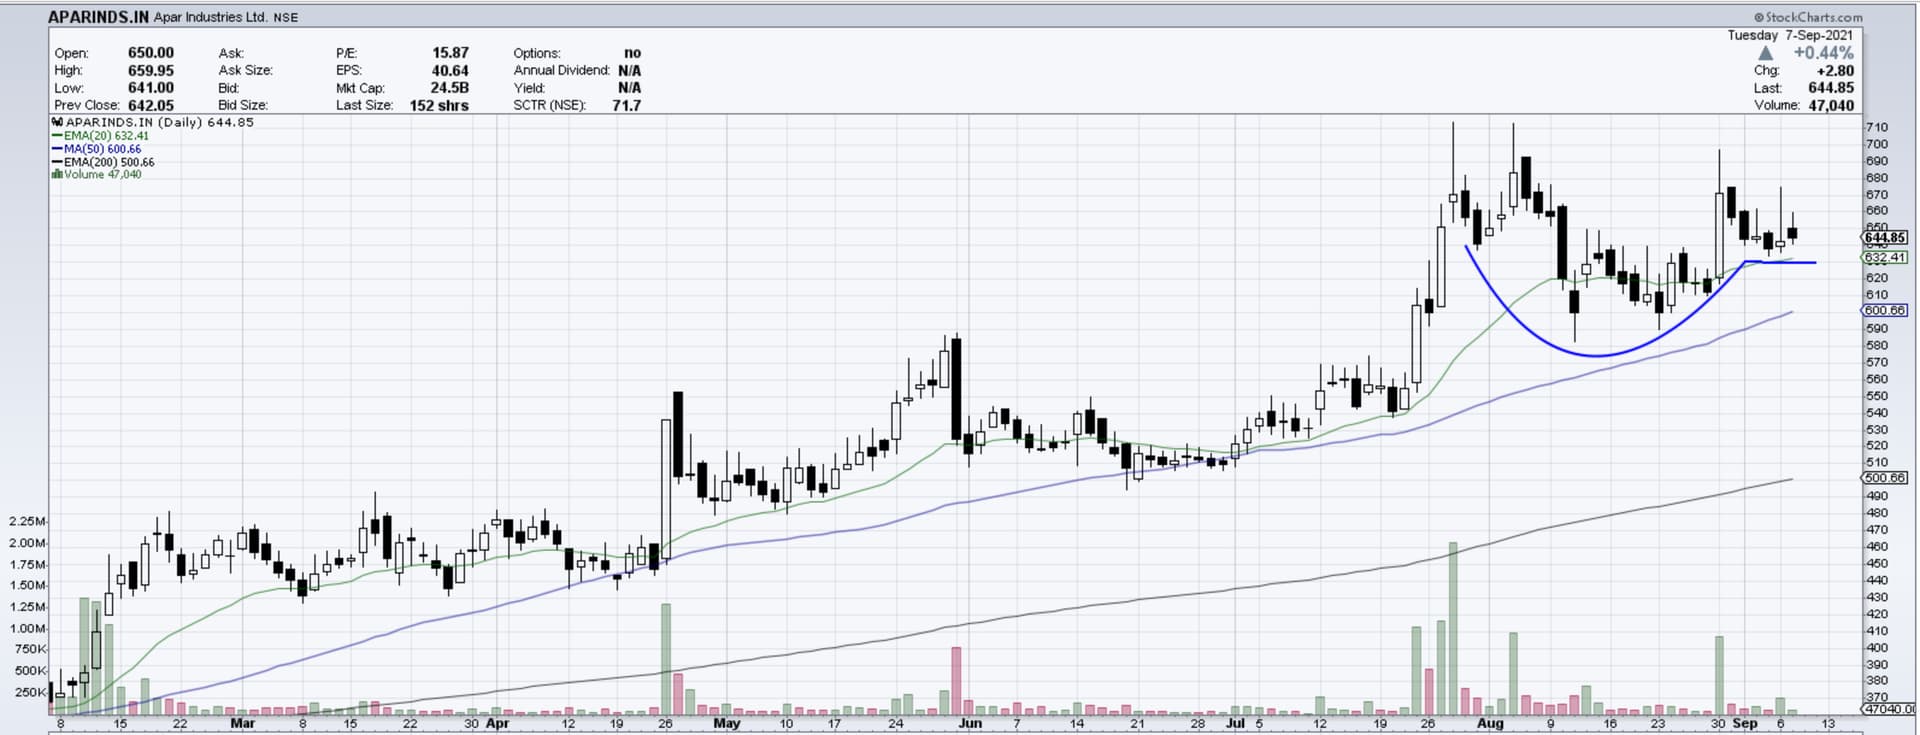
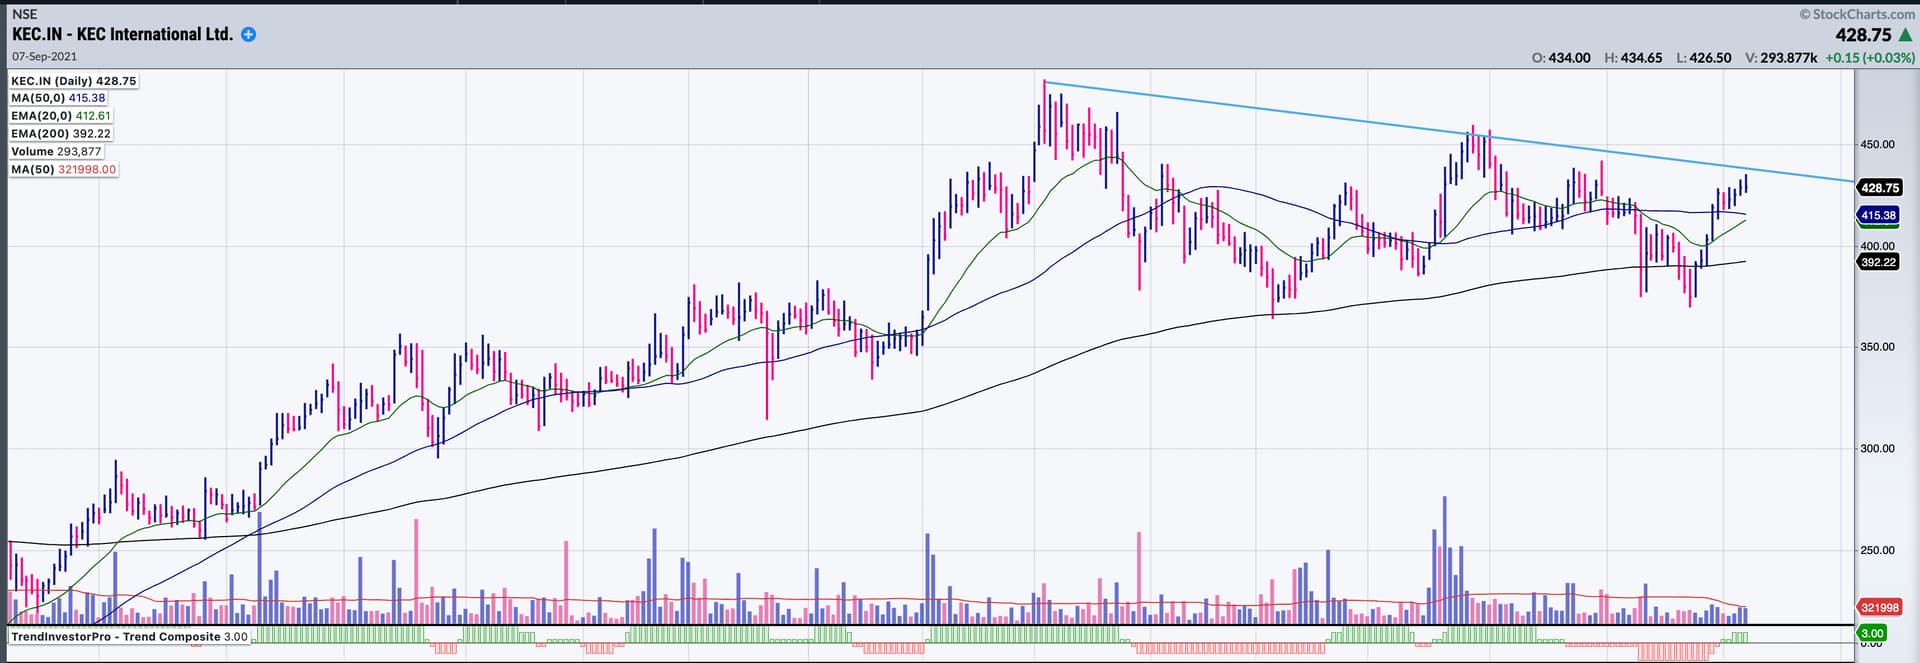
Electric-power transmission sector stocks are near 52-week high and forming good cup & handle/rounding bottom formations.This sector may benefit from the stimulus from the government to create employment and income in this pandemic situations.
Sharing some chart setups which looks interesting.
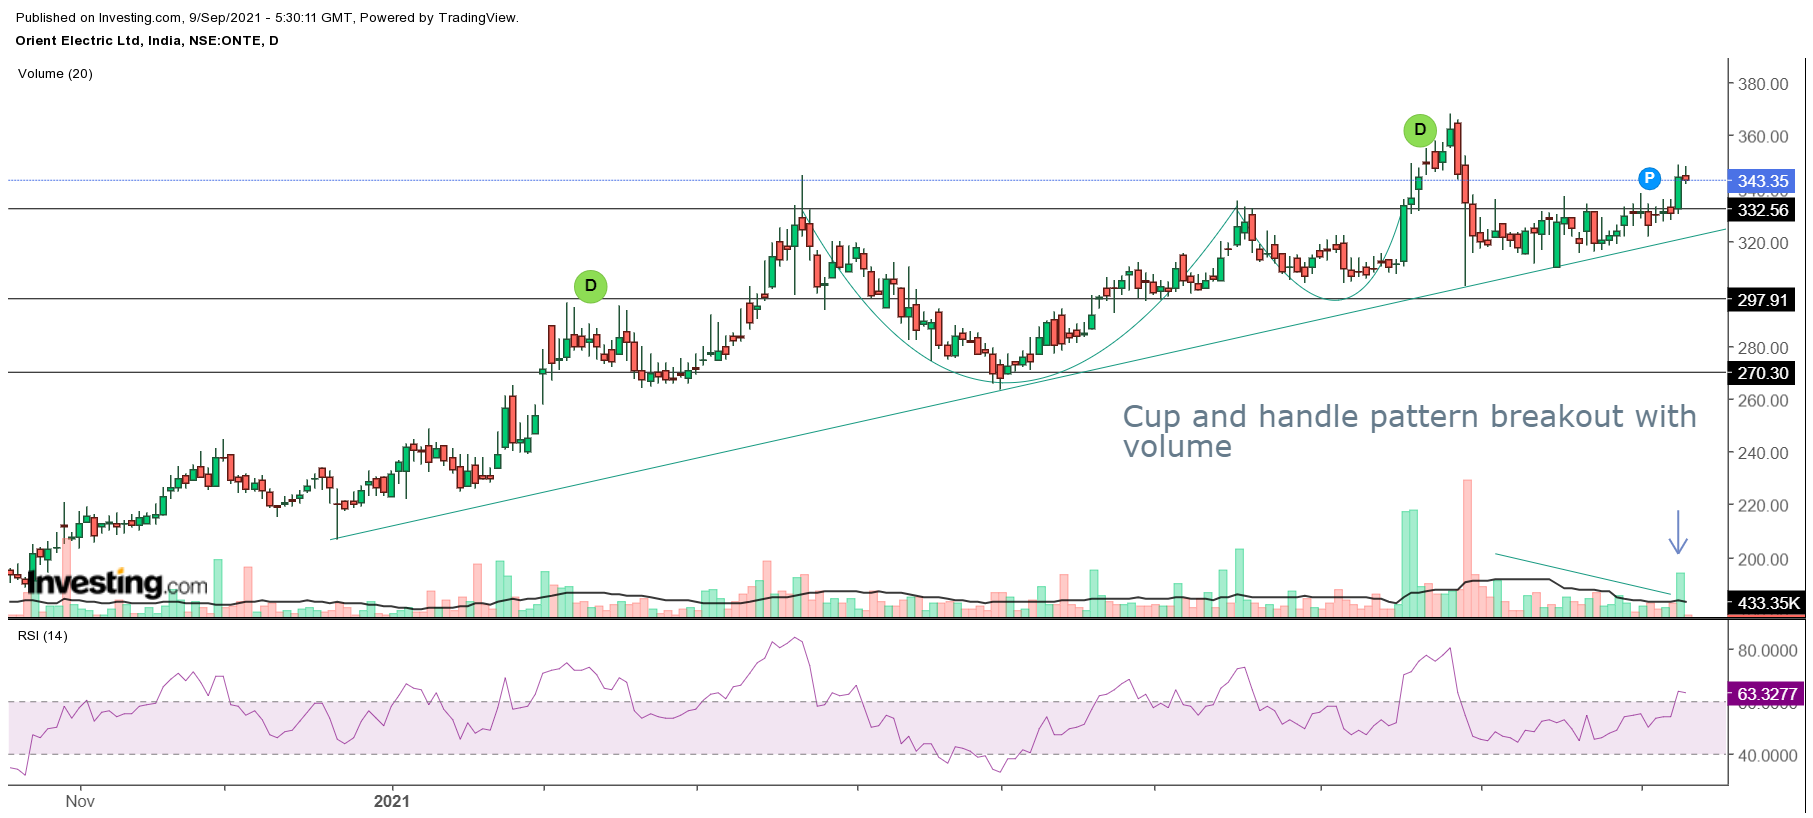
Follow up to my July 17 post in this thread above on Orient Electric. Stock corrected post breakout after June 2021 results. While it had impact of lockdown but peer havells did well. Stock corrected and took support on trendline. Bounced back with good volumes. All consumer durables are doing good on expectation of better performance in coming quarter
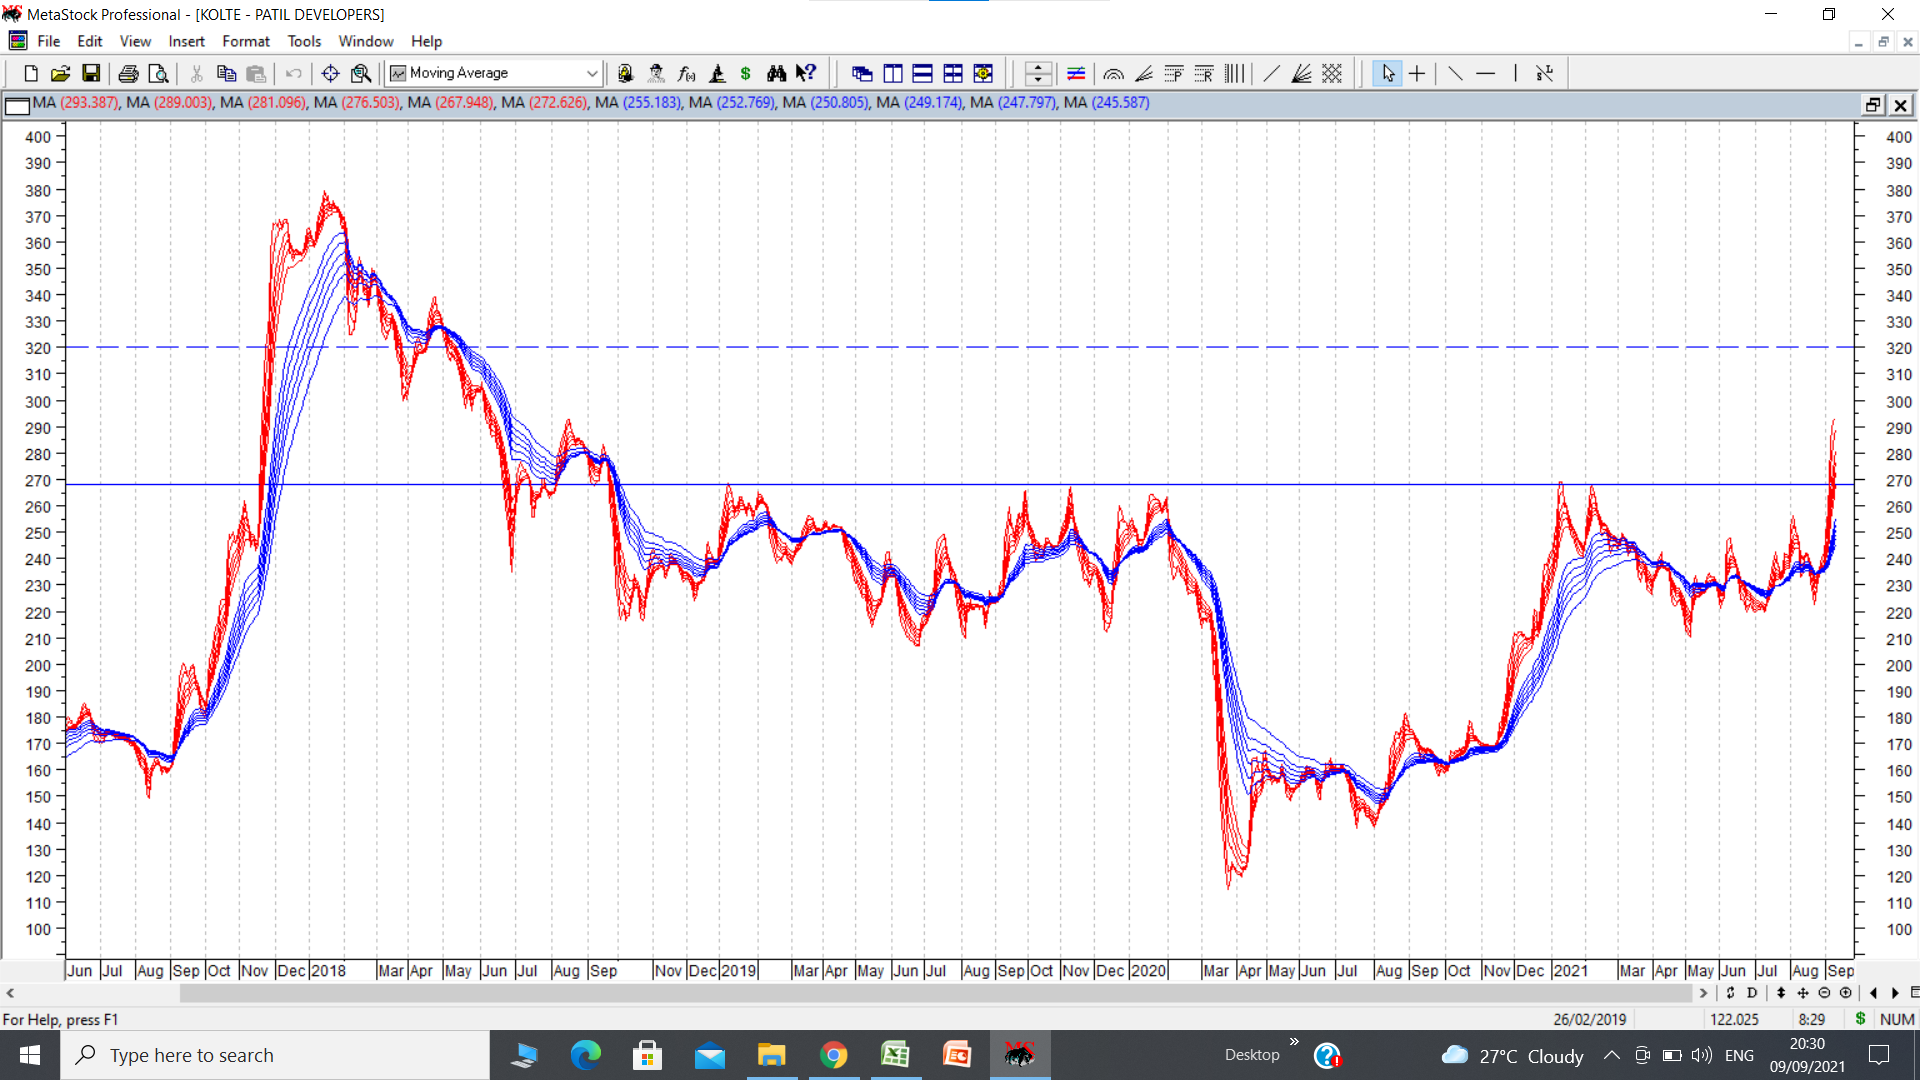
KOLTE PATIL a real estate company recently cleared an important pivot at 270 . It has broken out of a cup and handle pattern / or complex inverted head and shoulders pattern with targets of close to 400. With strong moves in most real estate sector stocks, it looks interseting. disc: starter position based on strong chart pattern.
Hitesh bhai - Slightly off topic but any book recommendation on crowd psychology behind various technical patterns? I can sort of understand why any pattern would play out in intraday trades but when a pattern span across months and years, it doesn’t seem very intuitive that collective psychology would steer the stock price in a certain direction. Of course it is all probabilistic but i am looking for some resources to understand this better.
PS: I would delete this message if someone points out its irrelevance to this thread.