We have always done this. The way consensus forms has changed, the medium (excuse the pun) has changed, but the outcome and behavior is still the same. It took a Faraday to figure this out - that shows how non-intuitive this is for the rest of us.
I think The Next Apple tries to cover the psychology behind multiyear and 52 week breakouts by trying to give logical reasons. Its a book oriented towards medium to long term investors so could fit the bill.
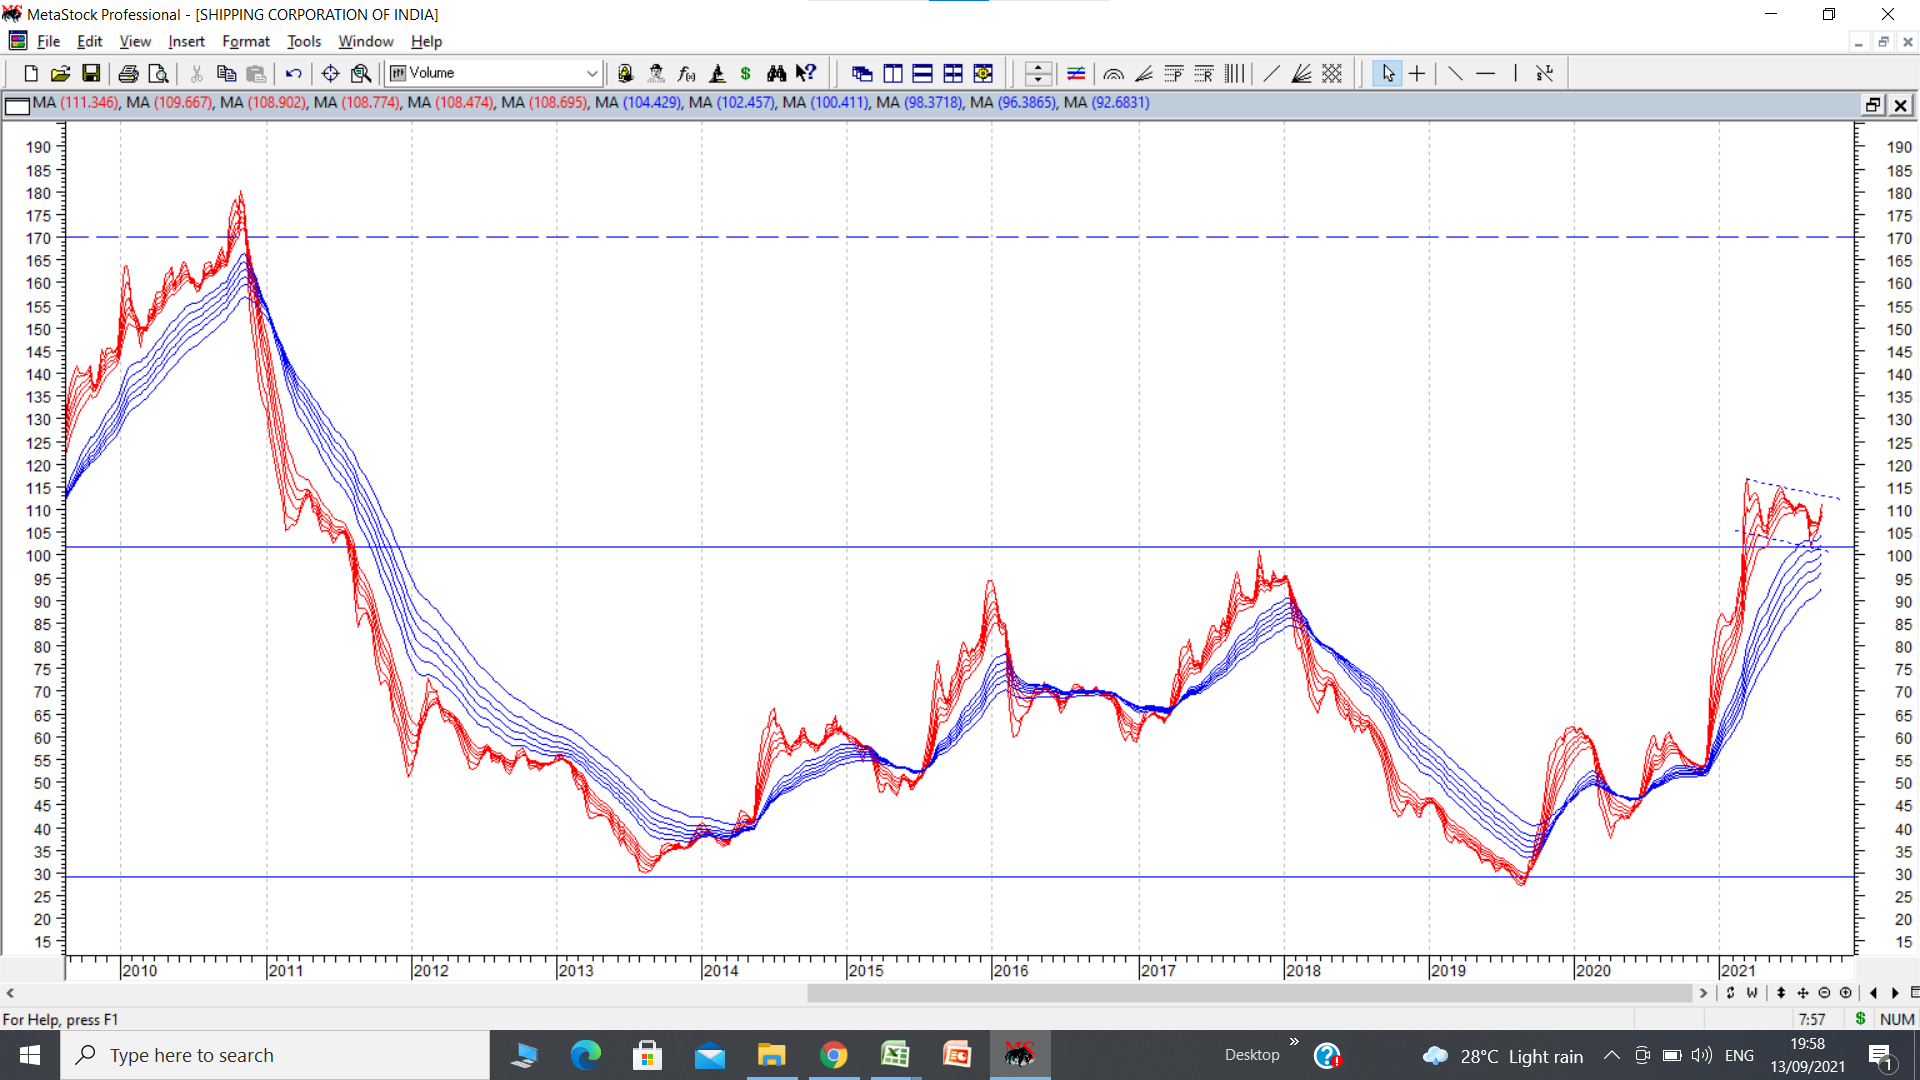
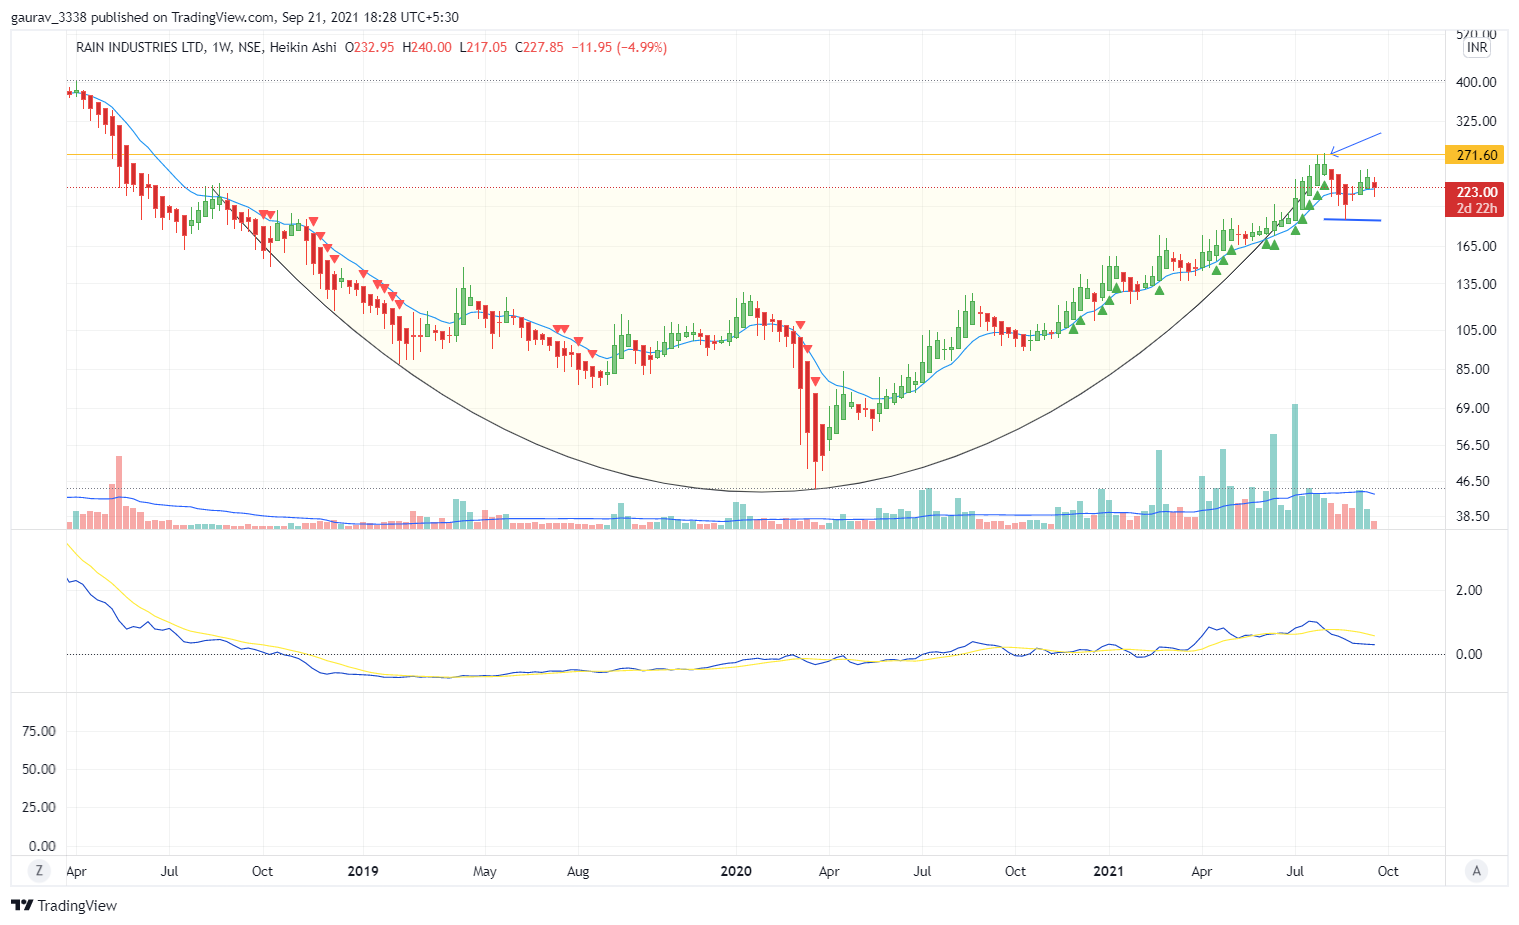
SCI cmp 115 is showing an interesting pattern. It broke out of a 10 year high above 100 levels (113 on bar charts) and went up to post a high of 135 and then retraced to retest its 200 dema at 93. Since then it has gone into a steady uptrend and currently it is around 115. In the process of this retracement which has lasted nearly 27 weeks it has formed a flag like pattern (marked on GMMA chart posted below. This flag is sitting right above breakout level and assumes a lot of significance) and now seems to be breaking out with decent volumes in past few days. Pattern target of a double bottom long term breakout as well as flag breakout is around 170. (disc: invested and no activity since past few weeks.)
In this rally post Covid, which has spanned part of 2020 and all of 2021 till now, one thing I have observed is that most technical patterns like cup and handle, flag, double/triple bottom etc have played out in a text book fashion. Timeline for these patterns to play out have varied but the net results have been according to expectations.
The other crucial thing I have observed here is that in most patterns once the targets have been reached, there is the inevitable profit booking. Many a times post this profit booking the upmoves resume after brief consolidations. Sometimes post breakouts, there have been sharp falls, more so in frothy upmoves.
So what I have been doing is that I tend to book atleast partial profits wherever I do not have too much fundamental comfort. Other places where I feel business prospects are good and valuations are comfortable, I have managed to sit tight.
Regarding criteria to ride entire upmove, I think the foremost criteria should be strong tailwinds in the company and the sector. Once that is established, stock prices usually rally hard.
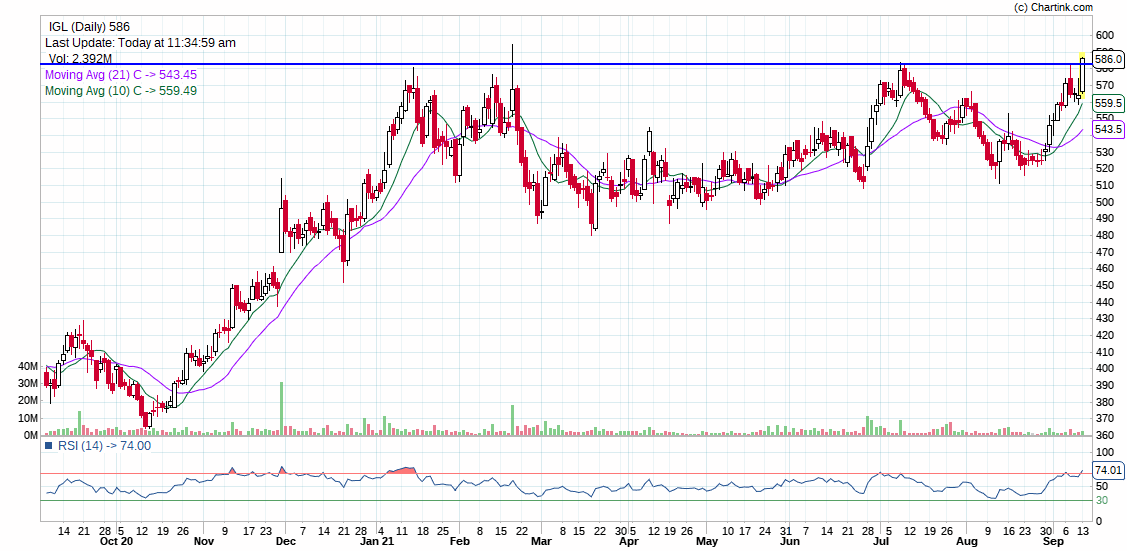
Indraprastha Gas is breaking out of a cup and handle pattern with volumes. It is entering new high, except for a short lived wick that had hit 595 intraday on 18th Feb.
Target will be 650-680
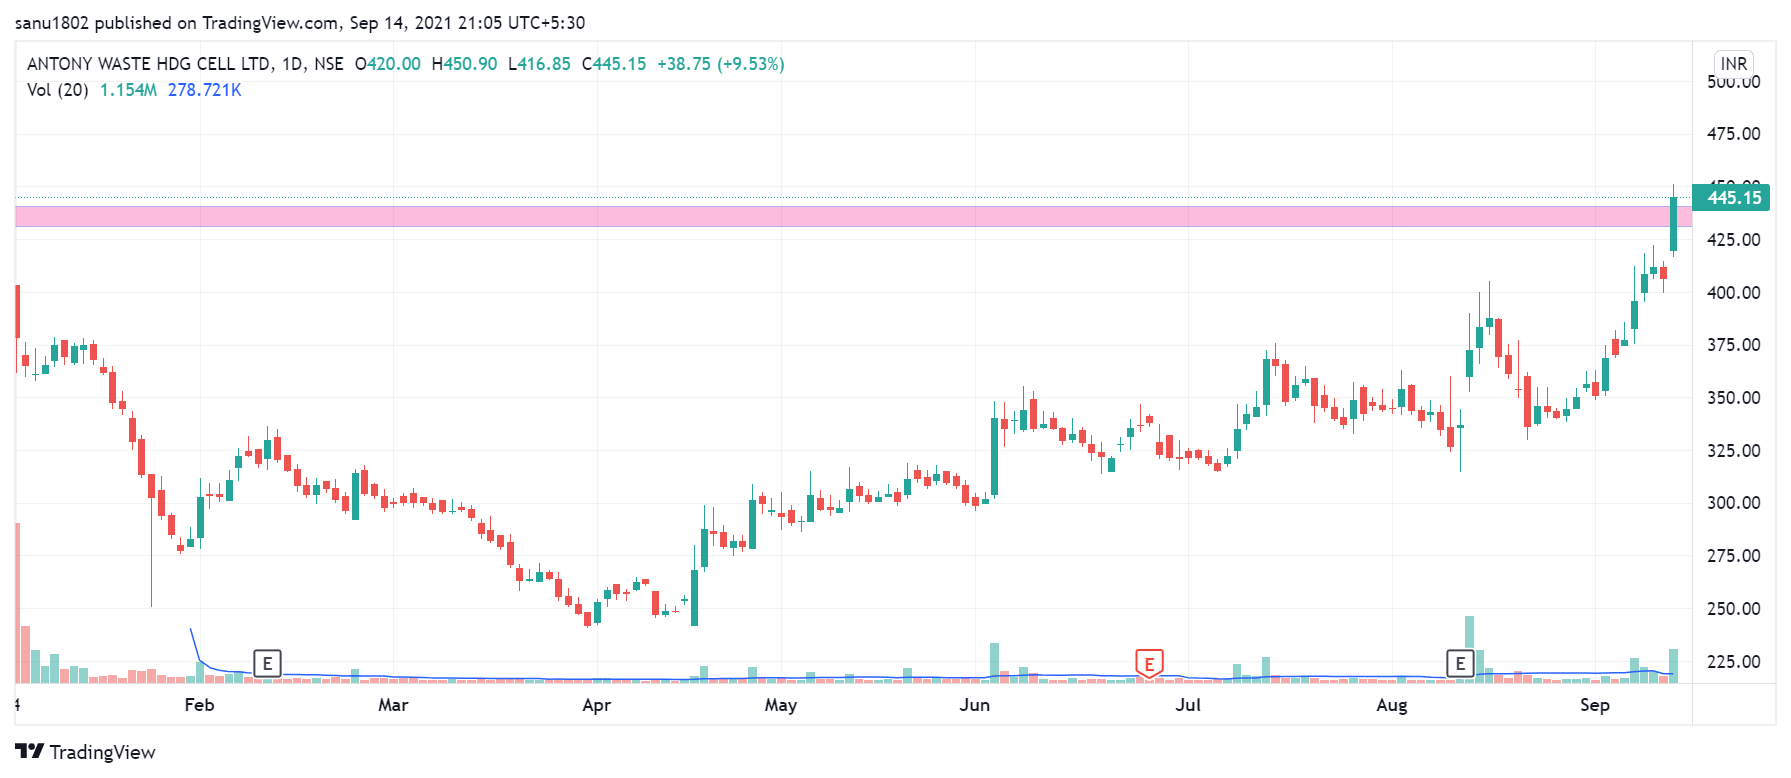
Antony Waste: After listing it was in downtrend and now it is crossing all time high on closing basis. Accumulation seen as many green candle with high volume visible.
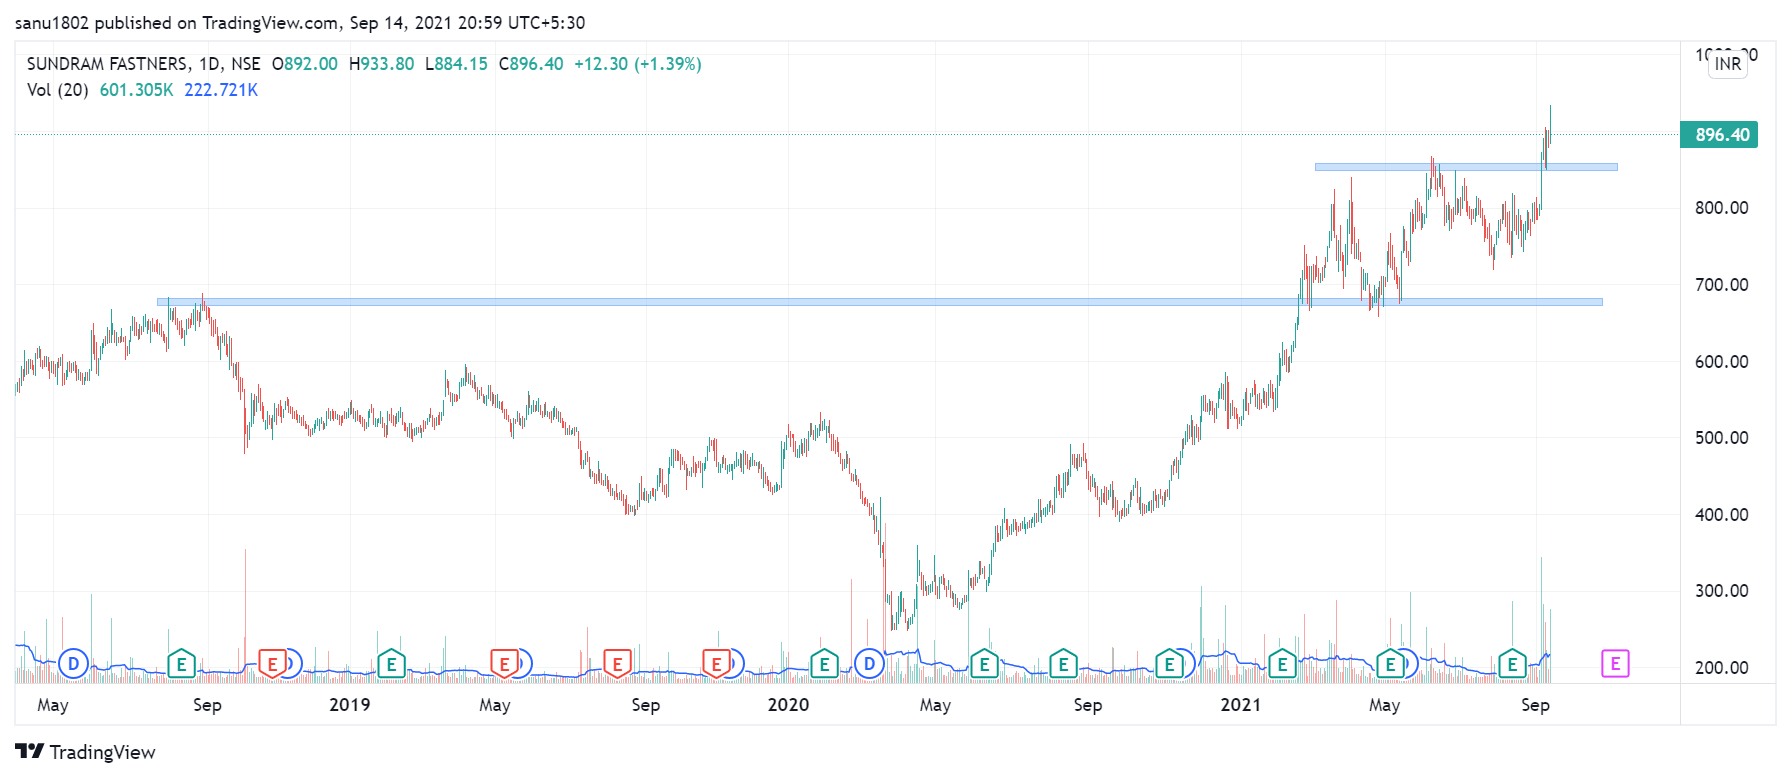
Sundram Fastners: After breaking its previous high of 690 in feb’21 month, it was consolidating between 700-850 range. Broken this range with good volume.
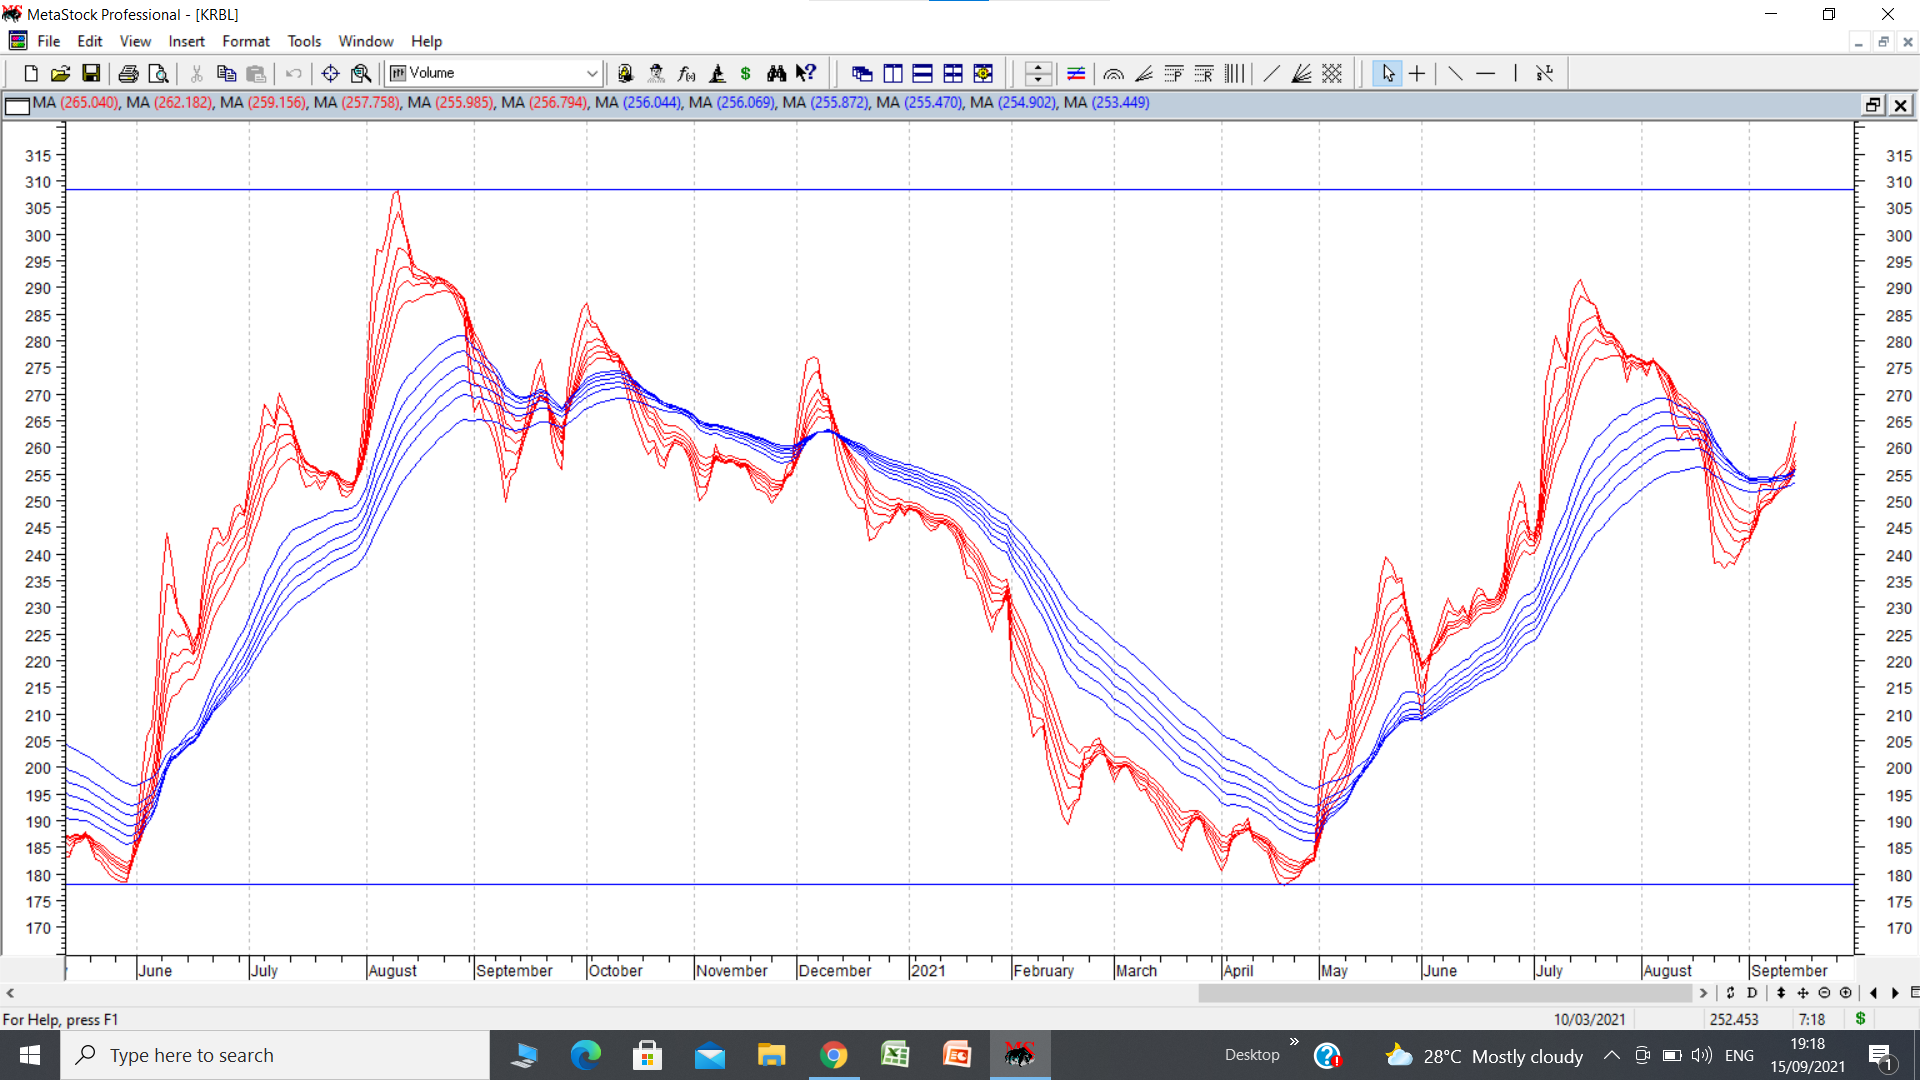
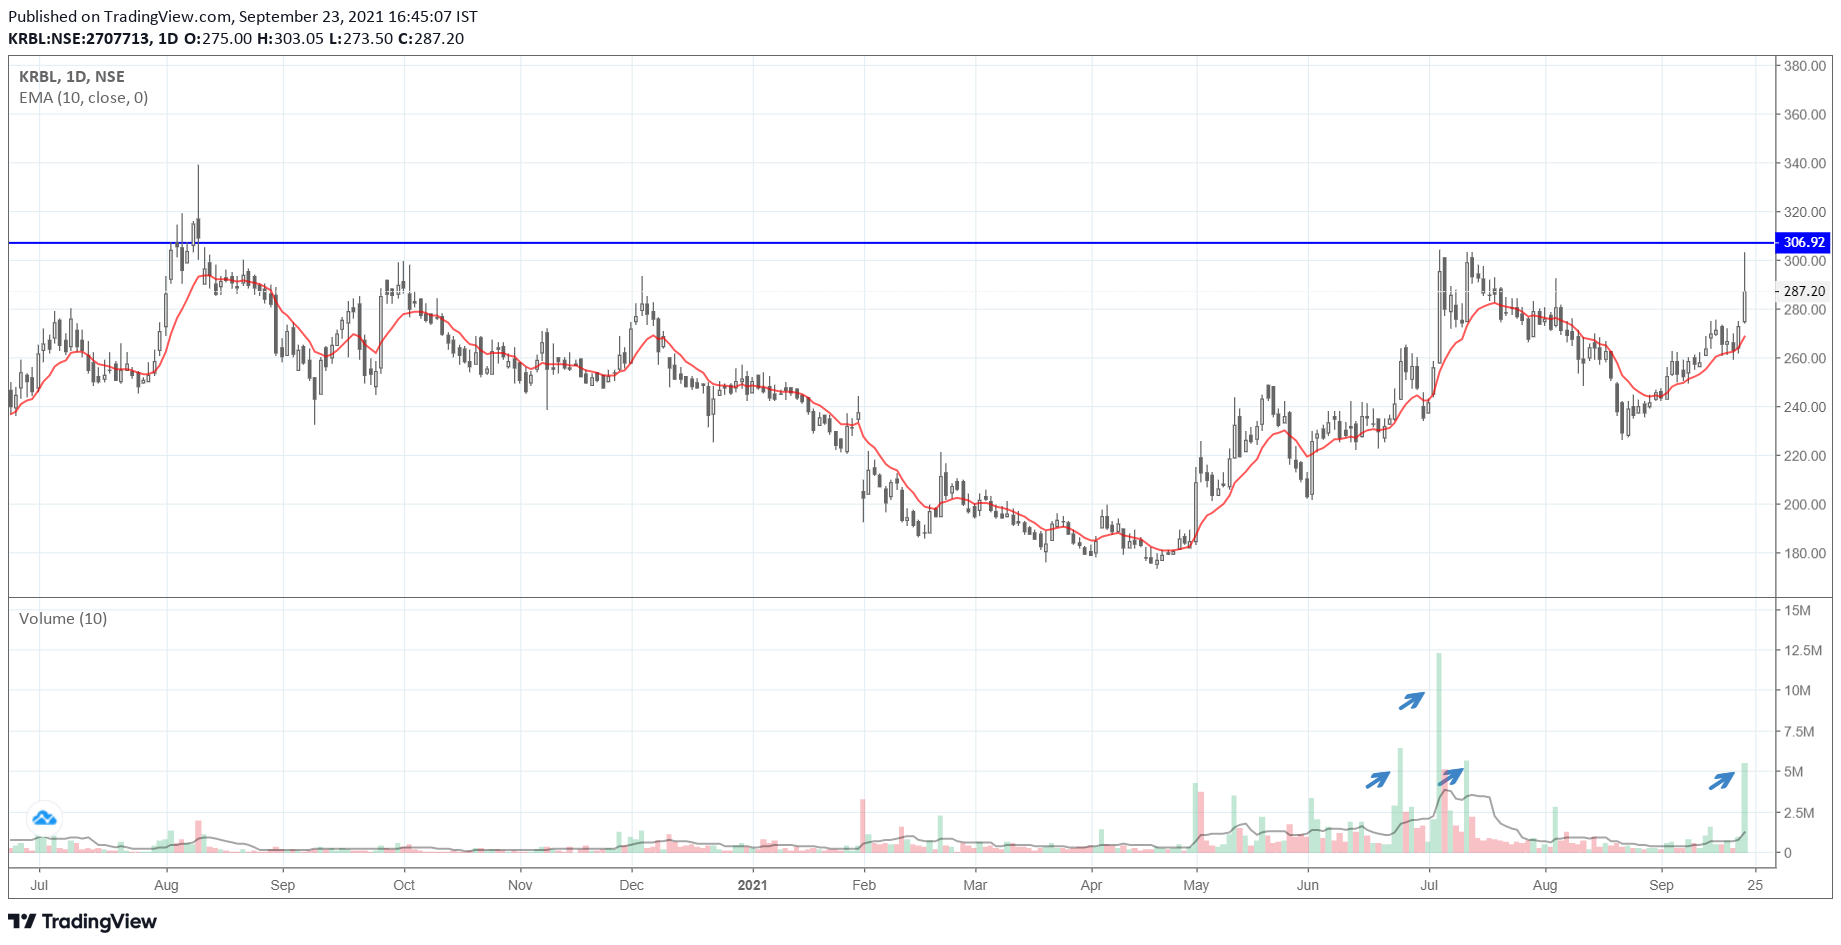
KRBL has an interesting chart possibility. Stock price was consolidating below 262 since 18 august 2021 and gave a breakout above it on 14 sep 2021. It has assumed a small atypical cup and handle formation with potential upside target of 297. Now putting a daily GMMA chart with double bottom at 178 which gets confirmed on price move beyond 308. If and when this happens, targets could be 438. Company has been mired in controversy because of promoter issues with ED and one of the guys going to jail and ultimately getting bail. Business wise it remains a market leader in the rice segment and has been a dominant player for many years. disc: starter position.
Hi Raghav . I was practicing all the stocks discussed under Cup & Handle on this forum and found some aspects which might answer your question, hopefully. What I found interestingly that post Cup formation, it’s must to have handle formation within the range of 15-20%(learned from William 'o Neil book)for that stock to go for another big move. So, considering your example , you posted around Jul 19, If i see today , the cup is forming a handle now highlighted in blue. so , My pivot point/entry point would be breakout from the high made on the right side of the cup(Highlighted in blue arrow). This chart is on weekly timescale. Now, sometime(It happens rarely) that cup don’t form any handle and hence if we don’t want to miss the rally, good to enter on the breakout of cup with initial 1-2% of capital considering that you might see some drawdown of 15-20% if handle forms and later on when breakout happens from the handle, enter with rest of the capital , let’s say rest 3%, assuming 5% allocation you would like to put in a stock.
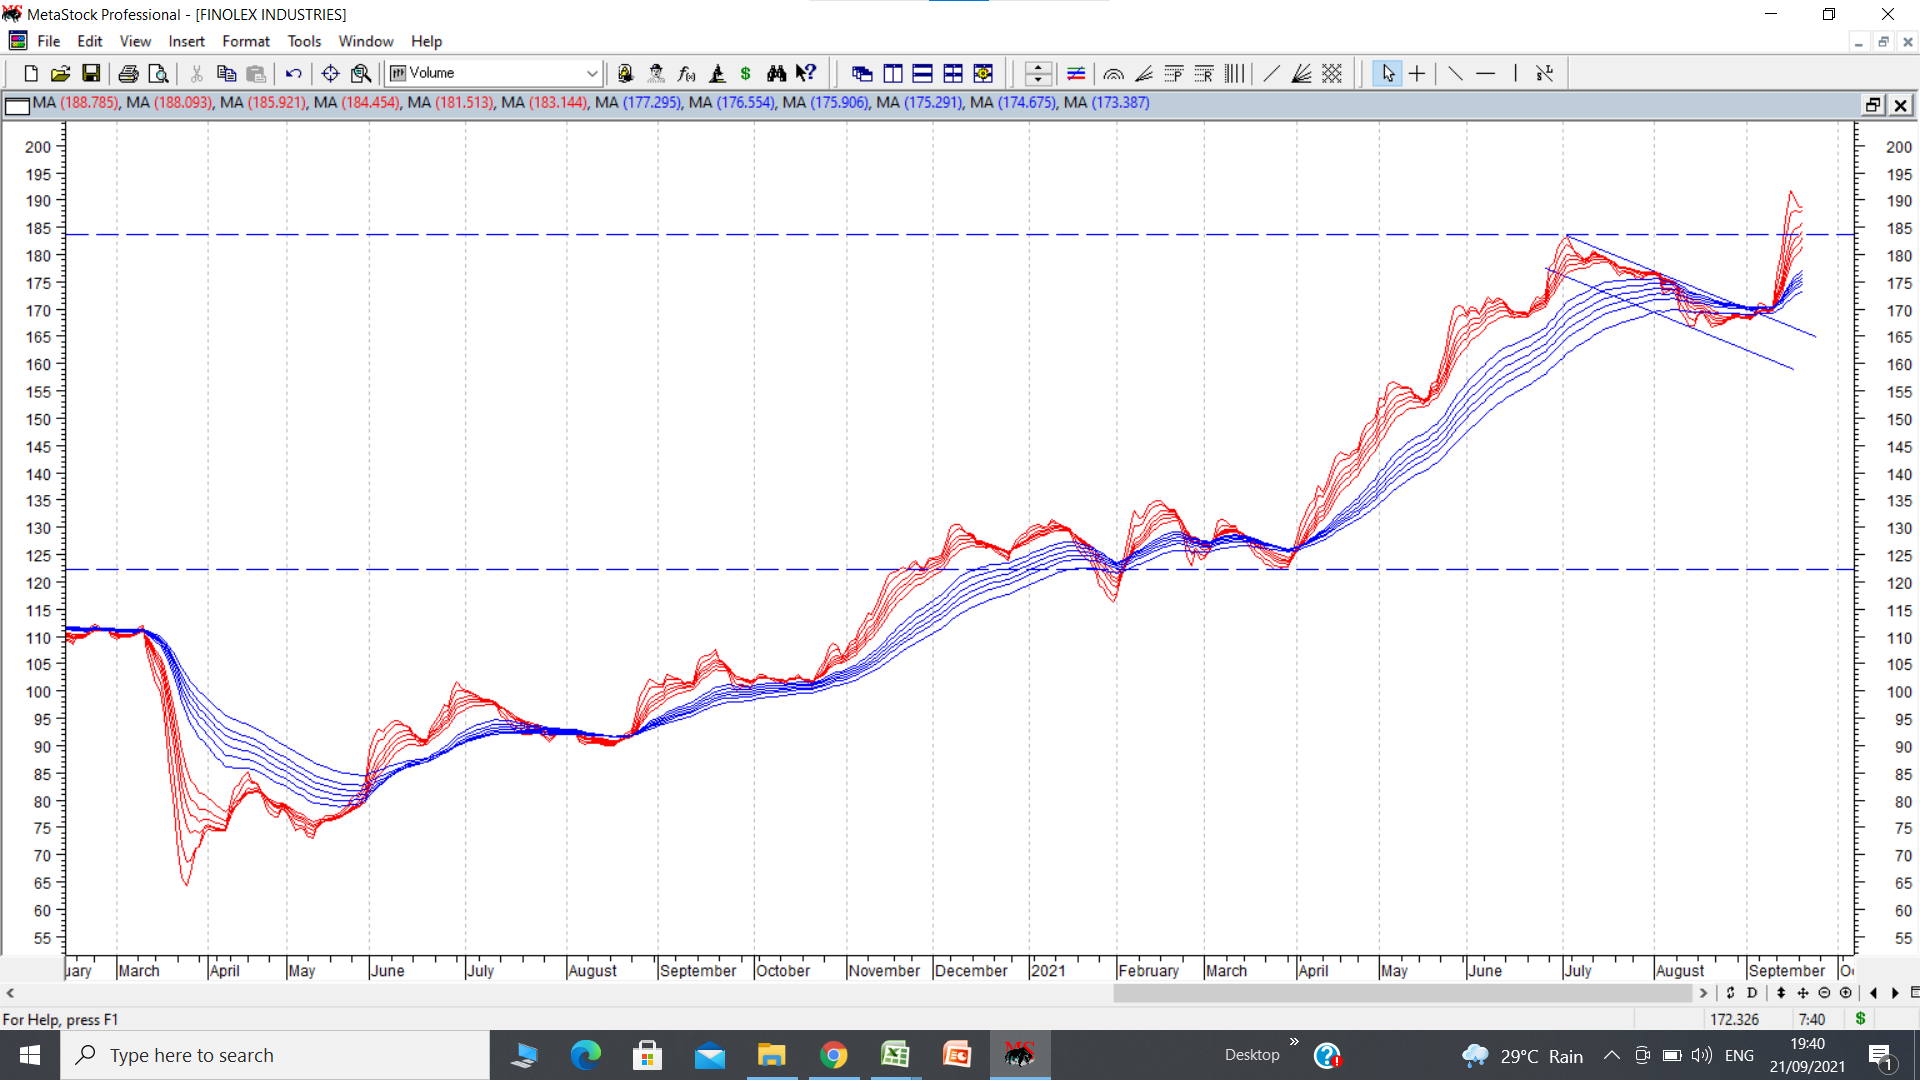
Finolex Inds is an agrigultural and domestic pipes manufacturer. Its the only pipes player which is fully backward integrated into PVC resins. It consumes part of the PVC resins it manufactures and sells surplus in open market. Now it seems PVC resins prices have risen a lot since past few weeks. Stock price has been in a consolidation between 160 to 200 since past 17 weeks. If and when it breaks out, it can move fast and provide decent returns. On GMMA chart shown below it broke out of a tight flag and target can be in region of 230. cmp 189. disc: invested based on techno funda picture.
I have a question regarding target calculations… I have been following momentum strategy for couple of years now with 20dma as my stop loss in case share runs after I buy but recently I have been facing problem that even though it goes up by 10-12 % but by the time price comes below 20dma it has already lost most of the gains
In this case, I want to follow the strategy what you are following where if target is met , book partial profit but I am unable to calculate the target levels. Can you please guide me to some book on how to calculate targets or throw some light on your process of target calculations?
For most of the breakout patterns/swing trading/momentum there are methods for calculating targets. In momentum or swing trading, its best to know targets beforehand. What I have seen till now is that whenever pattern (flag, cup and handle, rounding bottom, double bottom etc ) targets are reached, there is profit booking. However after this if and when stock continues to go up is something that needs to be seen. So at pattern targets it makes sense to atleast book partial profits.
For calculating targets, each pattern has simple calculations of getting targets. You can even google the patterns I mentioned and there too you will find a few lines about target calculations. Or else read standard books on technical analysis.
Personally I do not follow moving averages as my breakout parameters. I look out for definite patterns where breakouts happen and targets can be calculated.
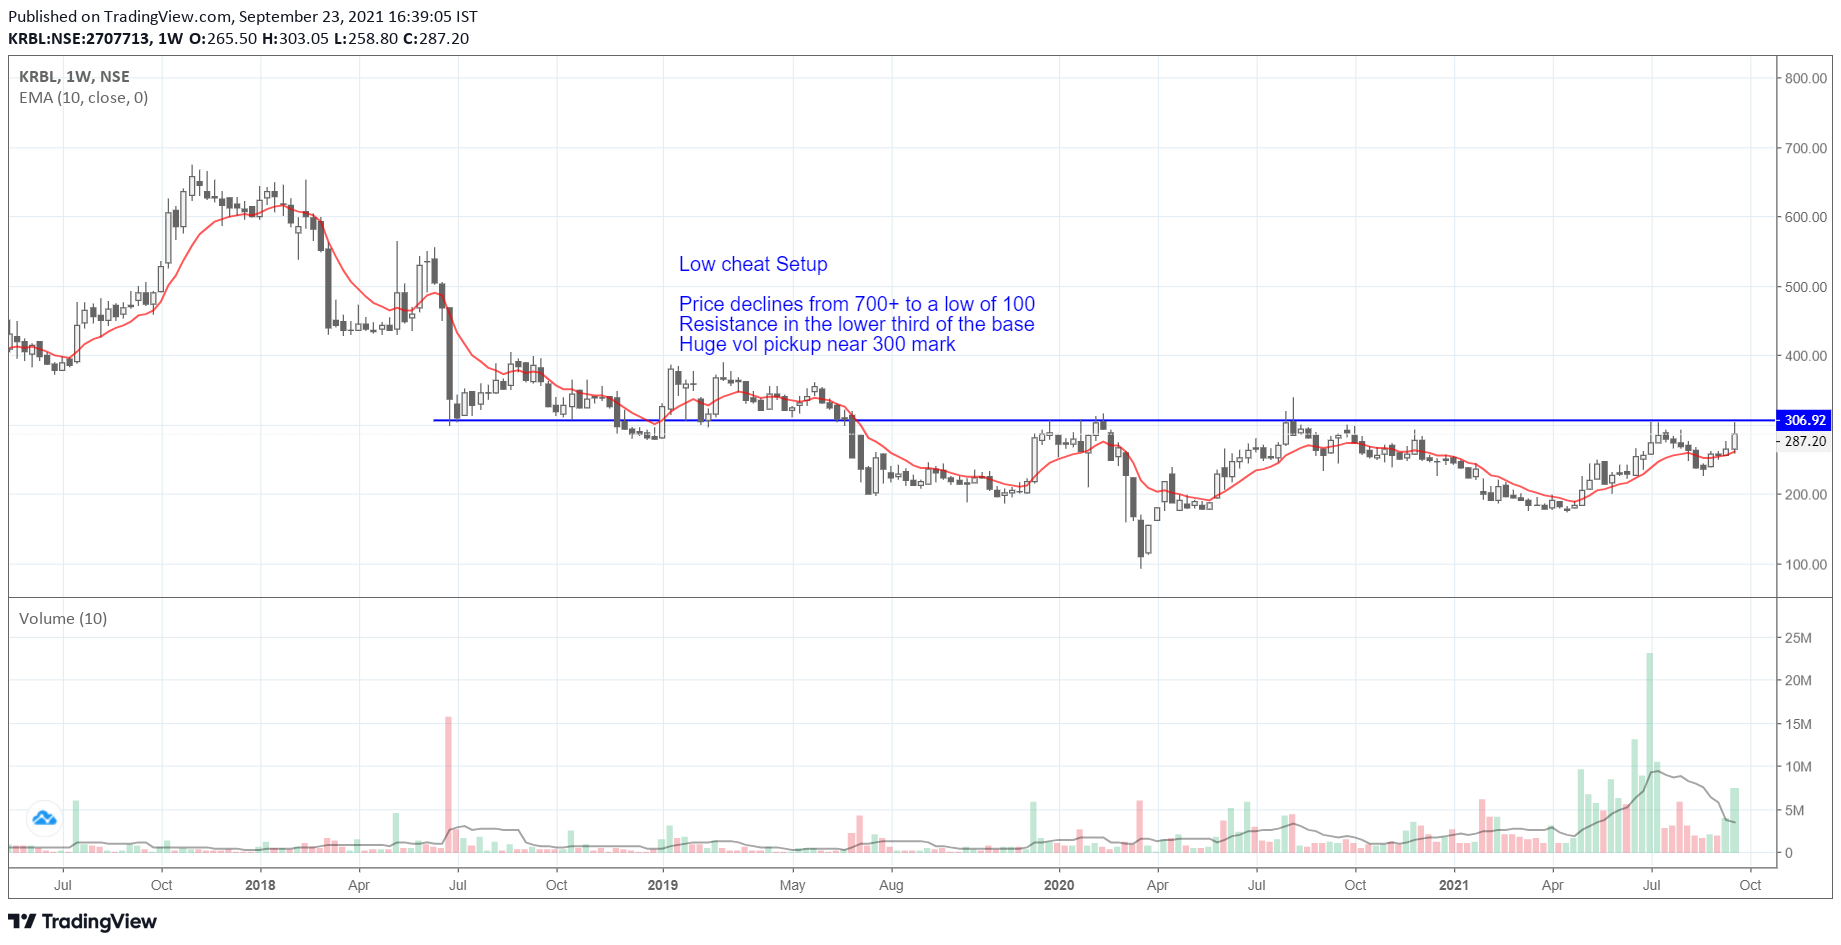
KRBL weekly chart shows good base formation after fall from 700+ level. The current price is around the lower third of the base. It has met multiple resistances around the 300 mark. The last time it tried to hit that level was on very high volumes. As per my understanding, Mark Minervini refers this as a Low cheat entry
Setup looks very very good to me. Lets see where it can go.
Discl: Trading bet with 5% allocation. I plan to increase the allocation. Shared for learning purpose.
Edit- missed out the management interview takeaways
10-15% shortage of Basmati rice.
Price of first crop of one of the rice varieties is up from 19rs last year to 28-30rs
Other varieties prices also expected to be up 10-15%
KRBL has a stock of 300,000 tons, highest in industry
Realizations expected to go up in Q3 and full effect in Q4
Acquisition of a food company can be announced by Dec21. Cash on books 850cr
Today Chalet Hotels has broken out of consolidation phase and hit yearly high. It has spent a long time within 150-200 range and consolidated. Technical experts are requested to give their comments on chart pattern and possible target in short term.
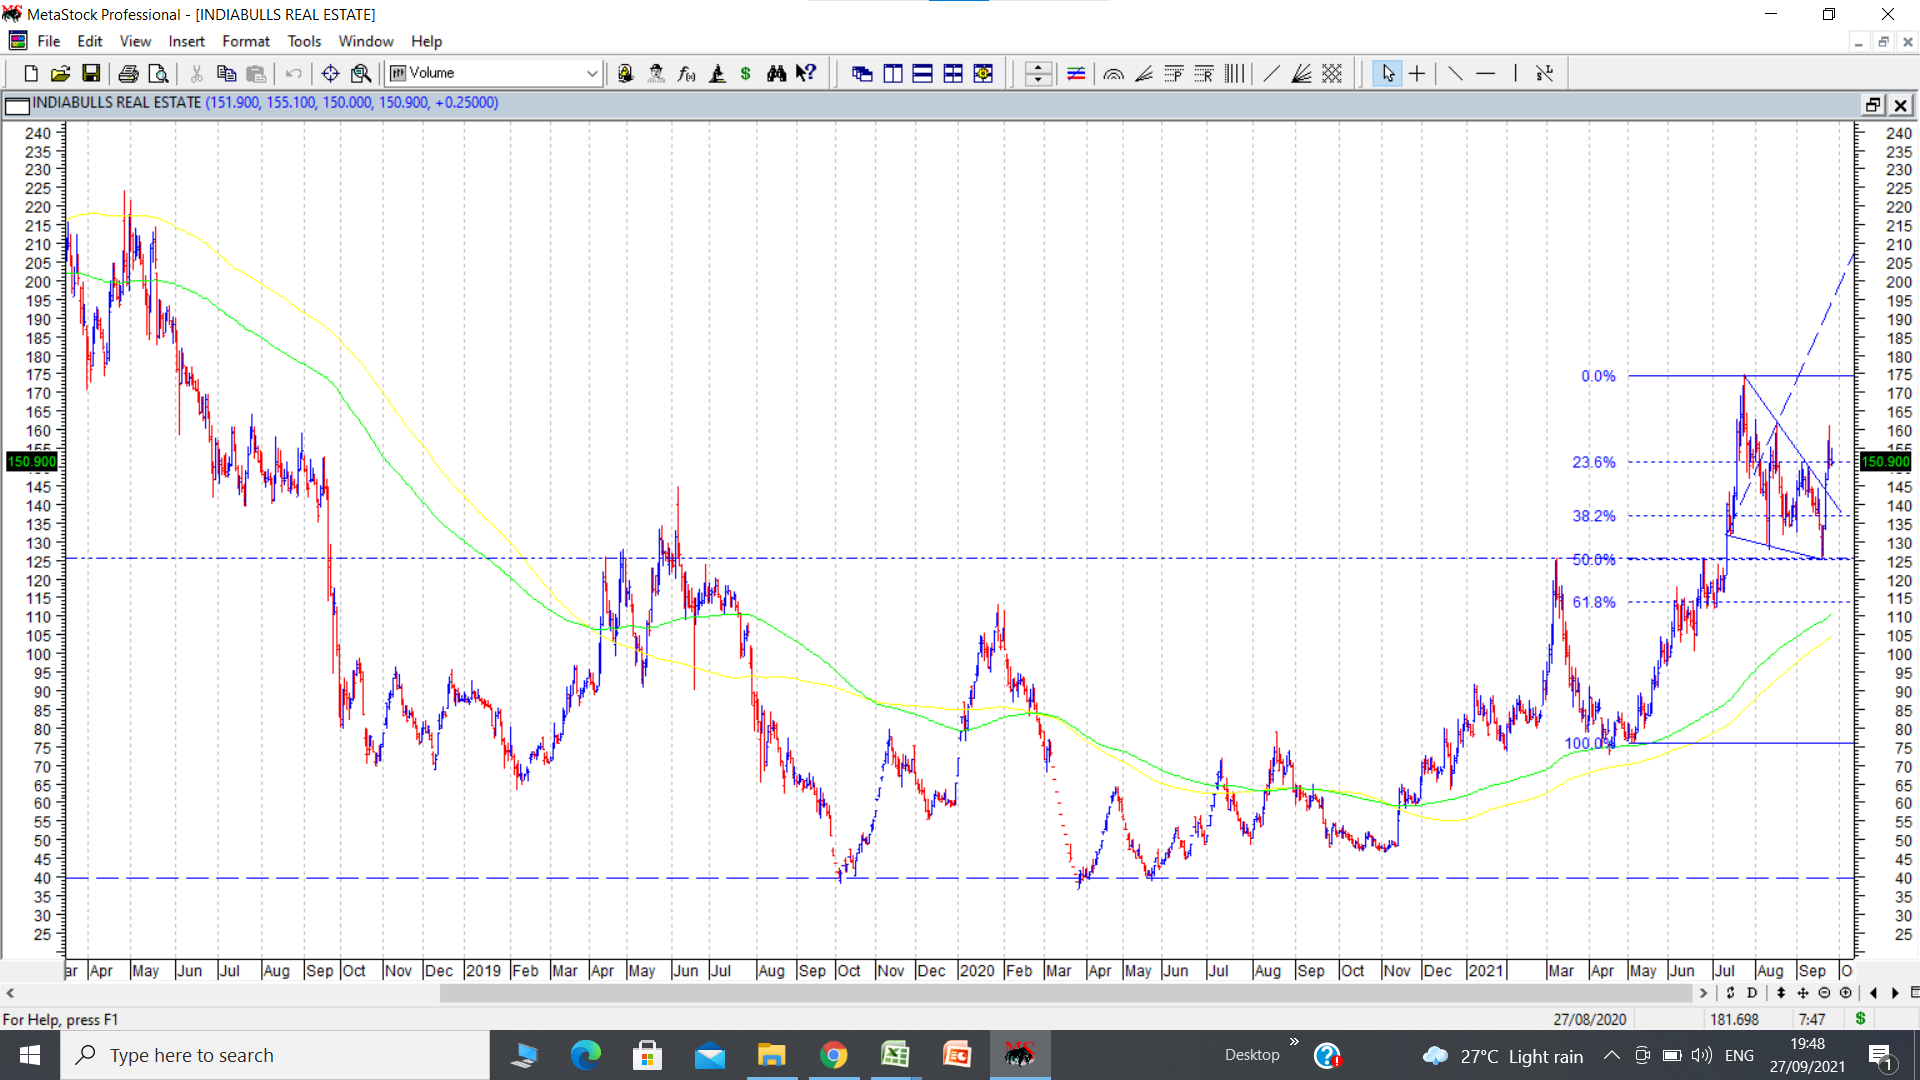
One of the stocks I am invested in is IB real estate. At the time of investment the main theme was management change from the original IBulls group led by Sameer Gehlaut to Embassy promoter Jitu Virwani. Plus the presence of Blackstone was another comforting factor.
Since past few weeks, the real estate pack has been on a strong rally as a sector and IB real estate also had its share of rally. In the process if made some interesting chart patterns. First was a breakout from a cup and handle pattern above 125 with target of 170. That was duly achieved when stock hit a high of 174 and then started retracing. The retracement took the form of a triangular consolidation as marked on the chart. Note all this happened above the sacrosanct breakout level of 125, which incidentally is a 2 year high breakout level. 125 also happens to be the 50% retracement to the previous rally from around 78 to 174.
I have drawn a triangular pattern called Wolfe Wave which works in some cases. The beauty of this pattern is that it provides working targets within a time frame. The target line is drawn in dotted lines and points towards a level of 200 or thereabouts in the near term.
So there is a confluence of interesting technical events here.
Breakout of stock price from 2 year high.
Cup and handle breakout and target achieved.
Retracement in form of a triangle ending at 50% retracement level, which also happens to be breakout level.
Wolfe Wave with possible targets.
A rounding bottom is visible on charts.
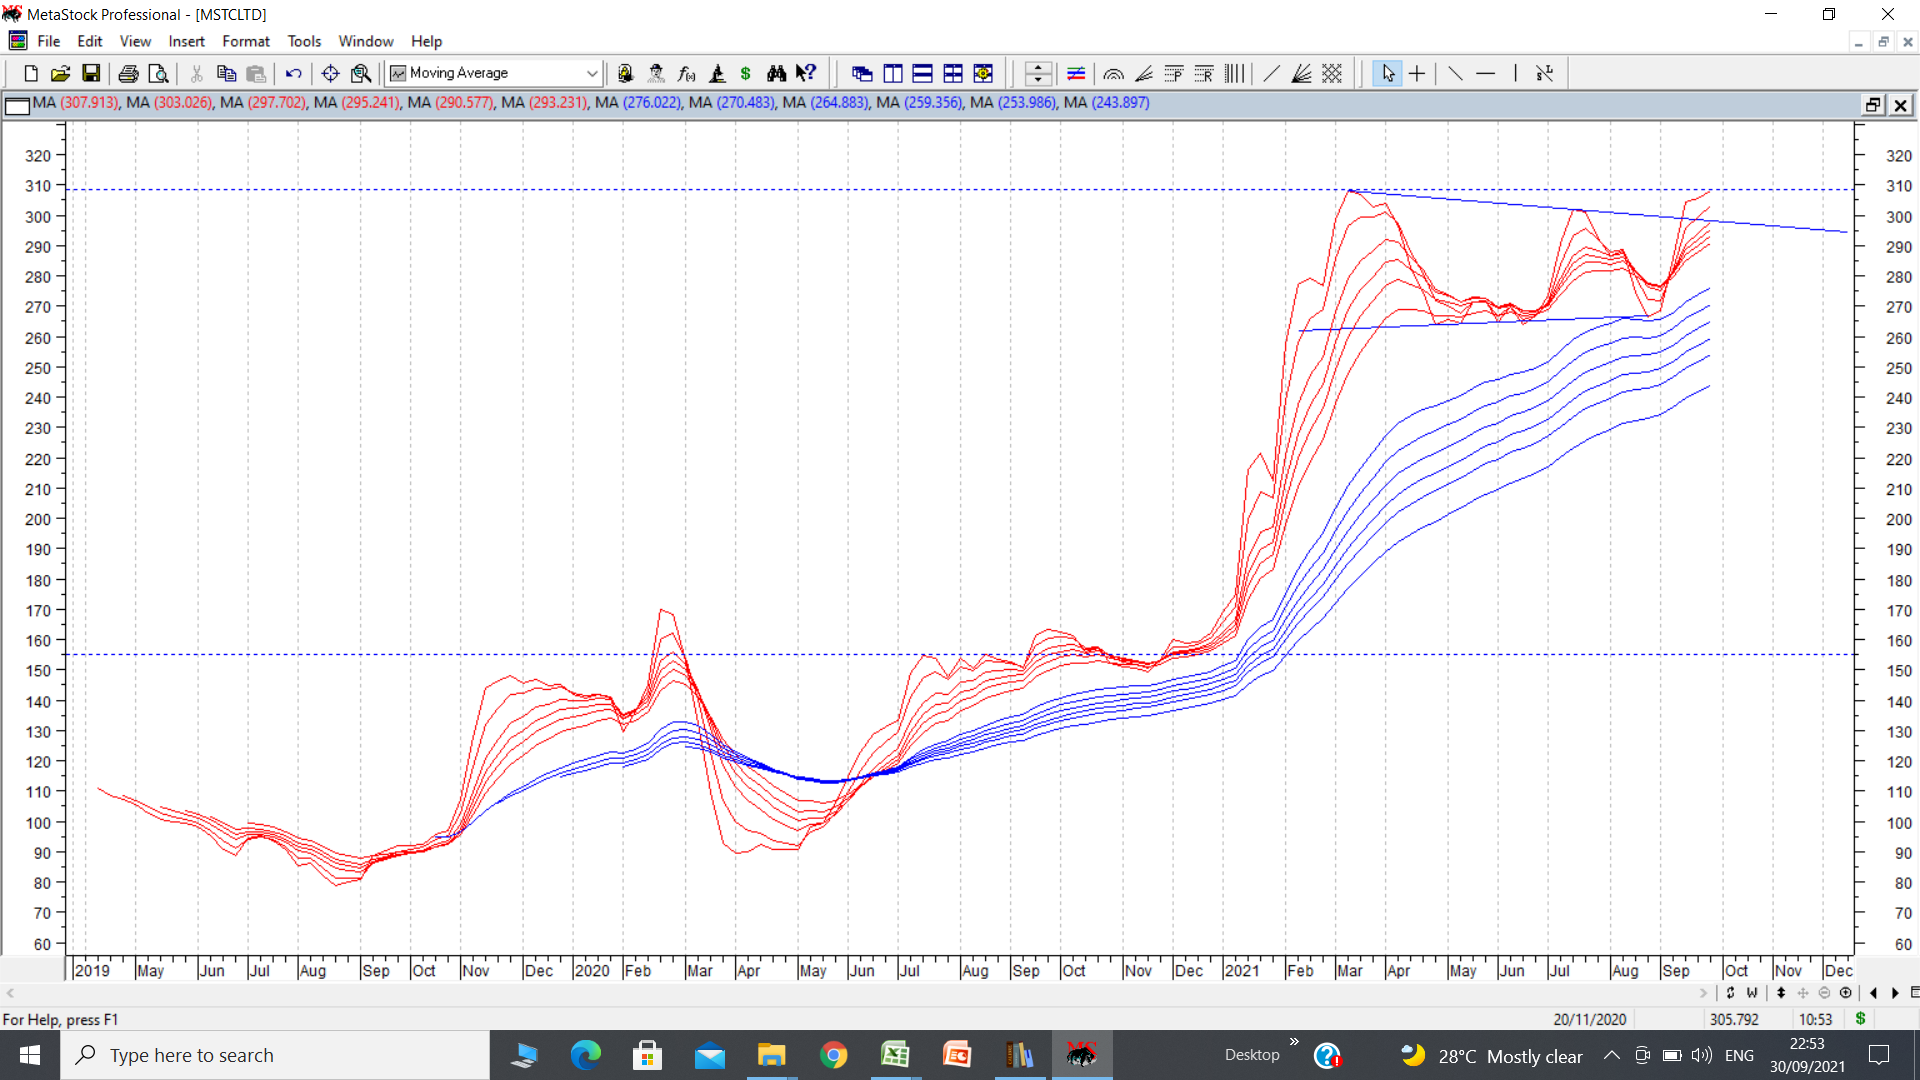
MSTC is a PSU company. A very informative video (youtube link) on the company’s business model and investment merits has been put up on MSTC company thread. I think it covers most points about fundamental analysis so no need to add more. Technically a flag breakout is visible on GMMA weekly chart. cmp 310. If pattern plays out, target can be 450. disc: invested.