Hi Rohit,
You are right about bank, you can also see nice setups in smaller banks as well like CSB, IOB, equitas and broking companies, like Motilal Oswal, angel broking.
regards,
Chethan
Hi Rohit,
You are right about bank, you can also see nice setups in smaller banks as well like CSB, IOB, equitas and broking companies, like Motilal Oswal, angel broking.
regards,
Chethan
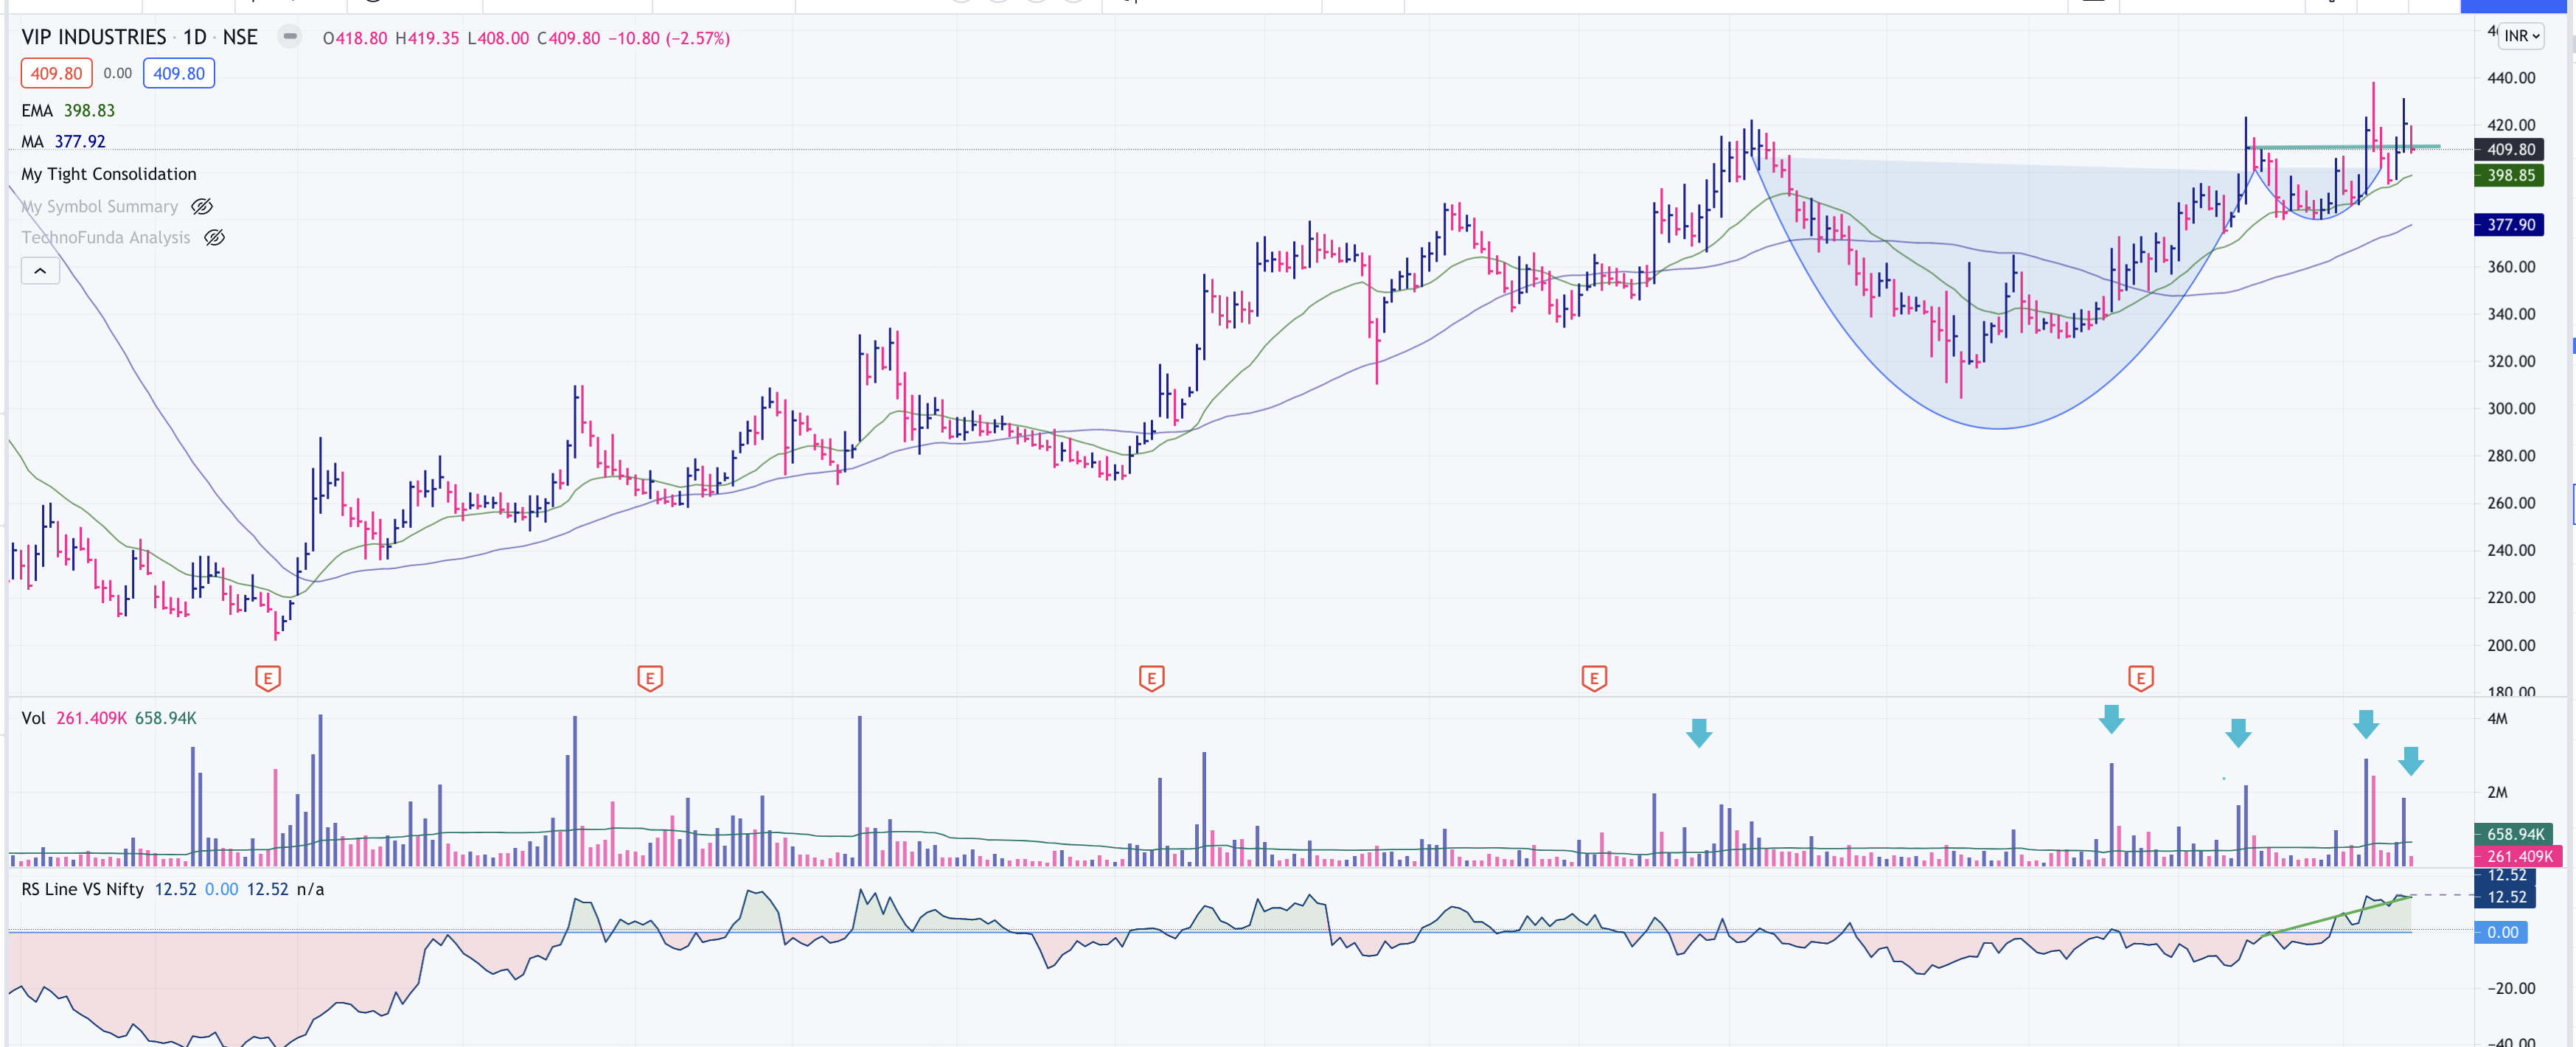
VIP Industries:-
Leader in luggage manufacturing.Poor sales growth in annual and quarterly basis. But as per management commentry company is trying to re-gain the market share.
Nice cup and handle formation, breakout failed . But the stock price is consolidating above 20-day EMA.Volume is looking good.So keeping this under watchlist.
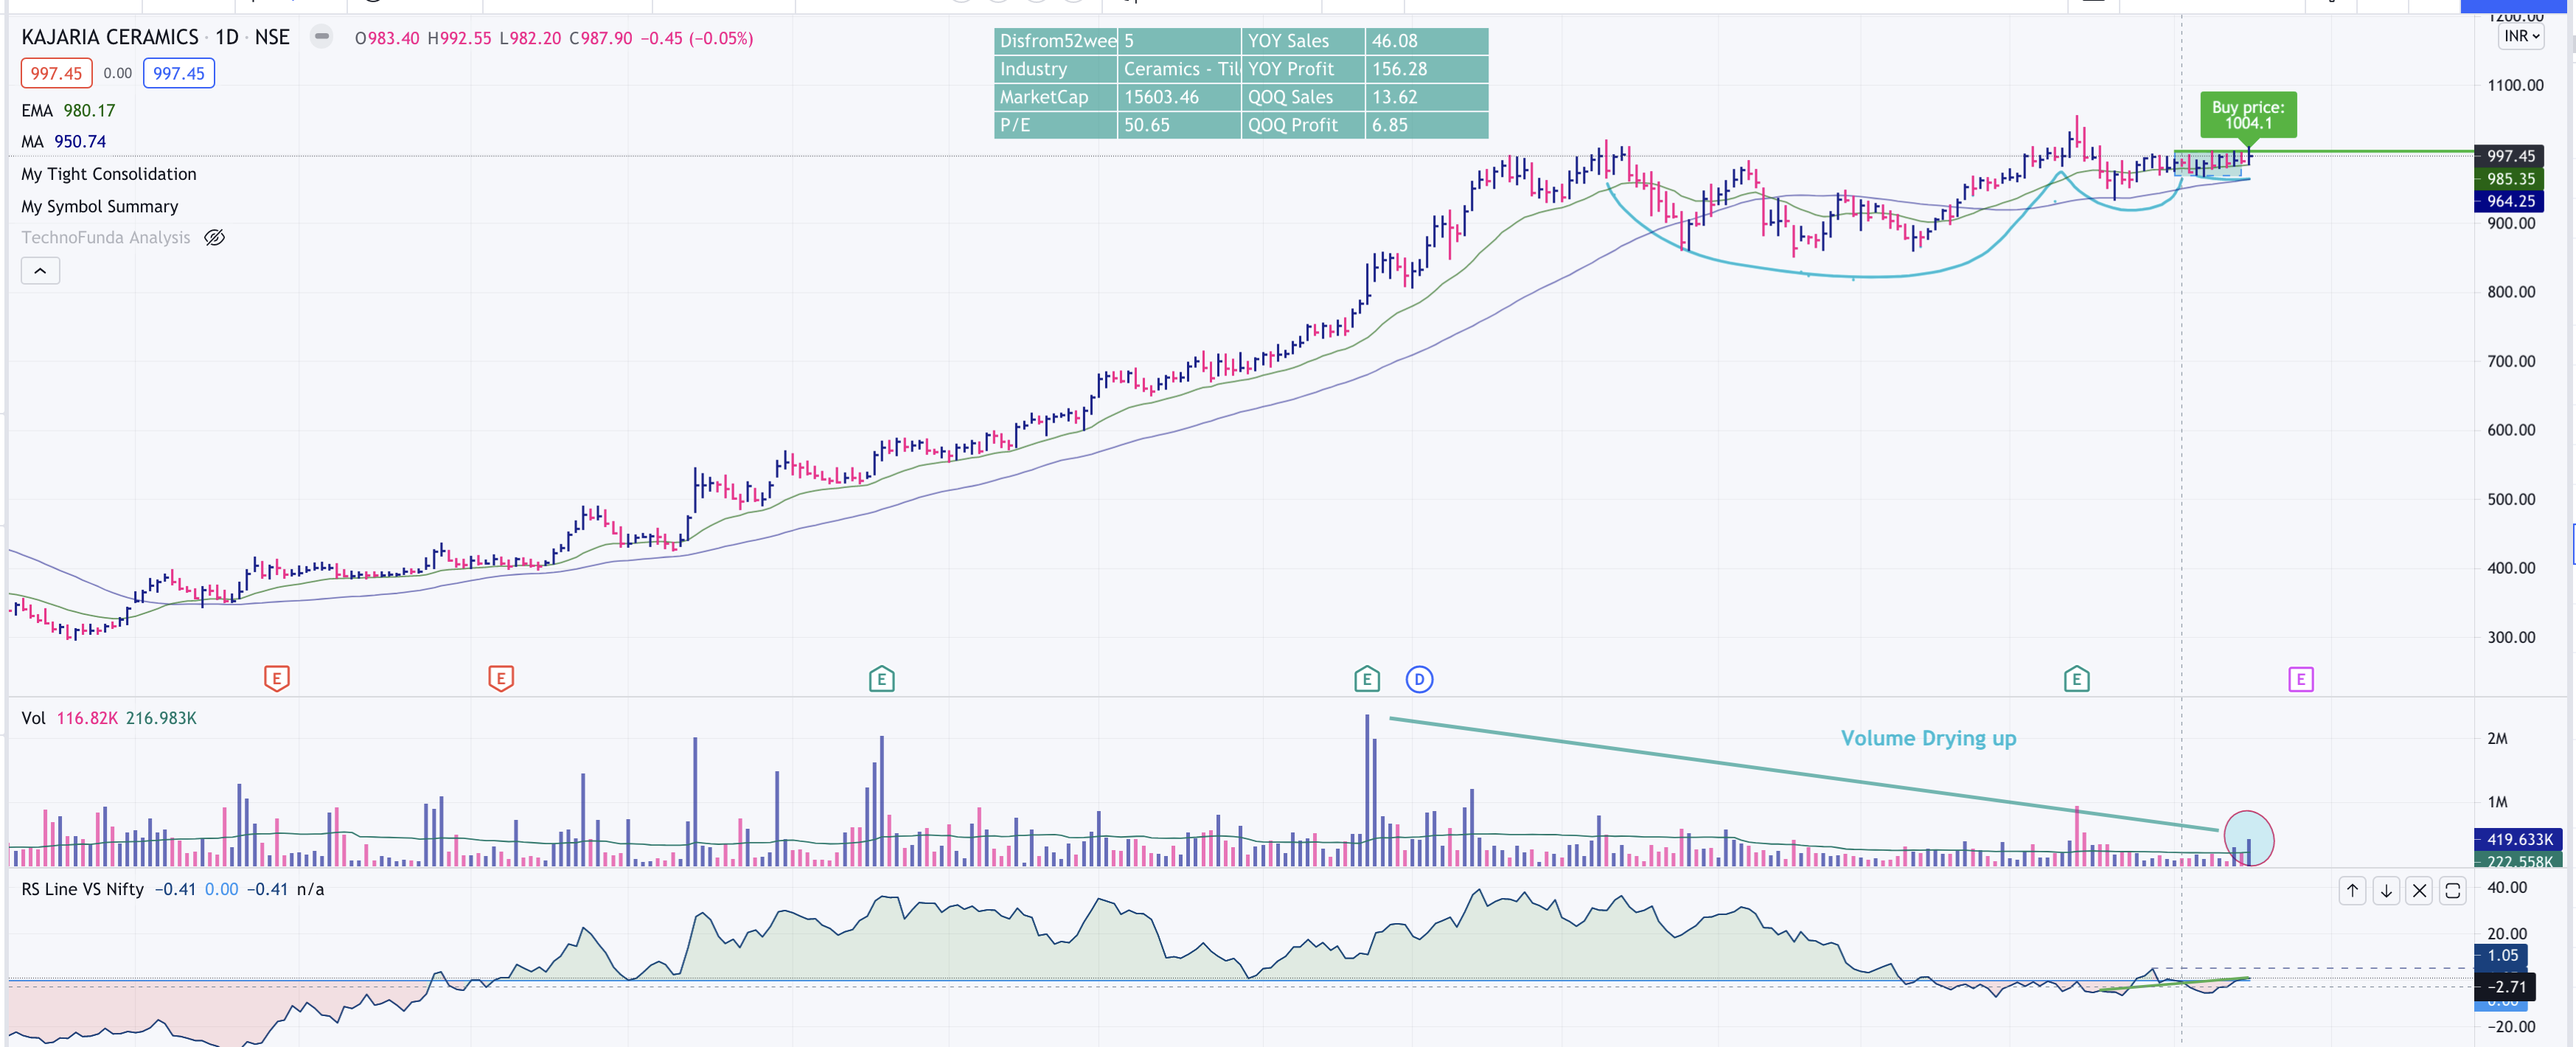
Kajaria Ceramics:-
Leader in the manufacturing of ceramic/vitrified tiles in India.Company has been reporting strong growth in QOQ and YOY results.Price also ran up a lot but now its been in consolidation zone for the 4-5 months.Sector tailwinds are in place, All the top 3-4 players in the same segment are blasting up in both revenues and stock price.The real-estate stocks are showing good relative strength so I think we can continue to play this theme as a proxy to the real estate and affordable housing.
In daily frame, stock is forming a classic VCP characteristic and volume is drying up.There is a good right side development with tight consolidation. Guppy short term MA’s are tightly converging. Price is near 5 -year high.In weekly-> a small cup and handle is forming.
Note:- There is a earnings risk on 27th July
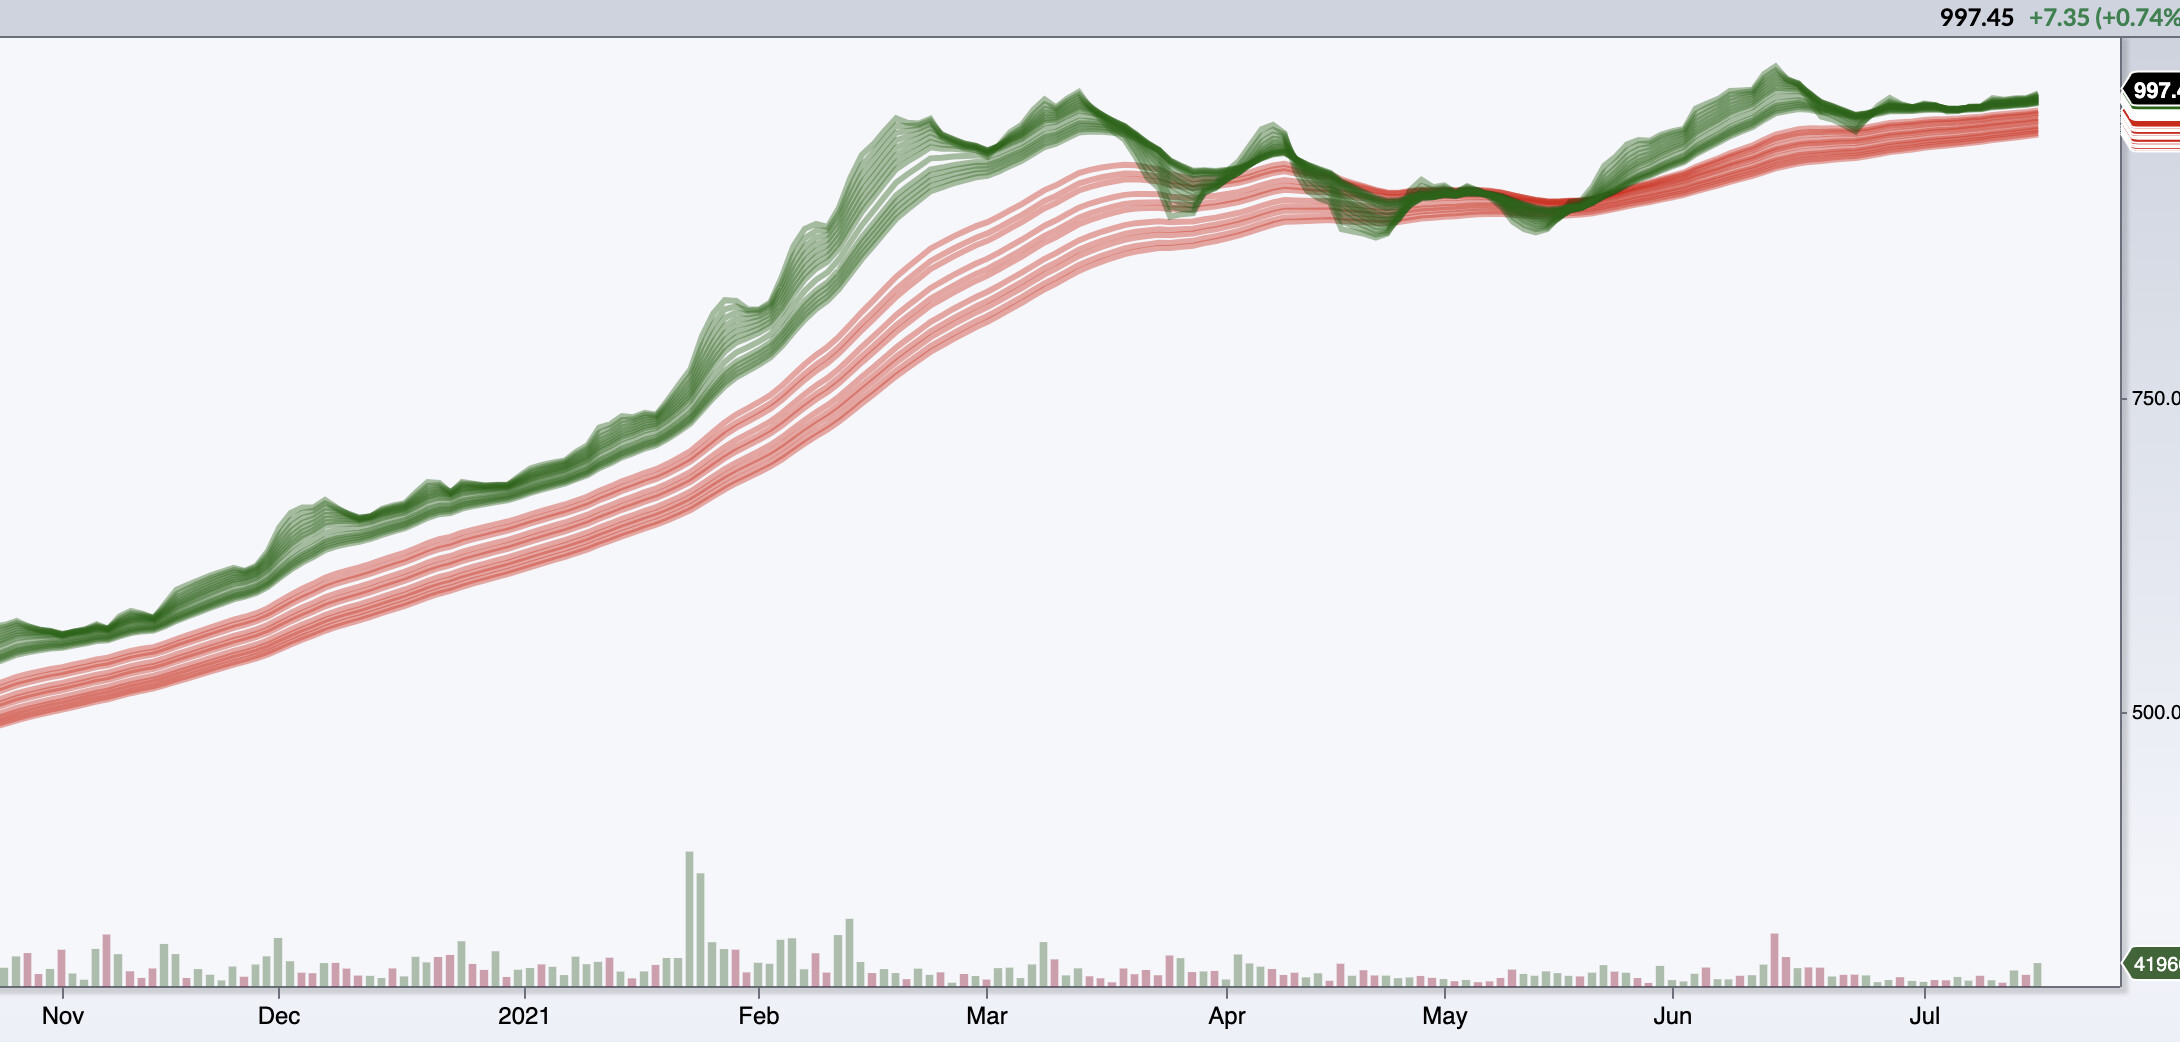
Guppy MA’s:-
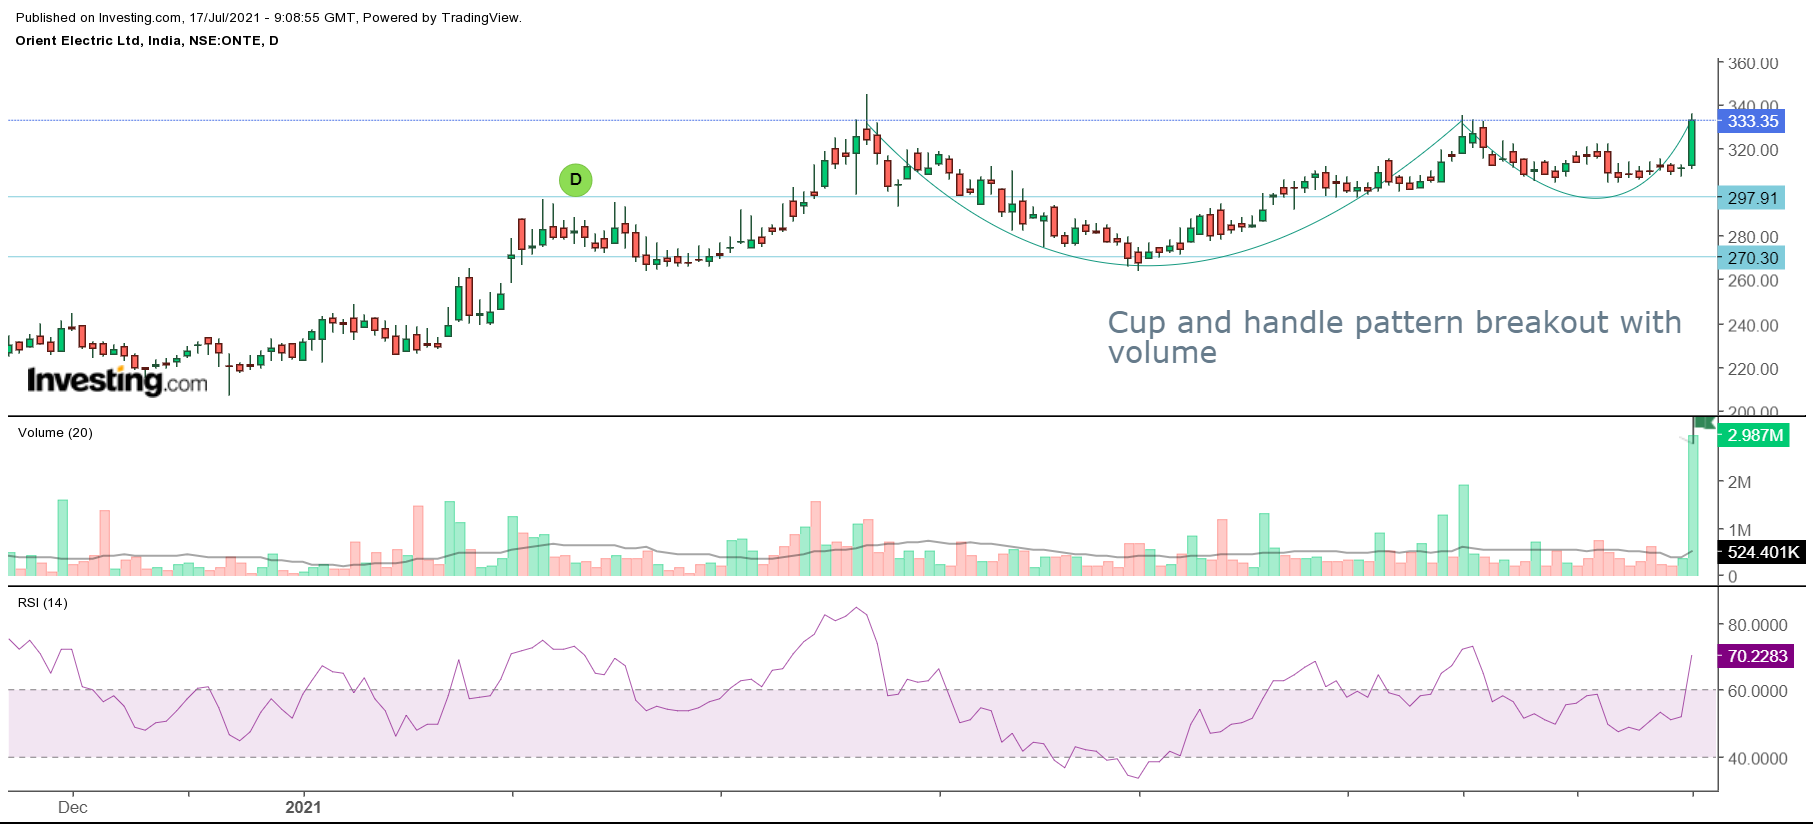
Orient Electric - Cup and handle pattern and possible breakout with volumes.
Hello all,
Attached I can see a rounding bottom pattern on weekly chart for Rain industries, breakout with good volume at neckline. I have a doubt, after the breakout, next candle is red & taking a support as of now at the neckline. Should one wait for another big green candle for confirmation or can enter the trade at this juncture?
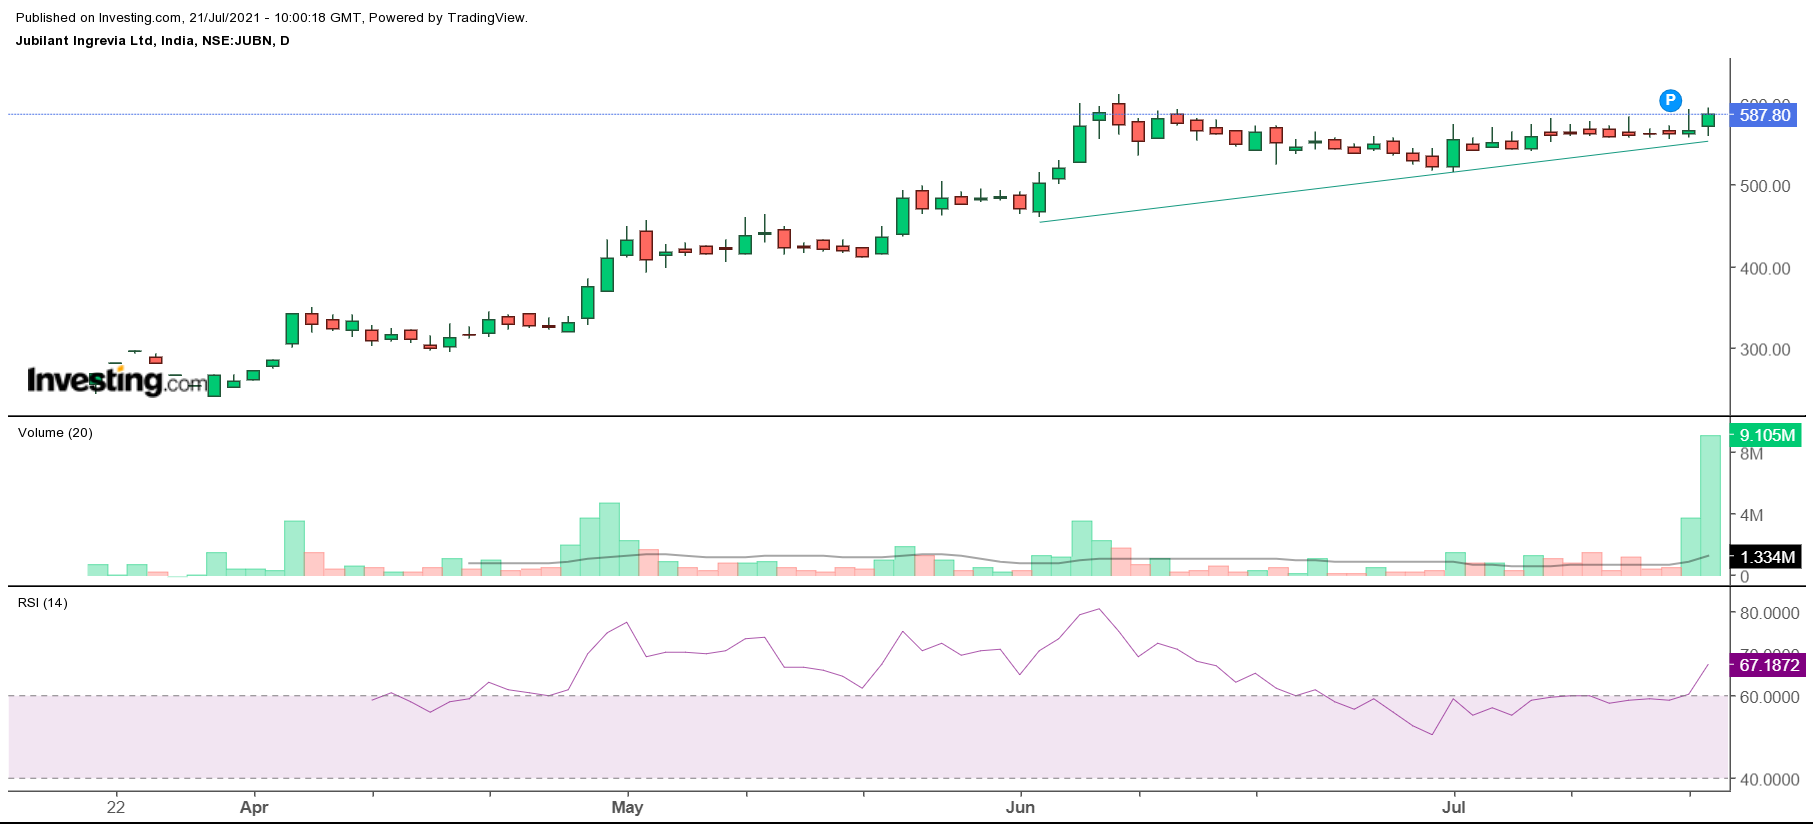
Jubilant Ingrevia Ltd
Published Q1FY22 results, increase in profits and margin. Near 52 week high and taking support. Likely breakout.
No recommendation.
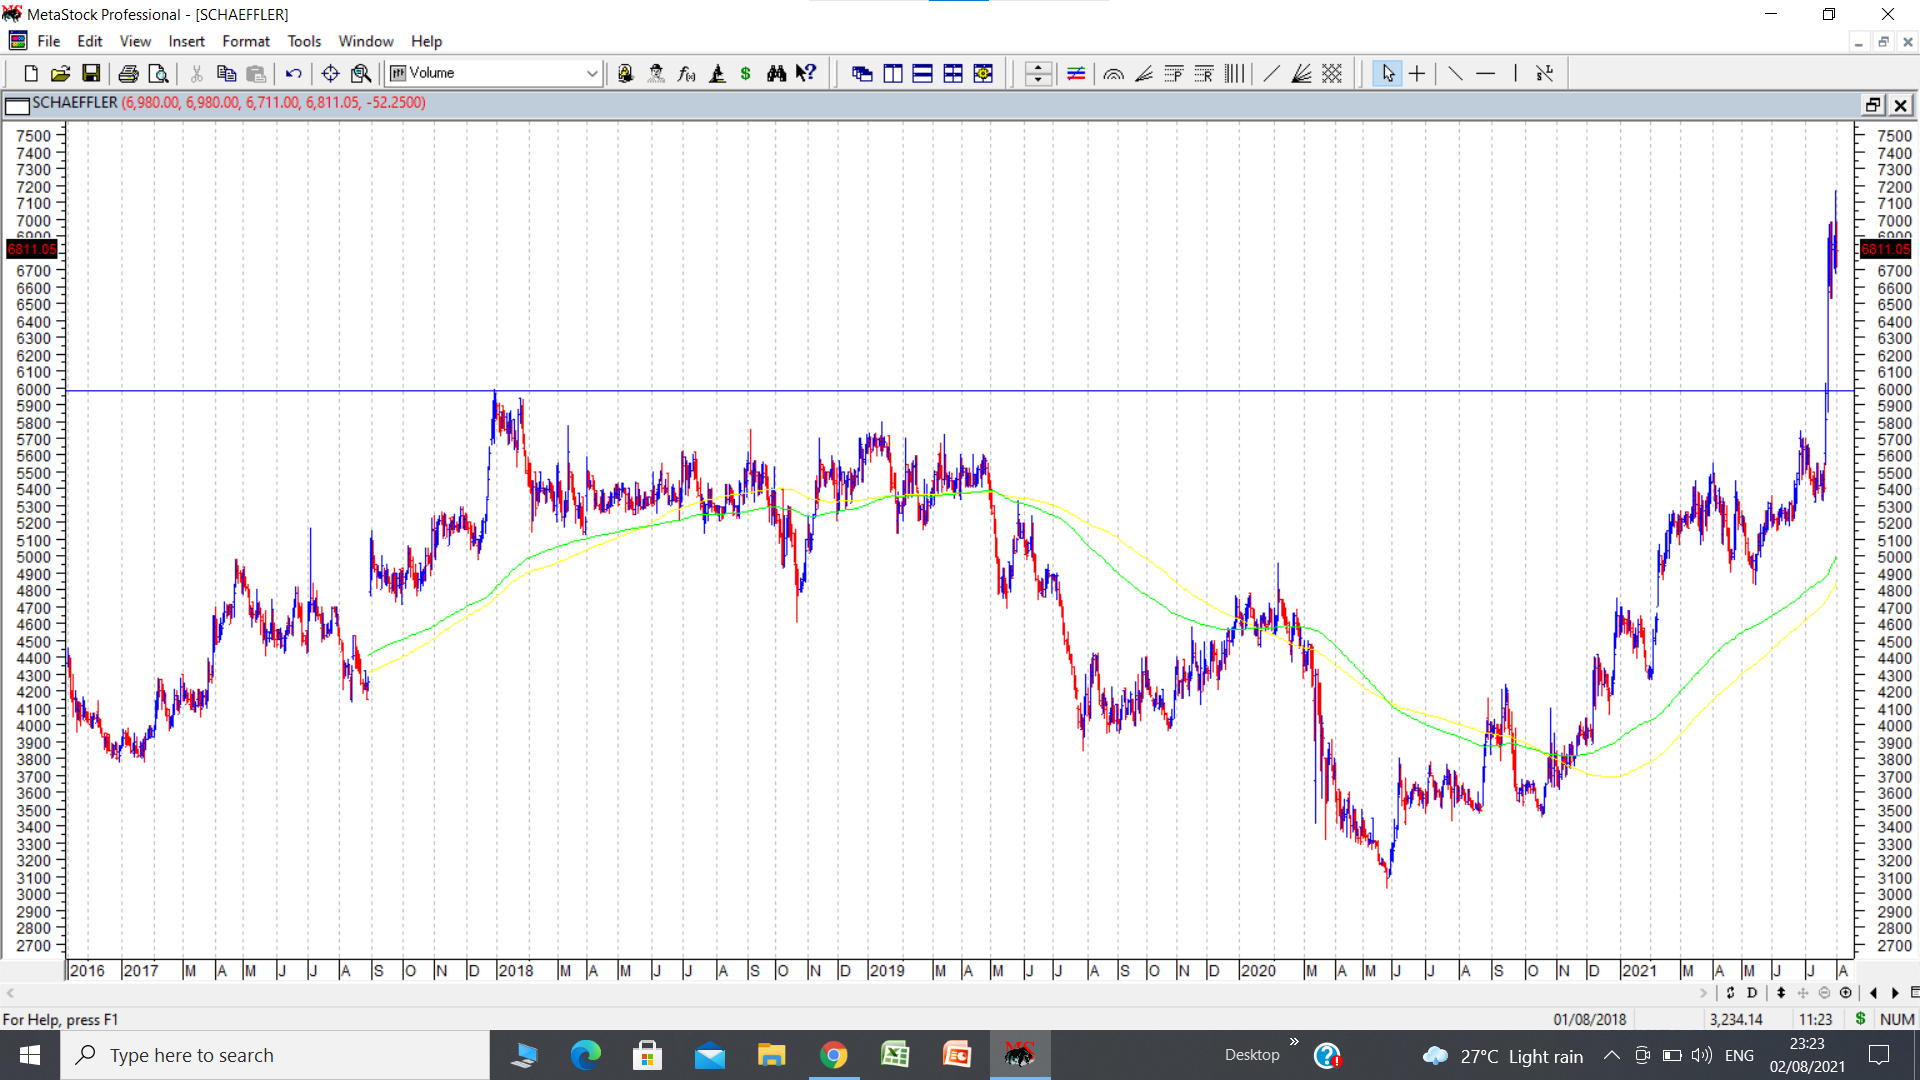
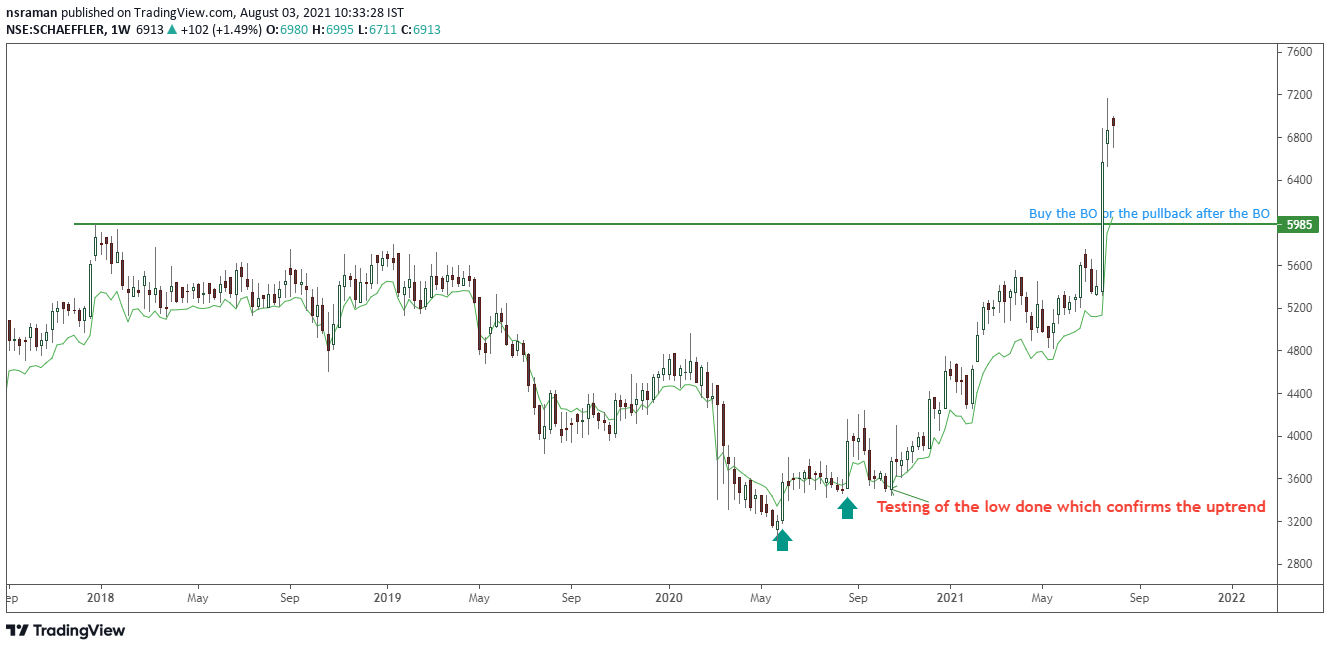
Schaeffler India ltd. Stock price crossed its previous all time high of around 6000 and now seems to be consolidating between a range of 6500-7000. Fundamentally company has been posting good results since past 3 quarters. Some scuttlebutt from interaction with an employee indicates strong tailwinds for the company. Company has established a new facility at Savli besides the existing one at Vadodara Gidc area. The company has sharpened focus on higher margin products. Some names I heard were Ceramic coated bearings which has high realisation.
Seems like a good techno funda combination with improving fundamentals and strong breakout and now consolidation.
disc: invested as a techno funda bet.
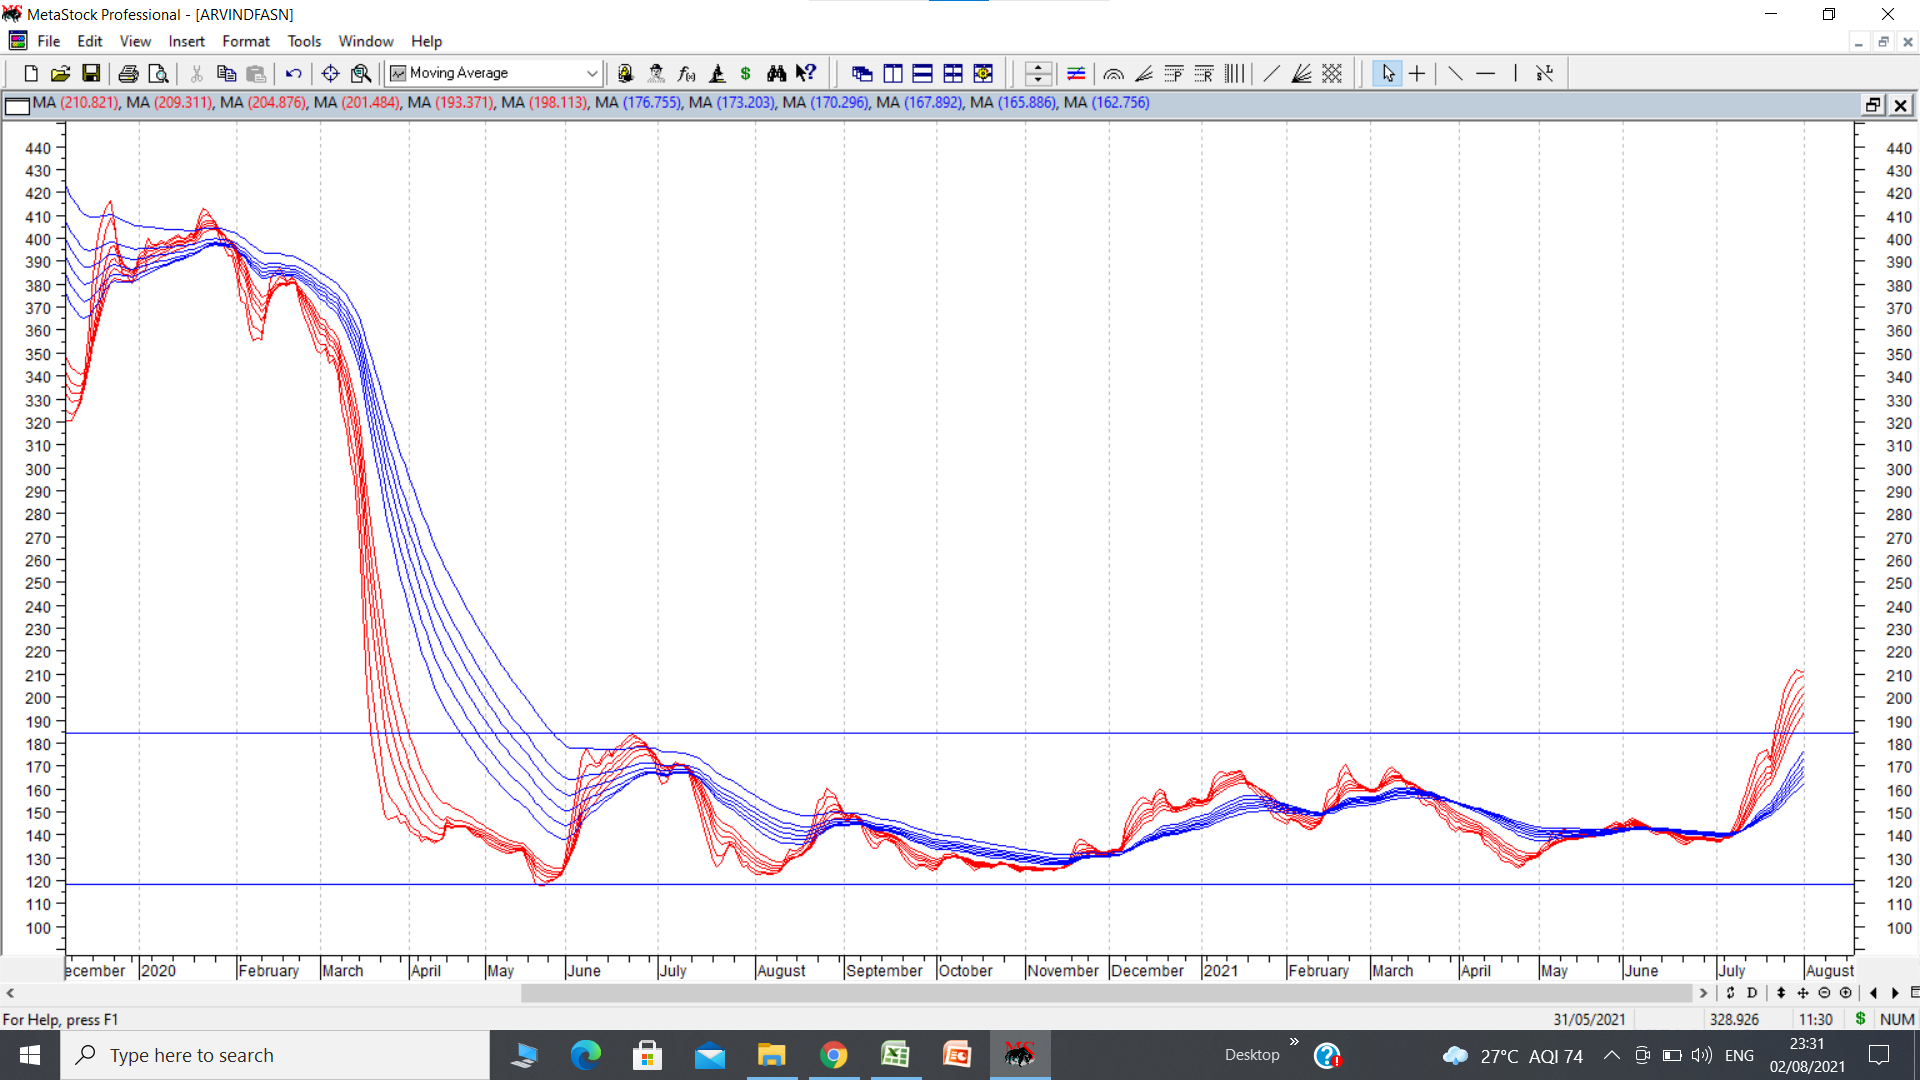
Arvind Fashions Ltd. Stock price has broken out of a 52 week high above 191 and now seems to be consolidating.
Fundamentally anyone considering investment should go through latest annual report. Lots of information about debt reduction, cost reduction, levers of growth etc.
Company has got strong brands in the form of US Polo, Tommy Hilfiger, Calvin Klein, Flying Machine and ladies beauty brand Sephora. These are the focus brands for the company. Company has shut down non performing stores, recently sold off Unlimited brand to V Mart, re negotiated rentals in the wake of pandemic, undergone two rights issues, and induced fund infusion from Flipkart for minority stake into Arvind Youth brands which is a subsidiary which owns Flying Machine brand.
It seems balance sheet clean up, cost control measures etc are now firmly in place. If these start playing out with improving sales and margins, this could be an interesting bet.
disc: invested as a techno funda bet. Idea here would be to scale up allocations as the fundamentals improve. As of now a starter position.
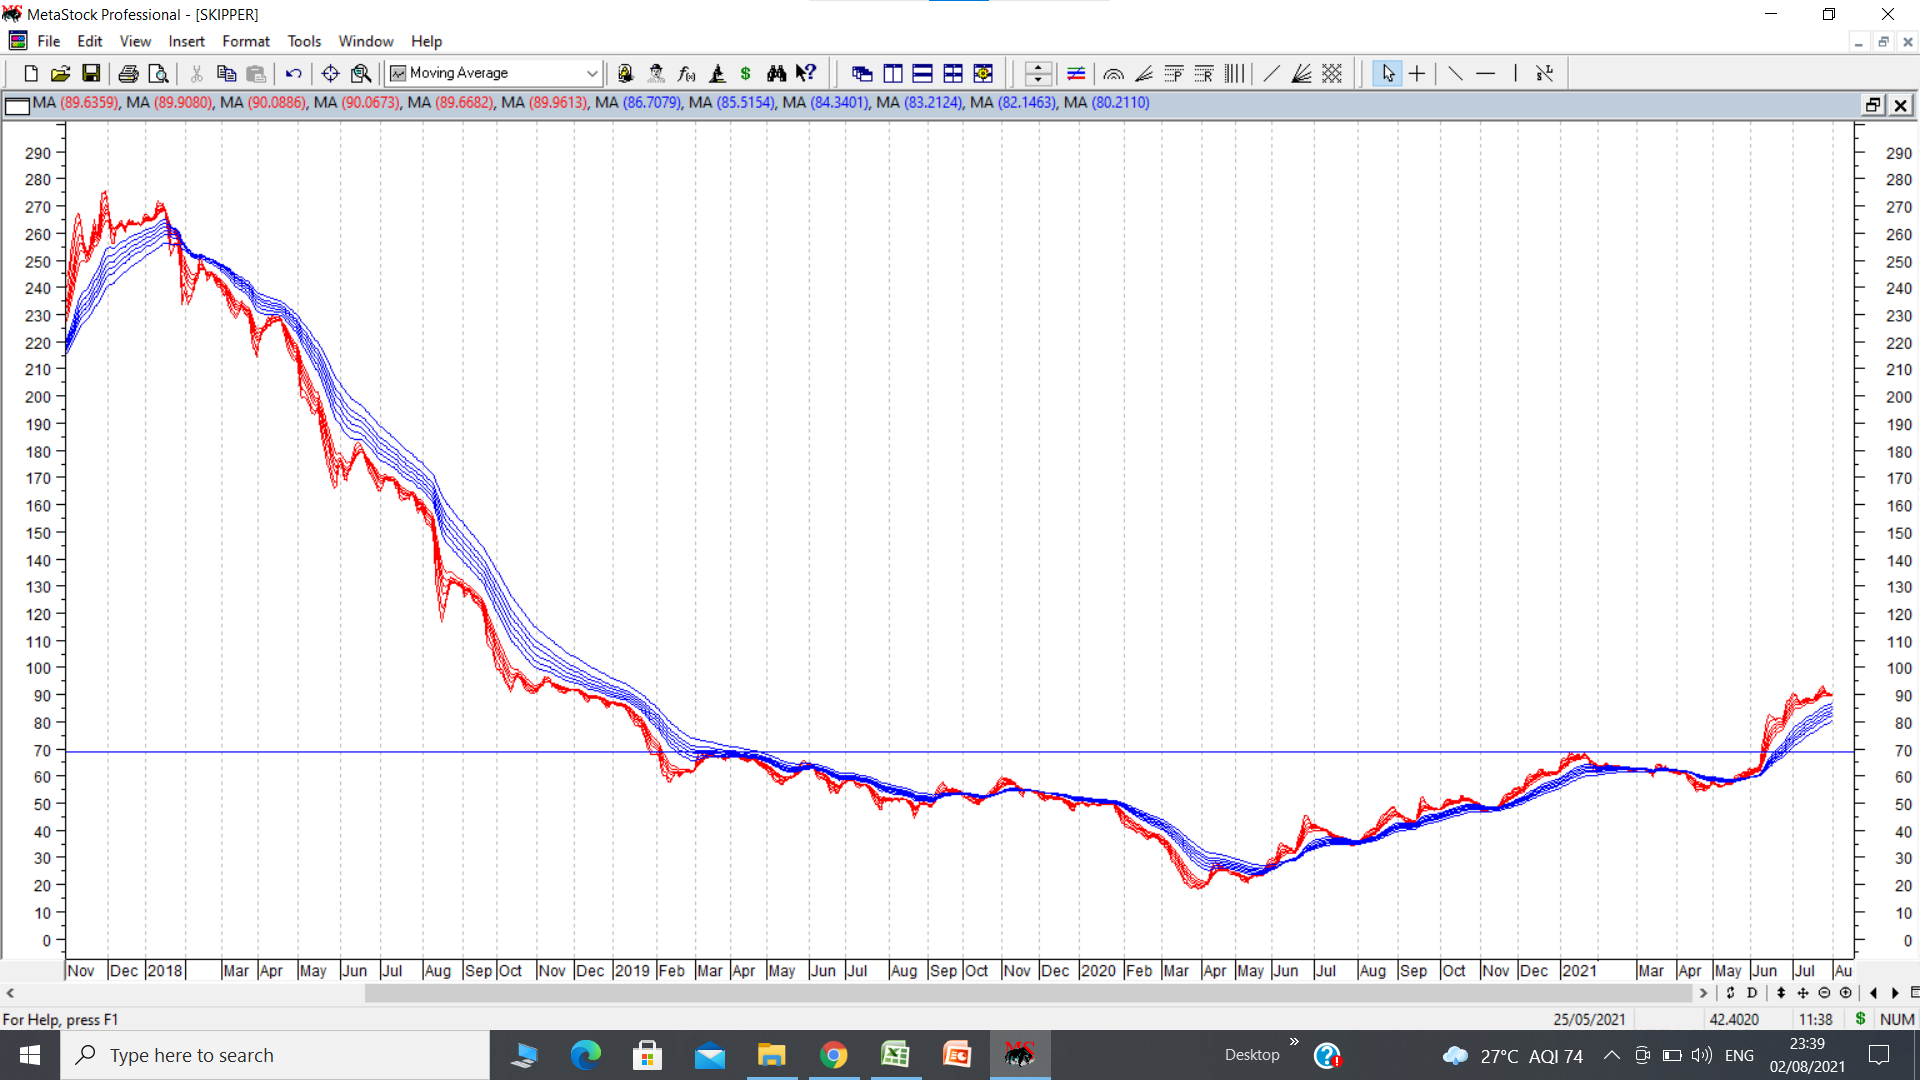
Skipper Ltd. cmp 89. Stock price broke out of an inverted head and shoulders bottom formation at around 74 and now consolidating. Target seems to be 120 plus initially.
disc: no positions, it remains in watchlist.
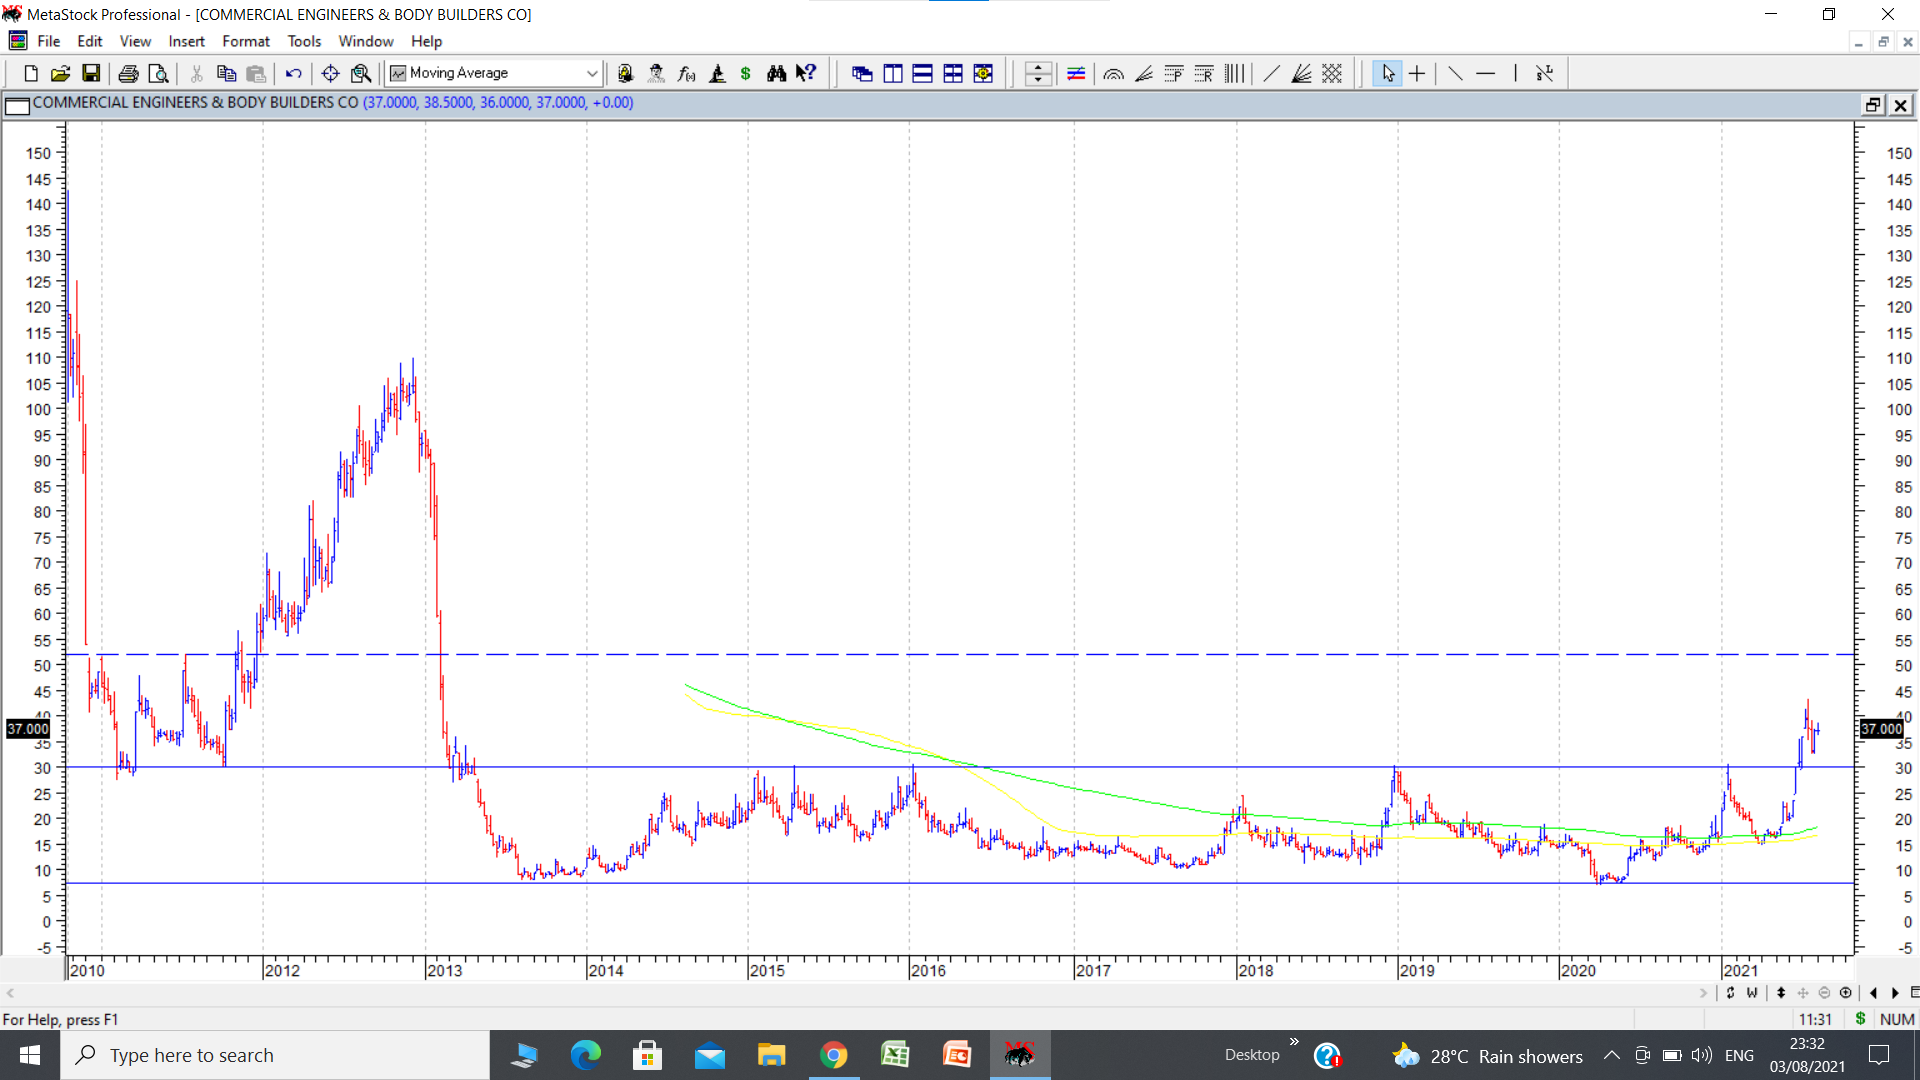
CEBBCO was a much maligned stock for many years beginning 2013. If fell from highs of 142 in 2010, another peak of 109 in 2012 to lows of 6 to 8 a couple of times in the period between 2013 to 2020. But in June 2021, it managed to cross its 8 year high of 30 and has till now remained above that level now for almost 7 weeks. Such multiyear range breakouts often provide good winners.
disc: in watchlist. No position as of now.
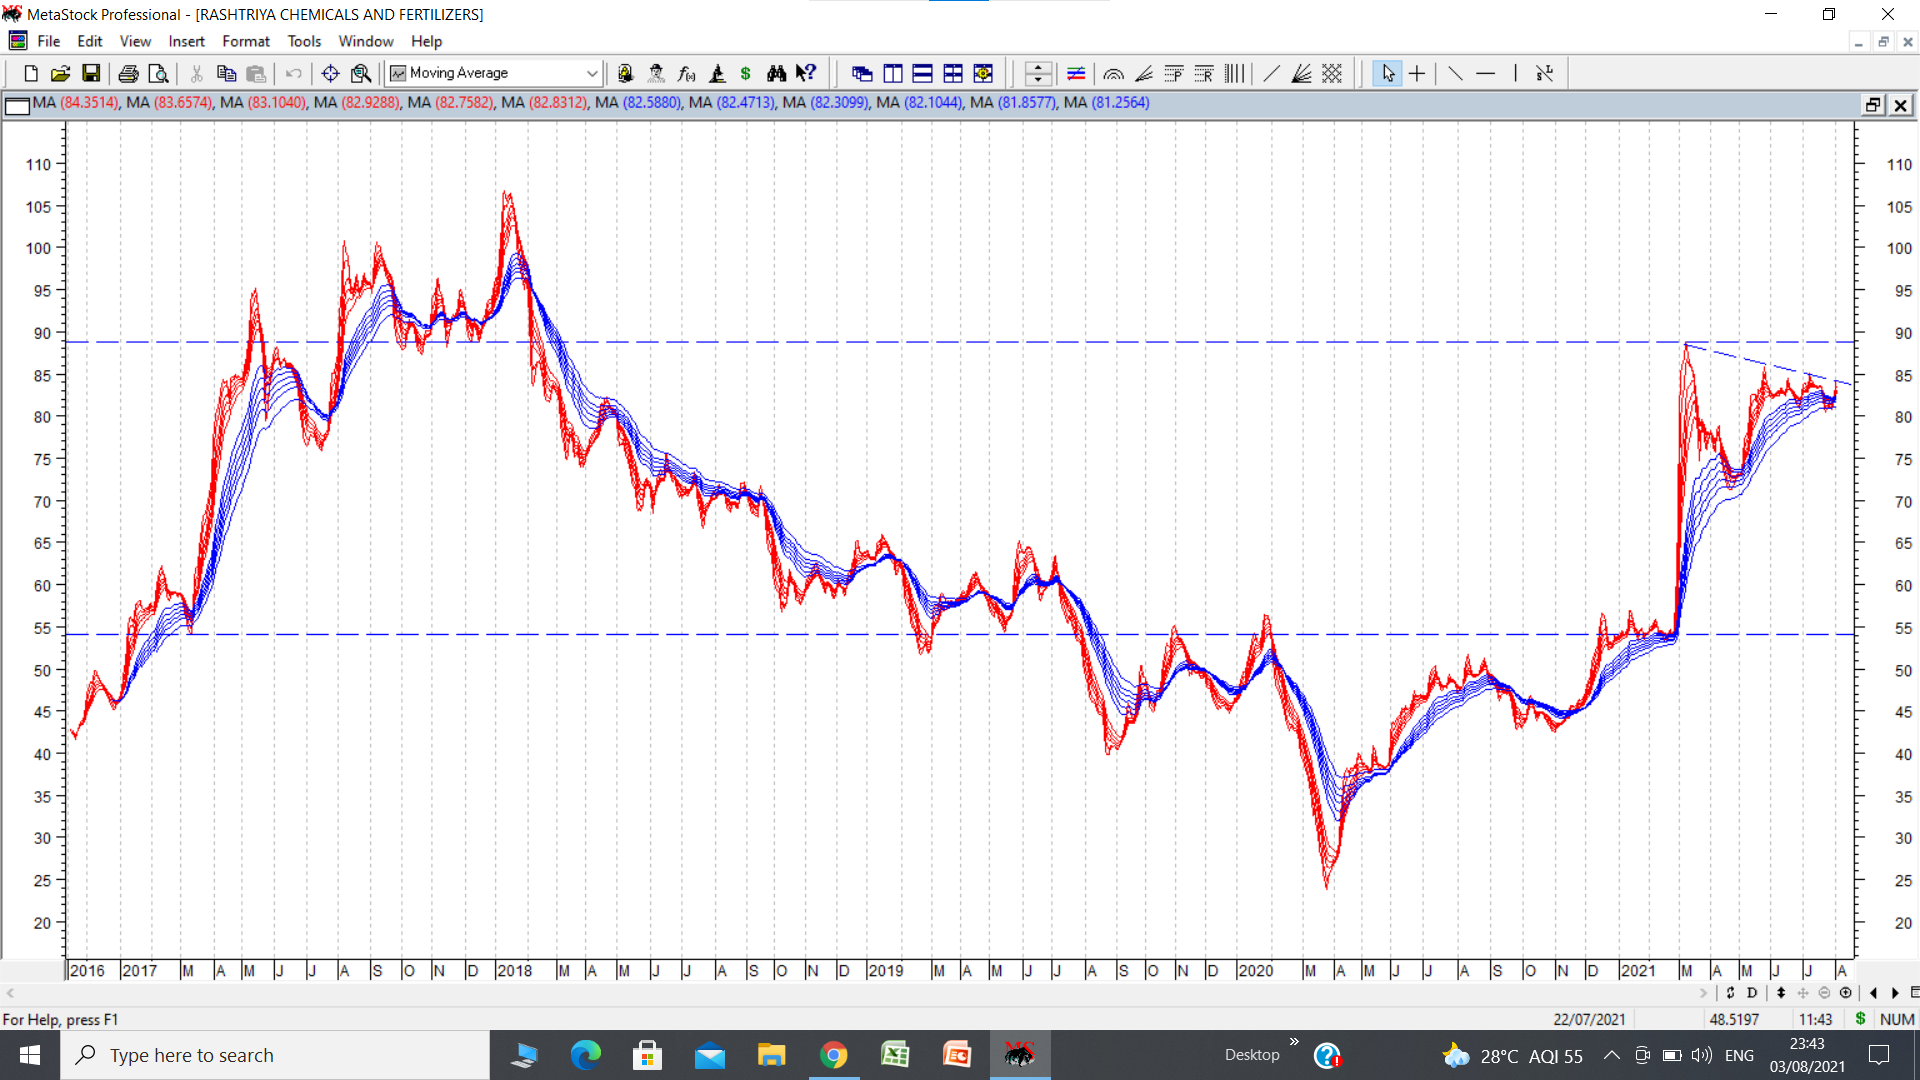
RCF is a govt fertiliser company. The chart shows compression of short term moving avgs in red. Post its rally from 53 to 91 within 5 days in March 2021, it has been under sideways consolidation between broad range of 70 to 90. A flag like pattern is marked in chart depicted by dotted lines which extends between 55 to 88 in this GMMA chart. A successful breakout from this pattern can provide targets of 110 plus. Fundamentally balance sheet has a much better look to it with receivables going down drastically and company reducing debt and increasing cash. Plus whenever upmoves materialise the all too familiar story of its valuable real estate in Mumbai starts doing the rounds.
Next chart shows an even more interesting pattern on a slightly longer term time frame.
disc: bought recently as a techno funda bet.
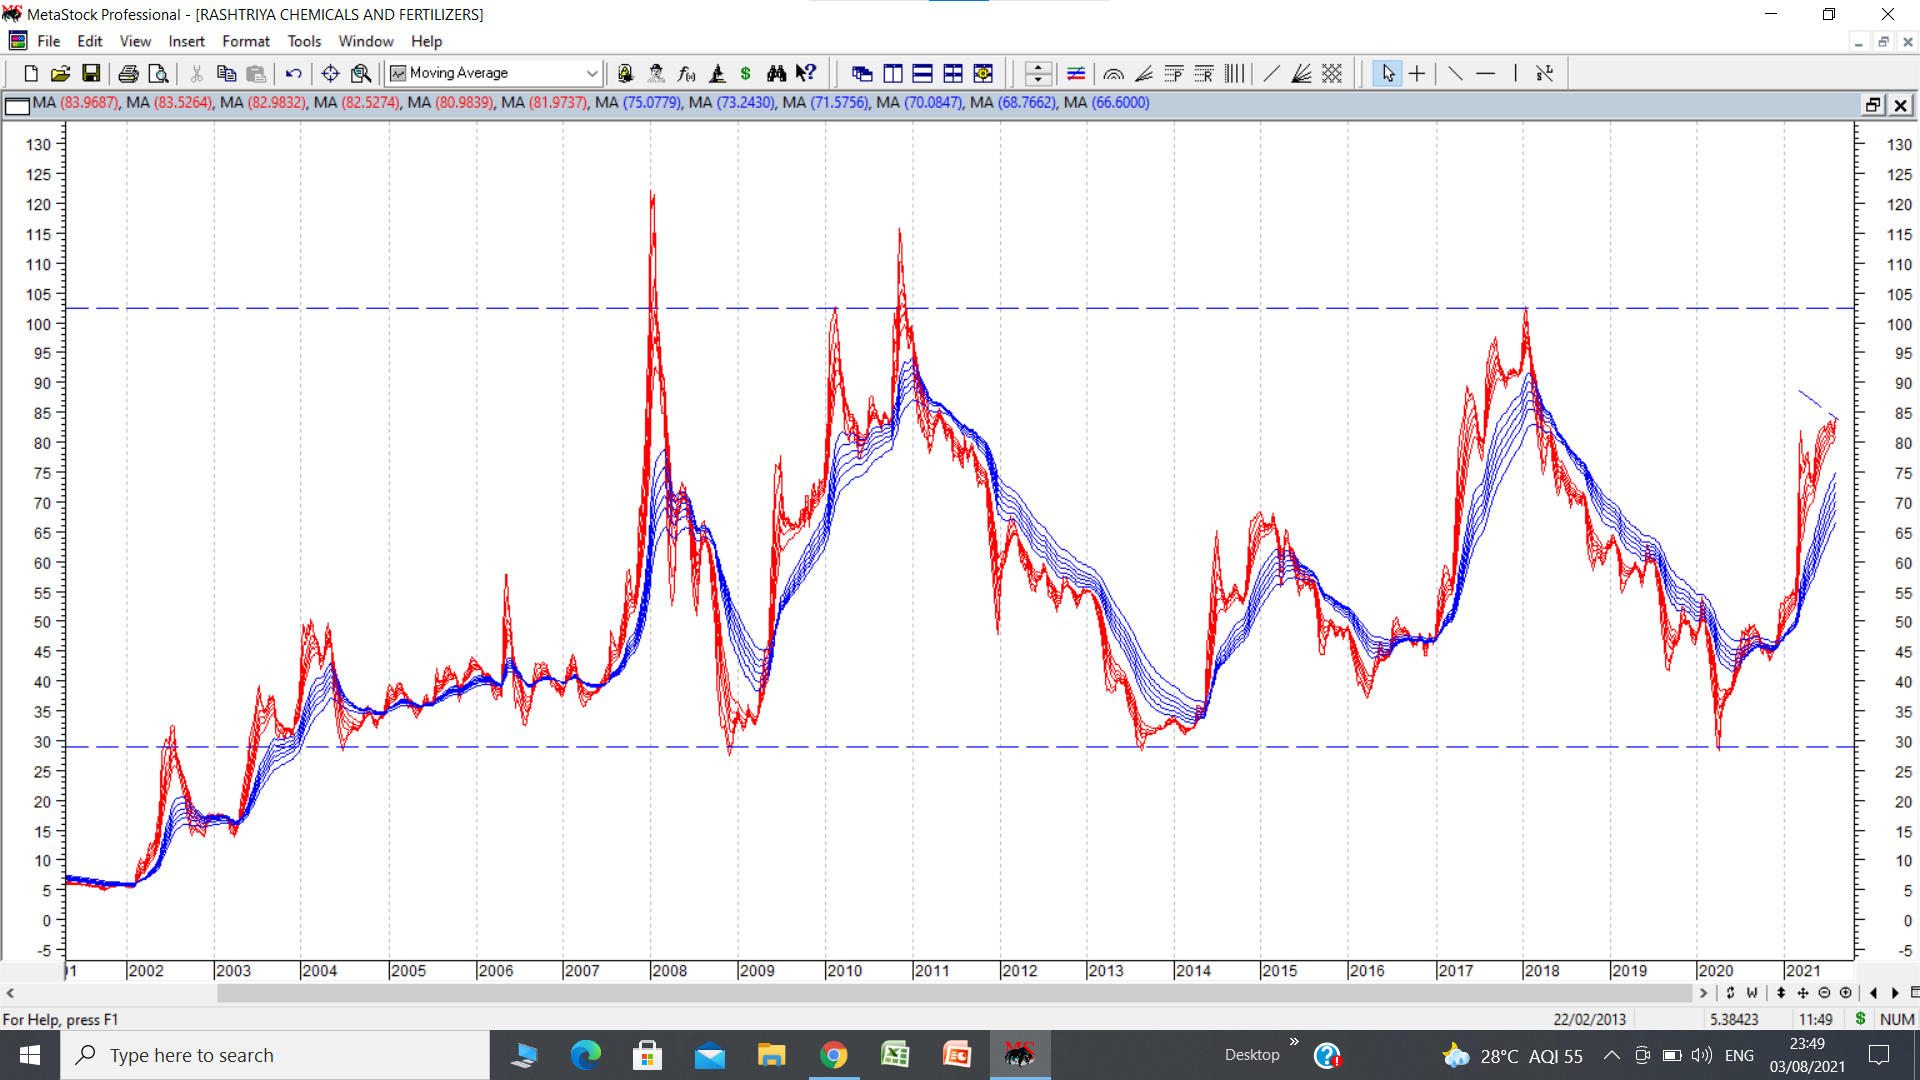
Weekly chart of RCF using GMMA shows a clear double bottom pattern which gets confirmed on a strong move above 105. If the daily pattern described in previous post plays out and stock price crosses levels of 105, we can be looking at a successful breakout from a double bottom pattern with bottoms at 30 and breakout levels at 105. (distance of 75 rs) Adding the pattern distance to breakout levels provides target of 180. But since this is on weekly time frame, one will need to be very patient, first for daily pattern to play out and then keep holding for weekly pattern targets.
PS. I had seen a similar pattern work out in daily charts of IB real estate chart. I first got in due to a possible rounding bottom pattern along with management change and I had seen a possibility of double bottom breakout. Now with real estate sector in focus it has become interesting.
@hitesh2710 sir I couldn’t found any retest after breakout in all three stock, All I wanted to know is. Is retest inevitable? Or we should not consider them when we see strong move like in schaffler
Hi Sir,
This is the strategy I follow
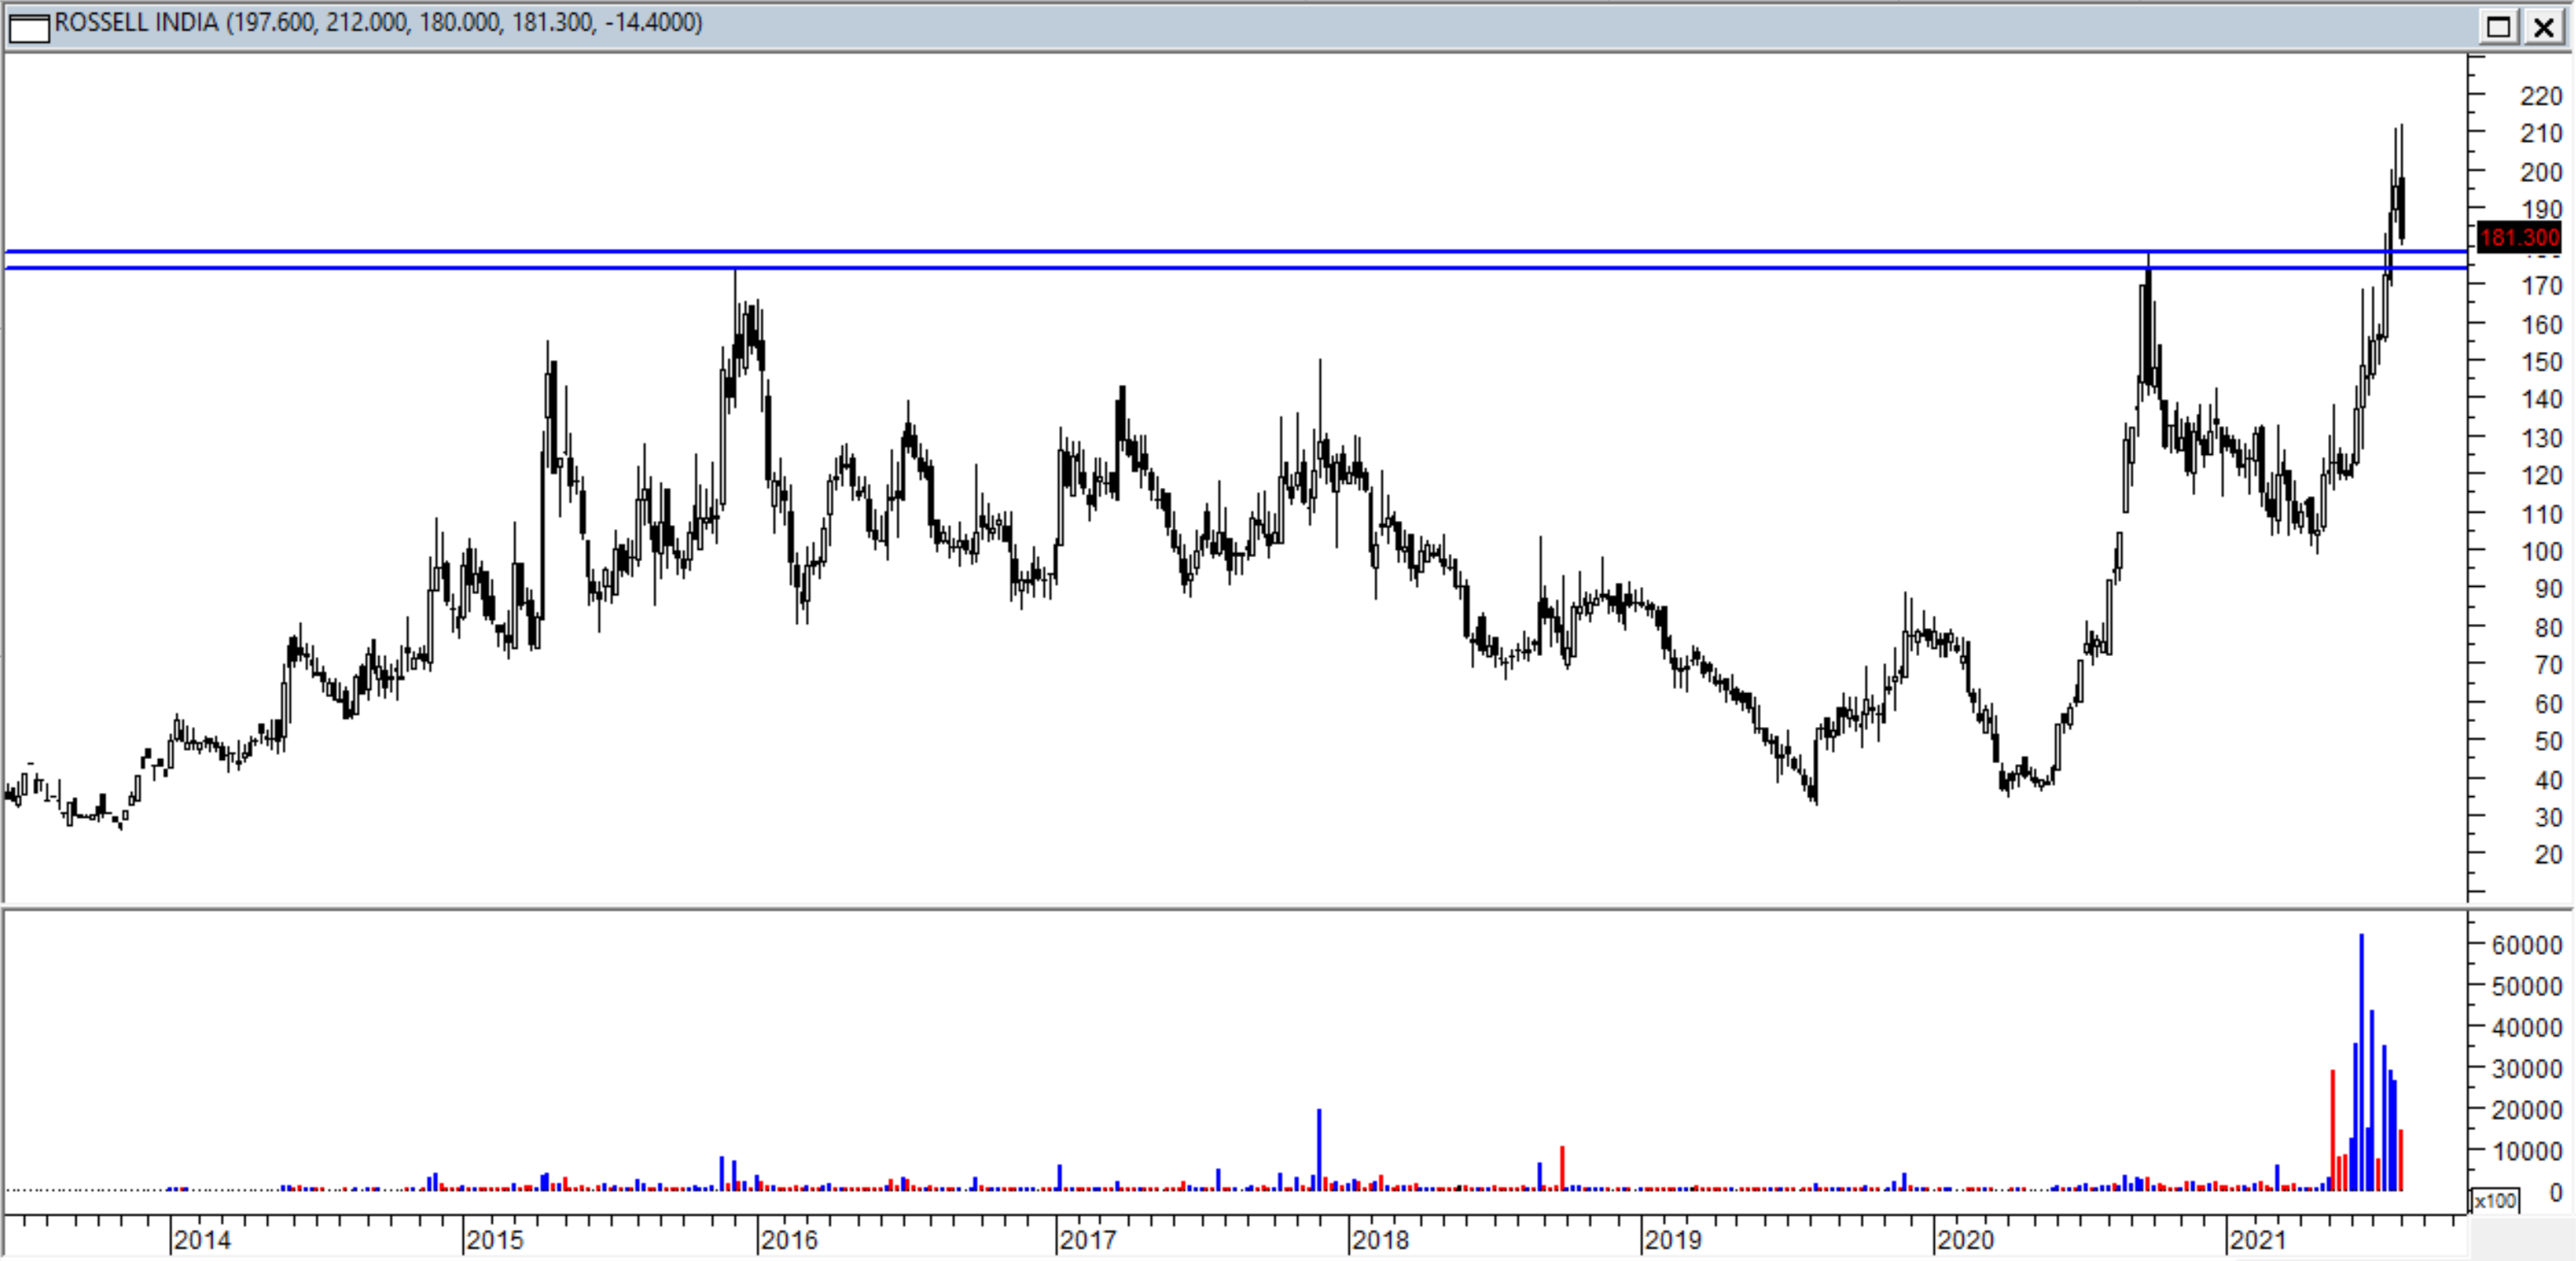
Rossell India has a nice Cup and Handle over last 6 years. There was a breakout with heavy volumes and now there is a retest of breakout zone.
Hi can you pls elaborate on “Testing of the low done which confirms the uptrend”. How does one decide that low is tested and be convinced of uptrend?
Stocks retesting their previous breakout levels is not something that is always seen. Sometimes if the momentum is strong enough, then stocks break right through resistances and achieve their targets.
Its difficult to figure out which ones are going to go straight up and which ones are going to come and retest breakouts.
So the idea should be to buy as close to breakout as possible, or even better, buy before major breakouts where there are smaller consolidation patterns just below major breakouts. These smaller consolidation patterns can take the form of flags, rounding bottoms, short term range breakouts etc.
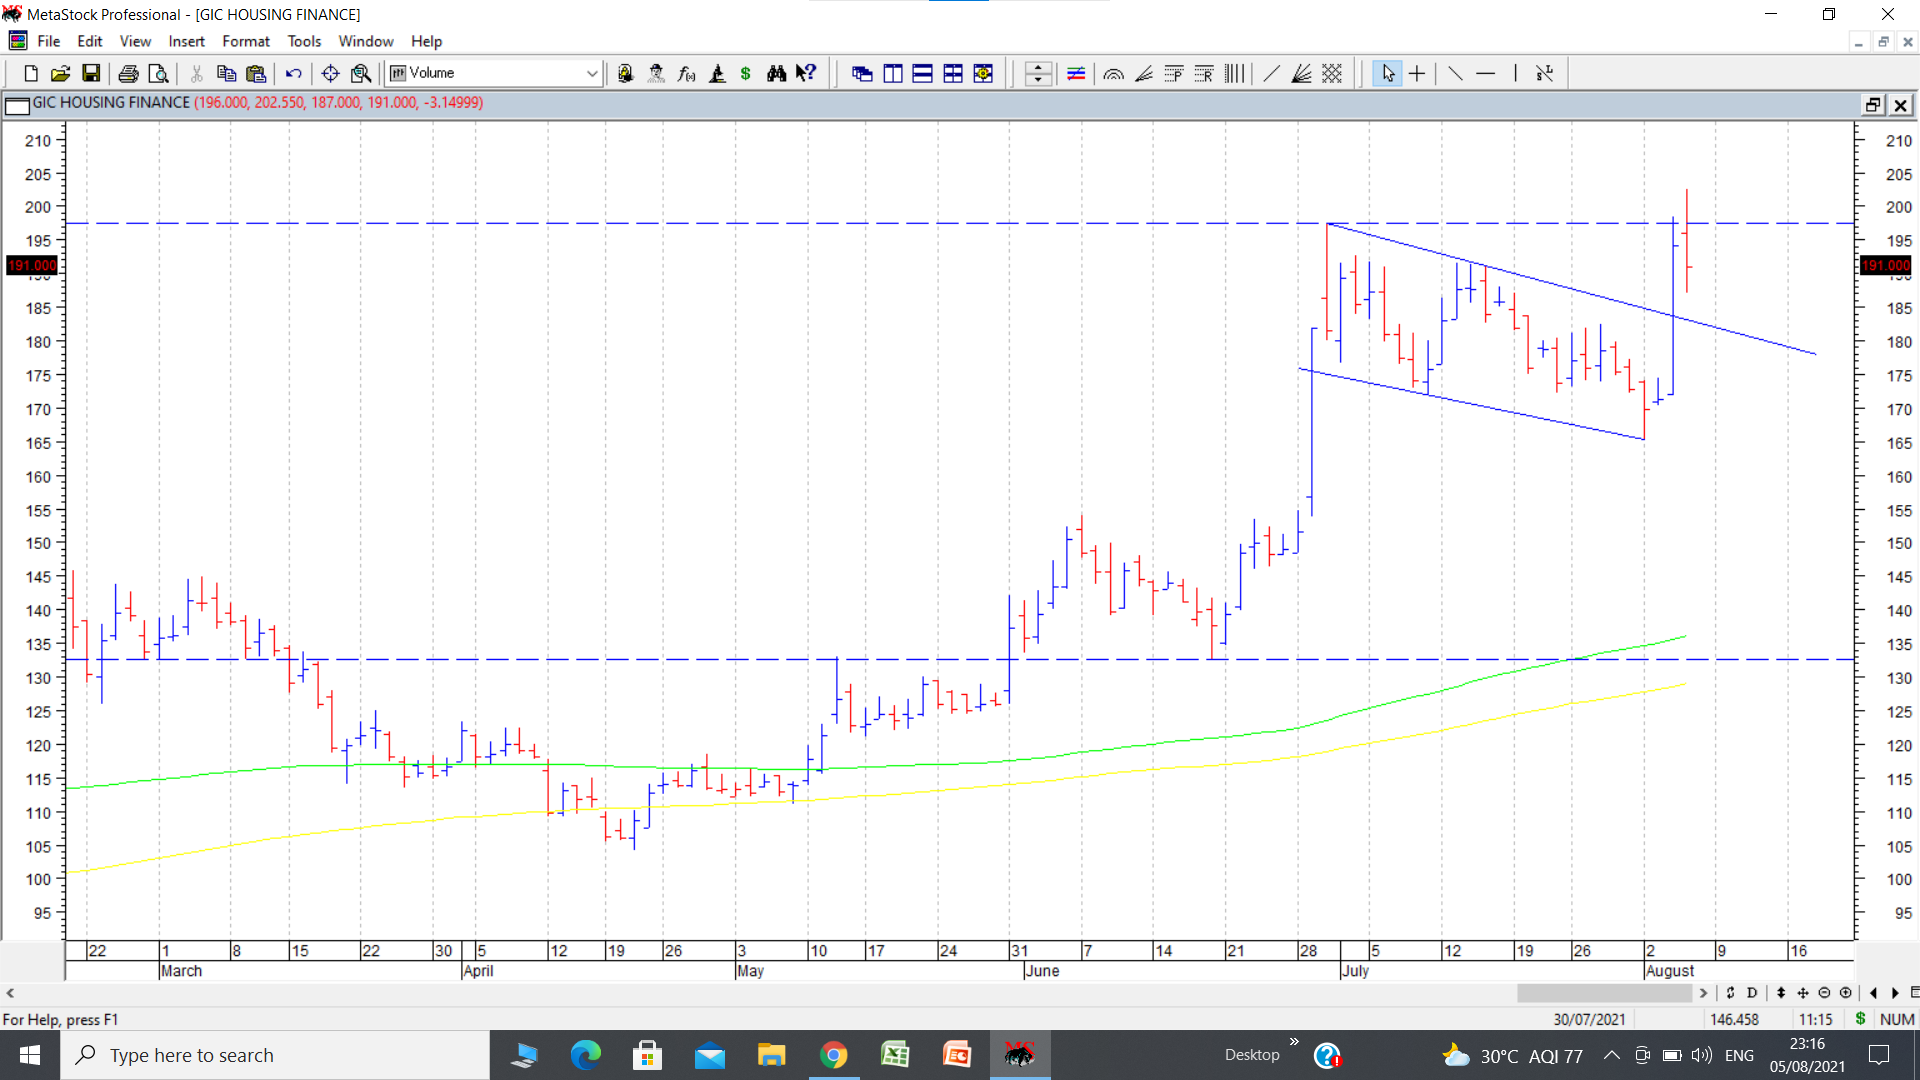
GIC Housing Finance. Covered earlier in this thread as a cup and handle breakout candidate. Some of those targets are achieved. Here the chart shows a flag breakout. The pole extends from 132 to 197, a height of 65 rs. Breakout point is around 180. Adding the height of flagpole to breakout point gives the target as 180 + 65 = 245. Results are on 11th August. That should be a key time to watch.
disc: invested from lower levels as per disclosure in earlier post.
If you see the chart , look at the low of the second big candle ( second up green arrow) which closed above the green line and compare that low to the subsequent low before the upmove. It is indicated by way of arrow above the red text. Draw a horizontal between these 2 points and you will see the support.
And what is the green line indicator used here please ?