Amazing how similar patterns play out, and then news follows:
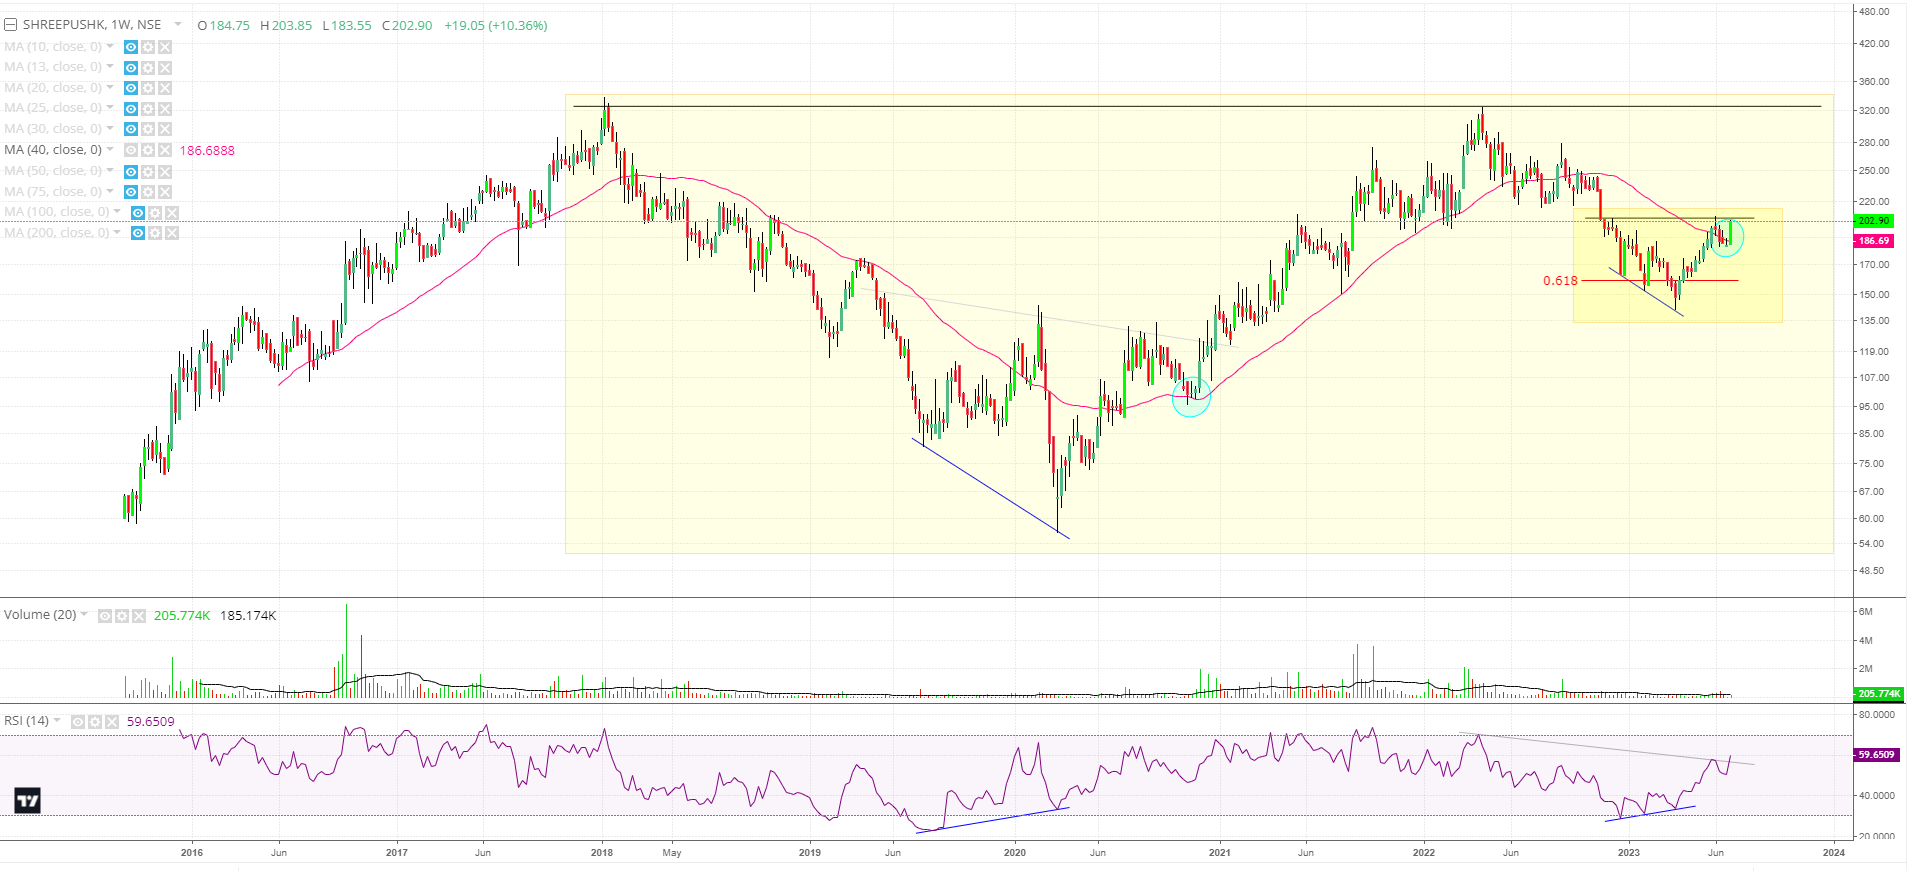
The Smaller Yellow Box is forming a similar pattern to the Bigger yellow box. A Bigger Cup base and a handle like formation on both the small setup and the big setup.
The smaller box and the bigger box formed a Positive RSI divergence and reversed.
The reversal came post upmove from the RSI divergence and turning of the 40MA weekly.
Currently the jump comes in from 40MA weekly.
Fibo 0.618 sustained after given a shakeout below it.
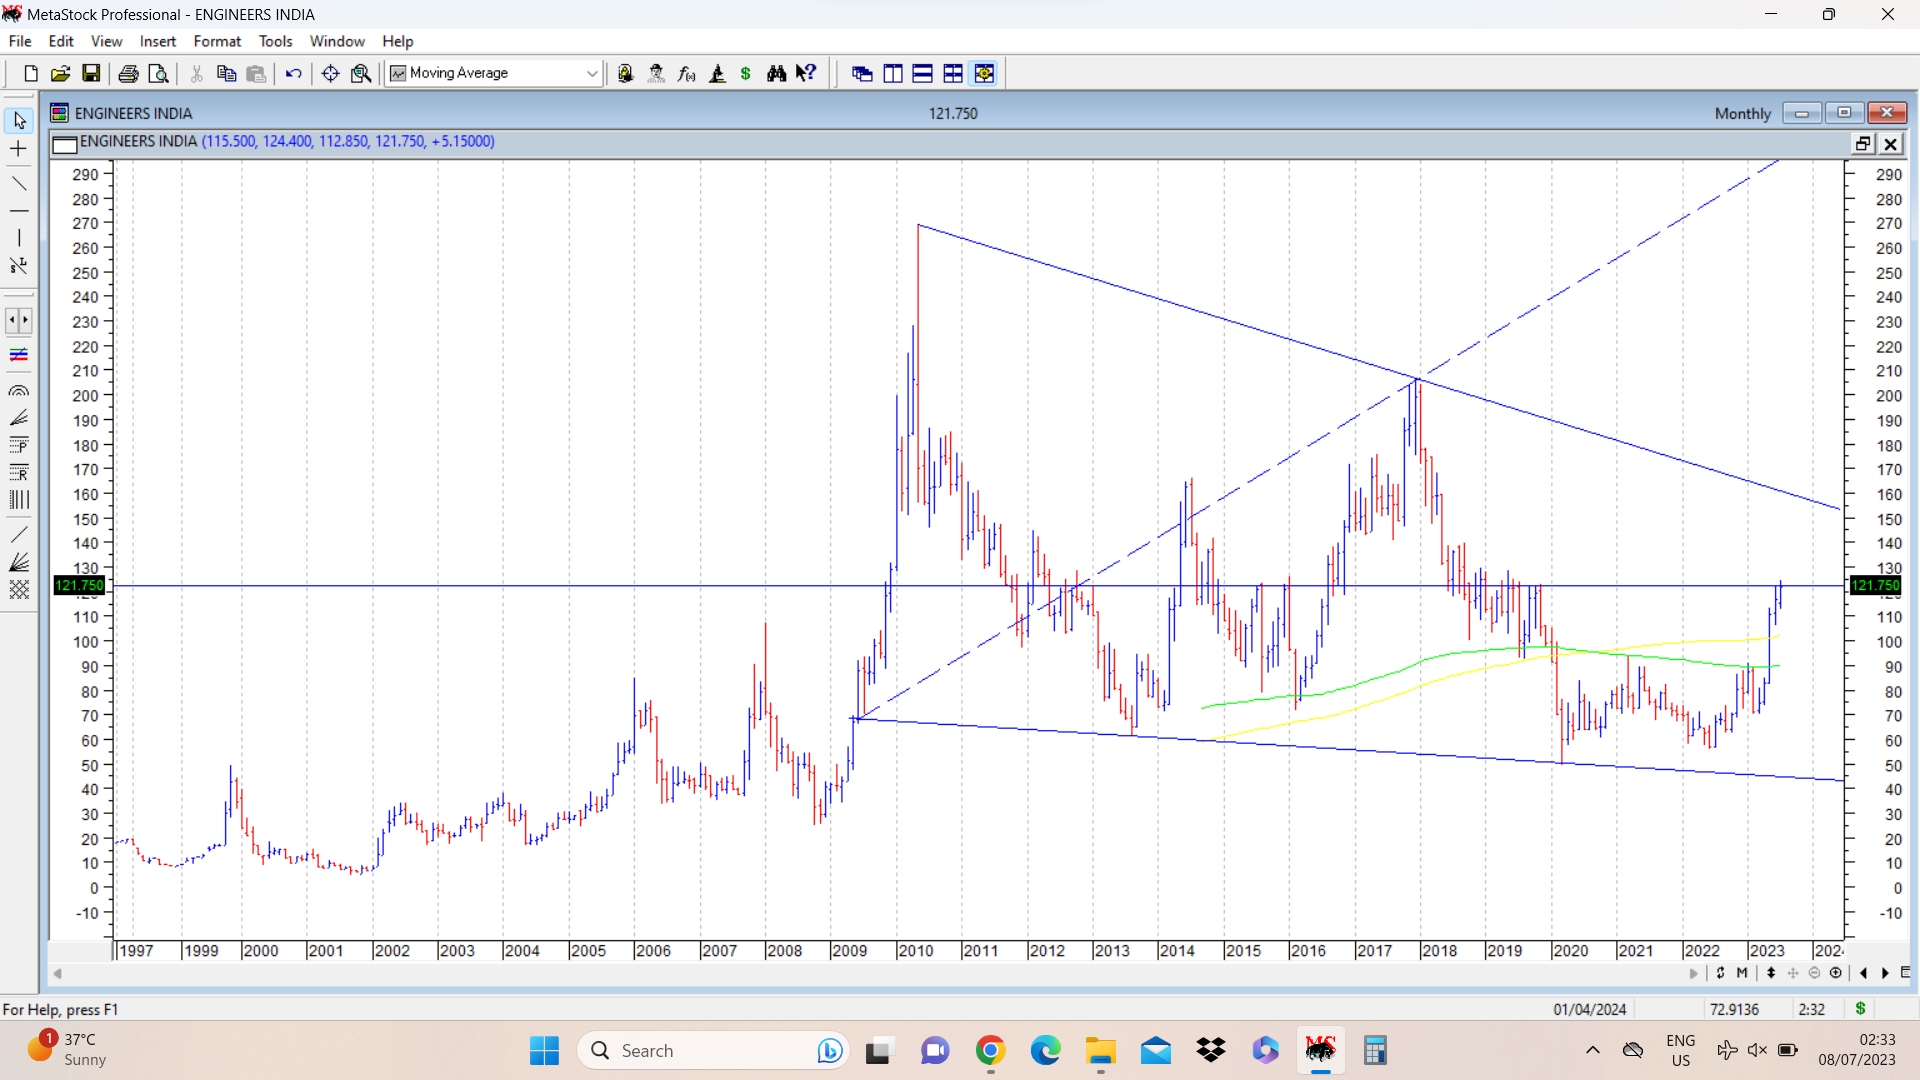
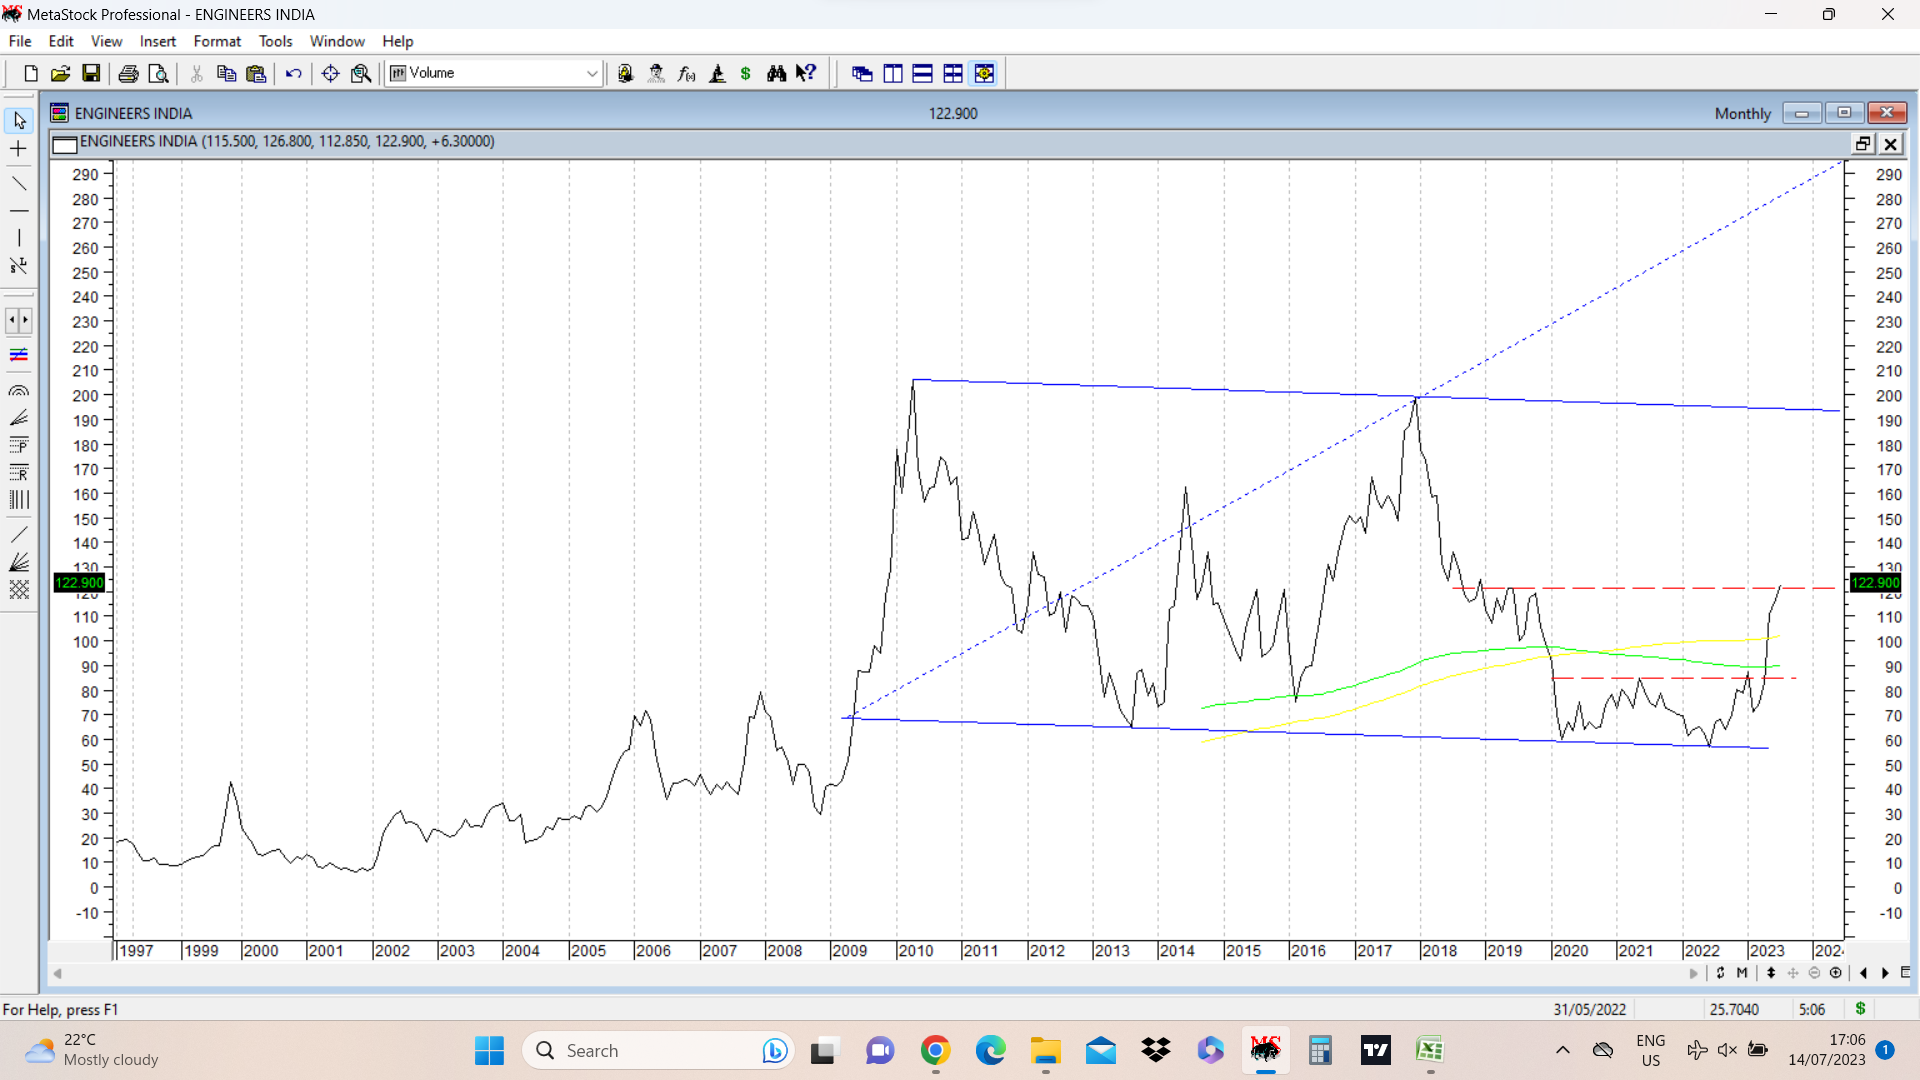
EIL stock price rallied from 70 in March 2023 to a swing high of 122 in June 2023, where it faced some selling pressure. It underwent consolidation for two weeks and as of today closed at around 121-122, and looks to have finshed its short term correction. How it performs going ahead is something we need to observe.
Interestingly found a Wolfe Wave pattern on monthly chart with outrageous price targets in excess of previous all time high of 269. When you are invested in a stock, you want to look at the most bullish patterns and possible bearish scenarios with support zones.
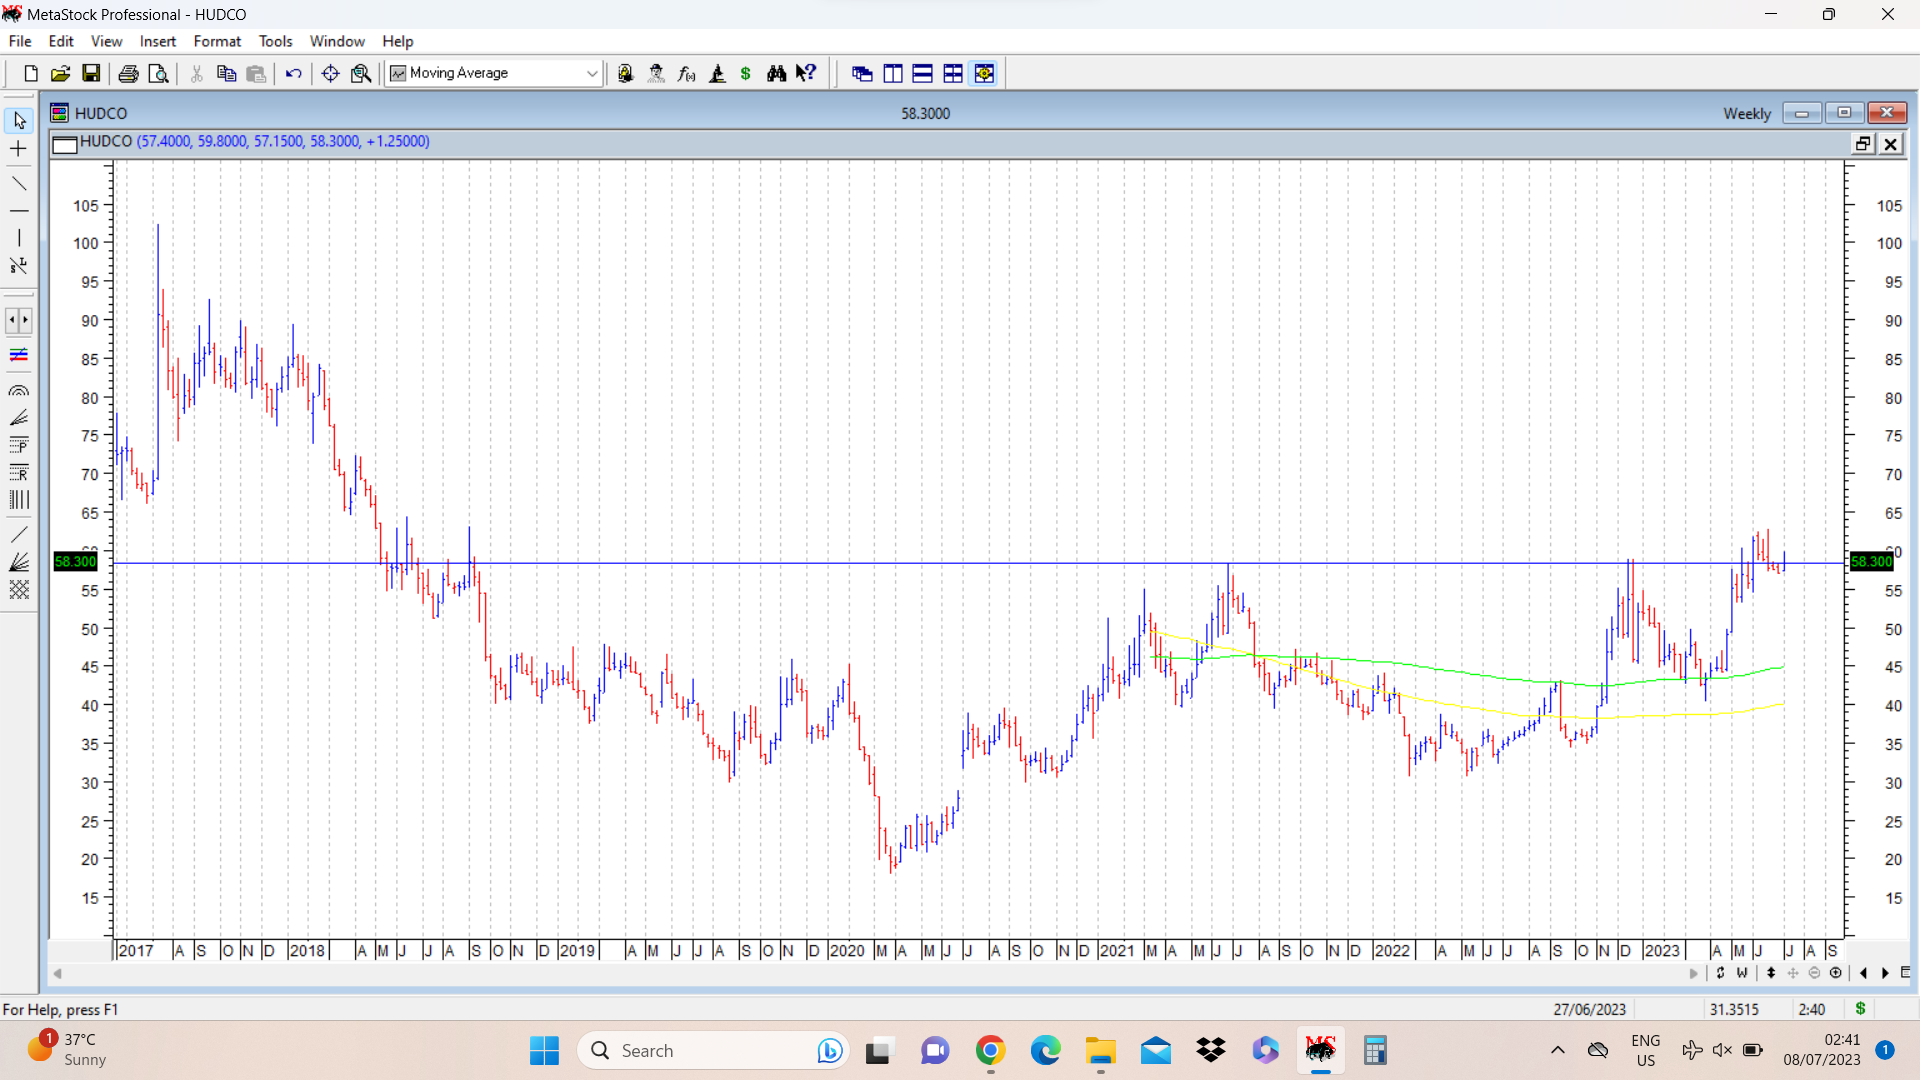
HUDCO remains stuck in a consolidation range around its breakout zone of 58. This can happen for a few trading sessions or a few weeks after breakout from a major resistance. If and when it starts clearing and trading above key resistances of 60-62, upmove can resume. Till then it needs patient nurturing. Possible upside target can be in range of 90, which was a major previous top of the current rounding bottom formation.
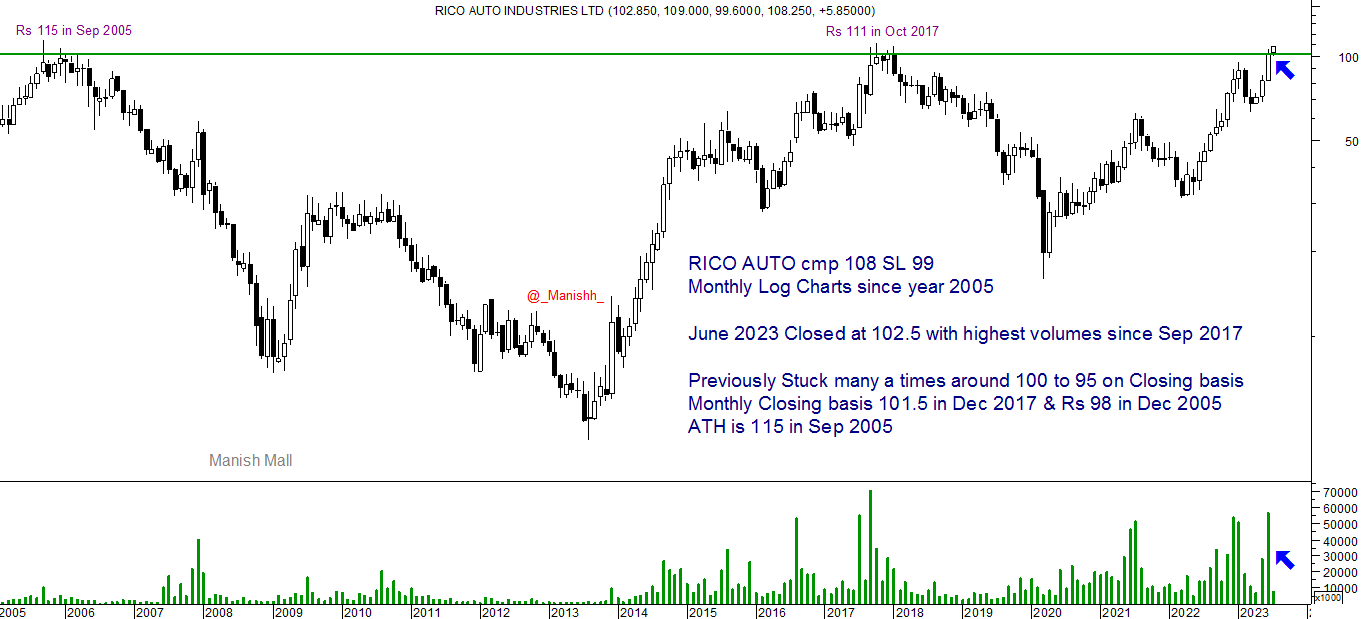
Hi @hitesh2710 sir, Do you have any views on Gabriel India and Rico Auto from technofunda approach ? Both are about to break multi year highs as per charts and overall auto ancillary as a sector (and these companies) also delivering good results.
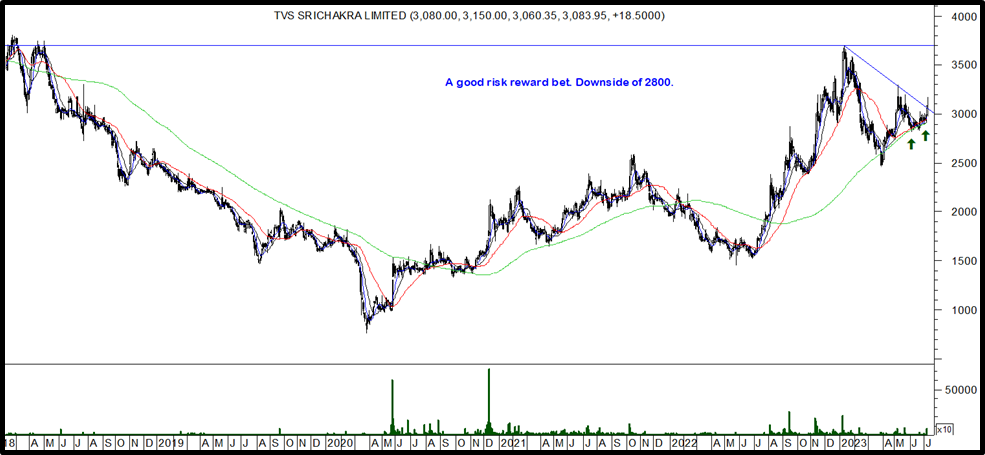
TVS Srichakra – Looks like a good risk-reward bet at the current price near the convergence of averages with a downside of 2800. Recently broke out of the downward sloping trend line and can catch up with peer companies subsequently breaking out of good multiyear base above 3700.
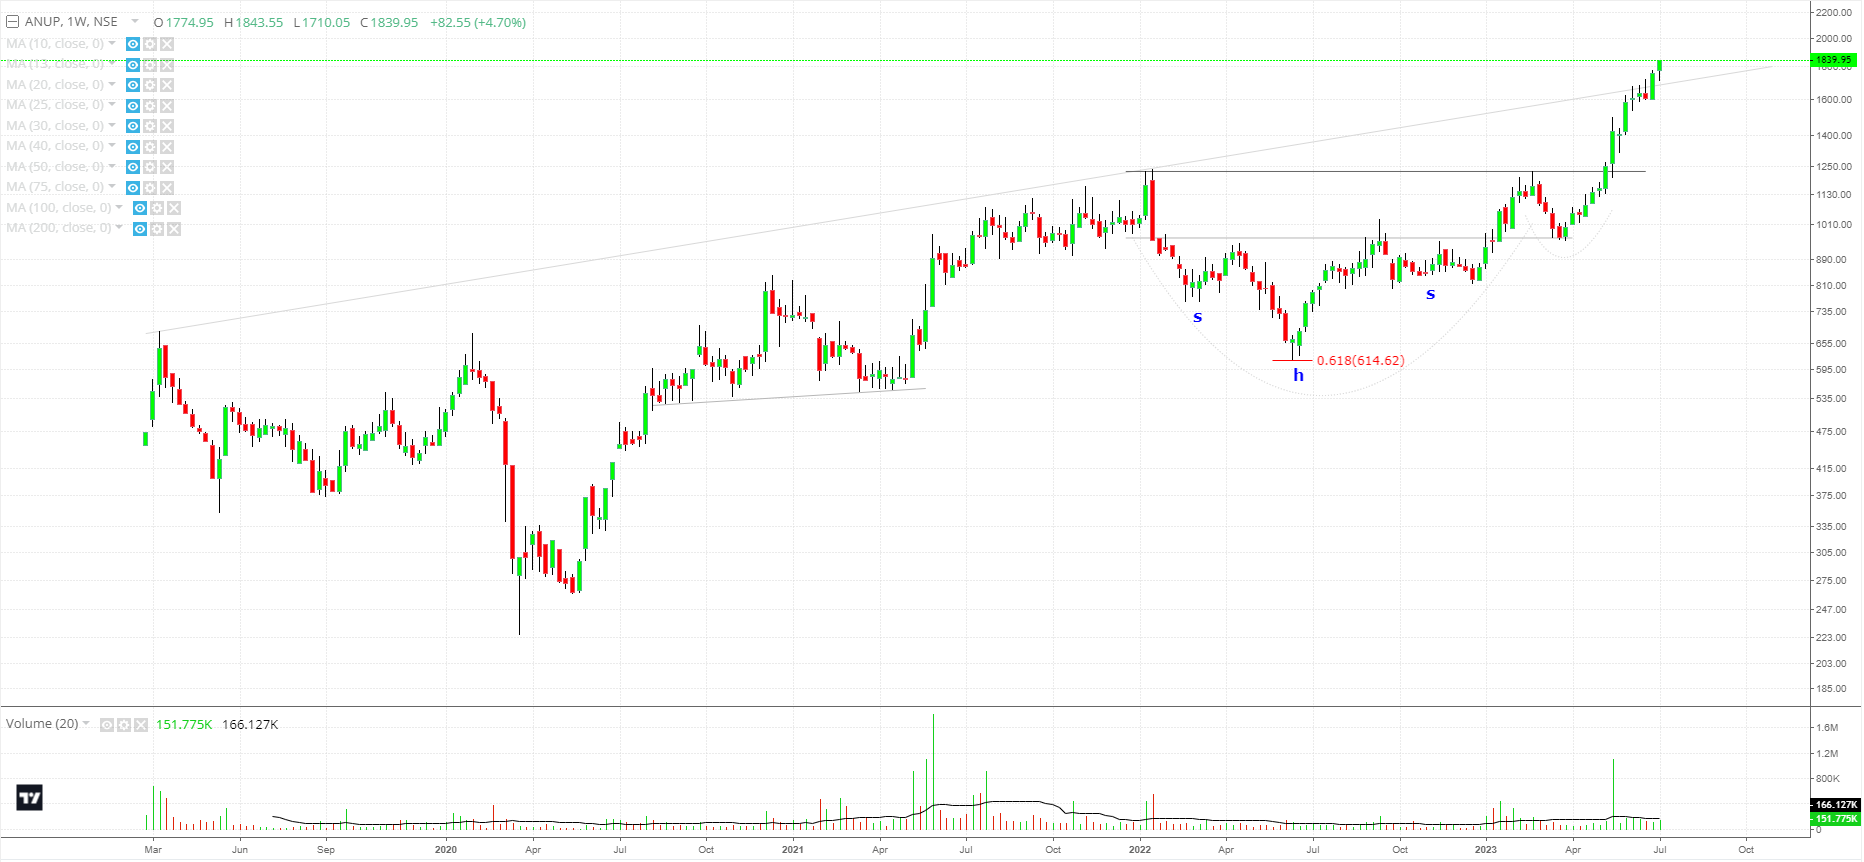
Both gabriel india and rico auto have had strong run ups and are approaching their previous all time high levels Looking at charts, it seems these highs will be taken out soon. I don’t track them fundamentally too closely, but overall chart structures in both seem to be good. disc: not invested in either.
Really impressed by the collective wisdom and eagerness to learn and share the learnings. Require help in the exit/hold strategy for ITC. Following are the details:
Average investment price: 197 (including brokerage)
Dividend received: ~30
No immediate need of funds.
I have been thinking of exiting it since 375 however somehow have not done it (perks of inactivity). As of now holding qty in full with a stop loss of 50 dma of ~440.
What could be the the hold/exit strategy for ITC and other insights you may have.
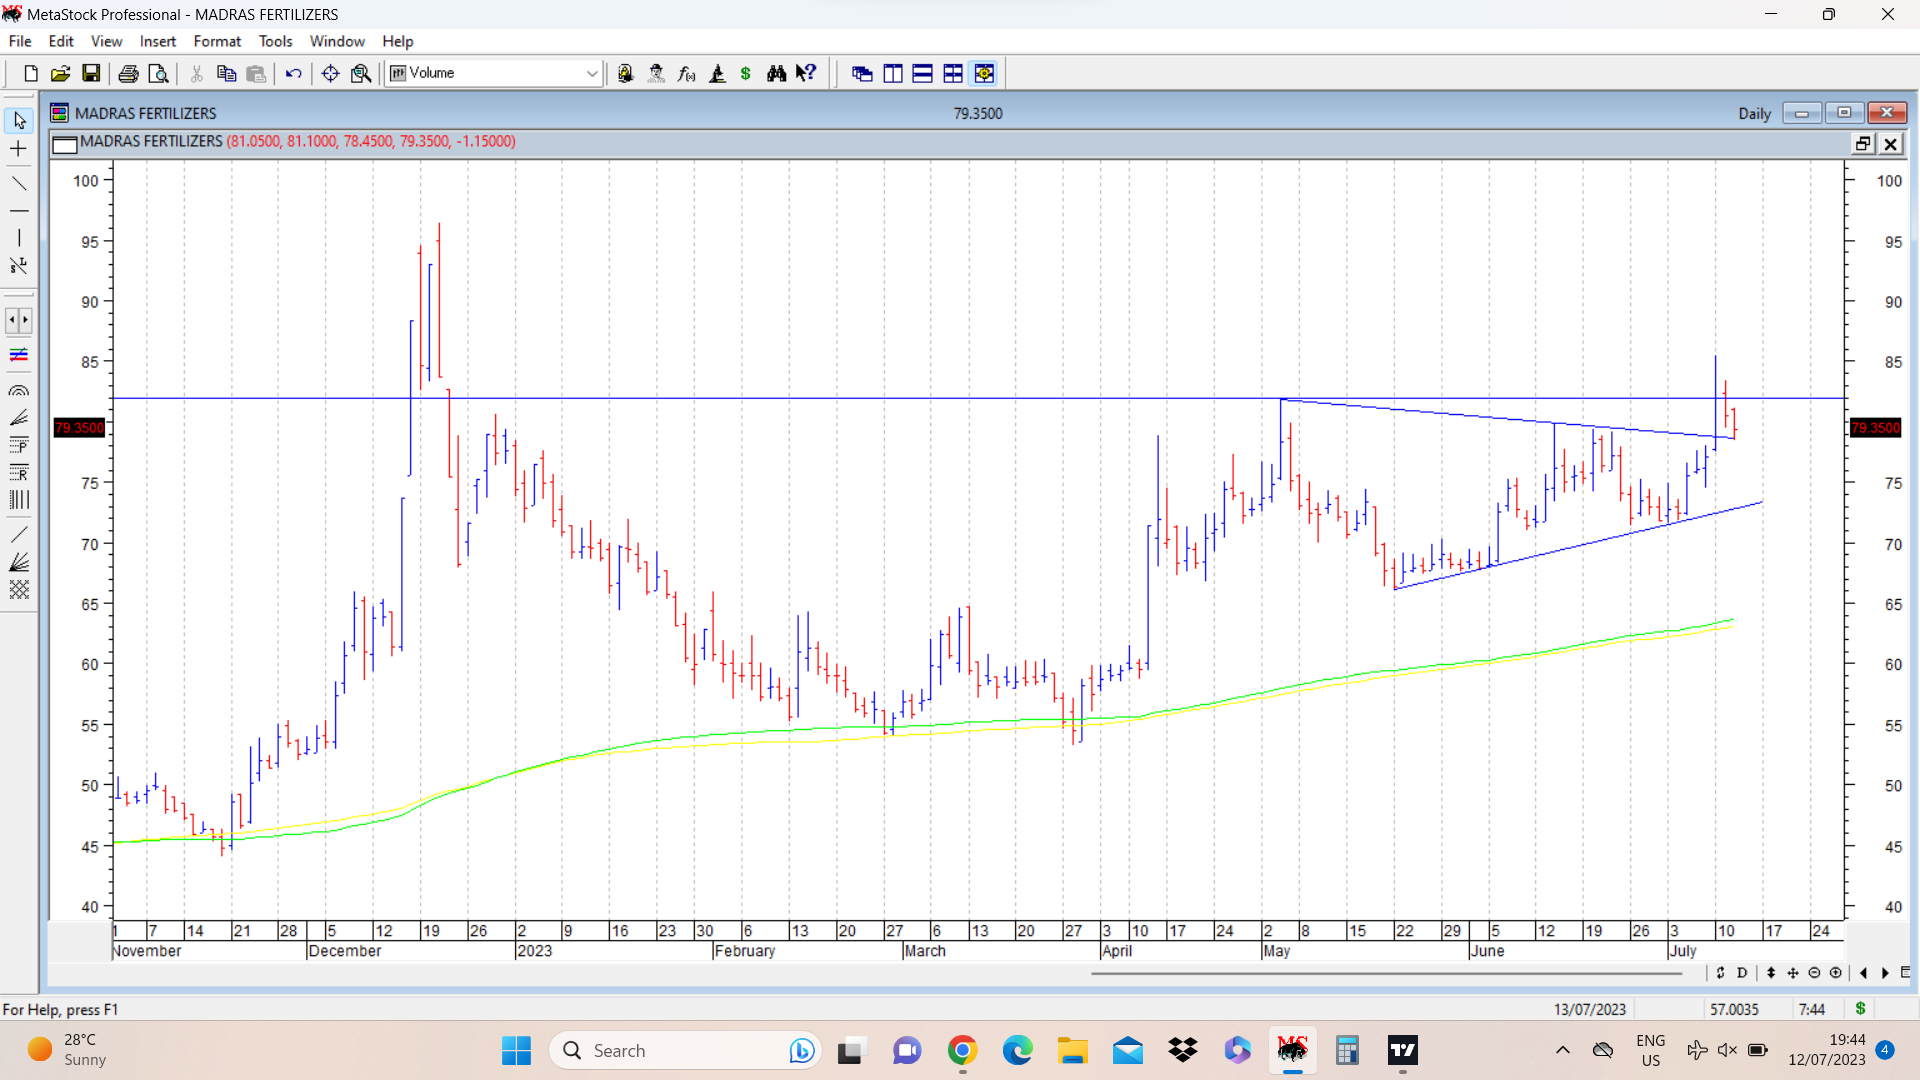
Madras fertilisers cmp 79. Stock price has given a breakout from a cup and handle pattern and now is retesting breakout zones. If pattern plays out target can be around 105. disc: invested.
ITC crossed its previous all time high of 360, in Feb 2023, and then has kept on rallying and posted a swing high of 480, and since past few days seems to be consolidating. For anyone riding the rally, an objective stop loss based on some moving average would be easy to follow. Say 30 WEMA at around 409 for someone having a medium term view. Or someone wanting to protect their profits in near term should consider 10 WEMA at around 447.
We have to realise that we don’t have any fixed formula for selling a stock. It has to be tailored to suit our termperament. Some people are good at selling in tranches at each rise.
I often sell based on frothy moves and overbought indications, and still have regretted the sell decisions. But as long as the portfolio keeps doing well, its okay.
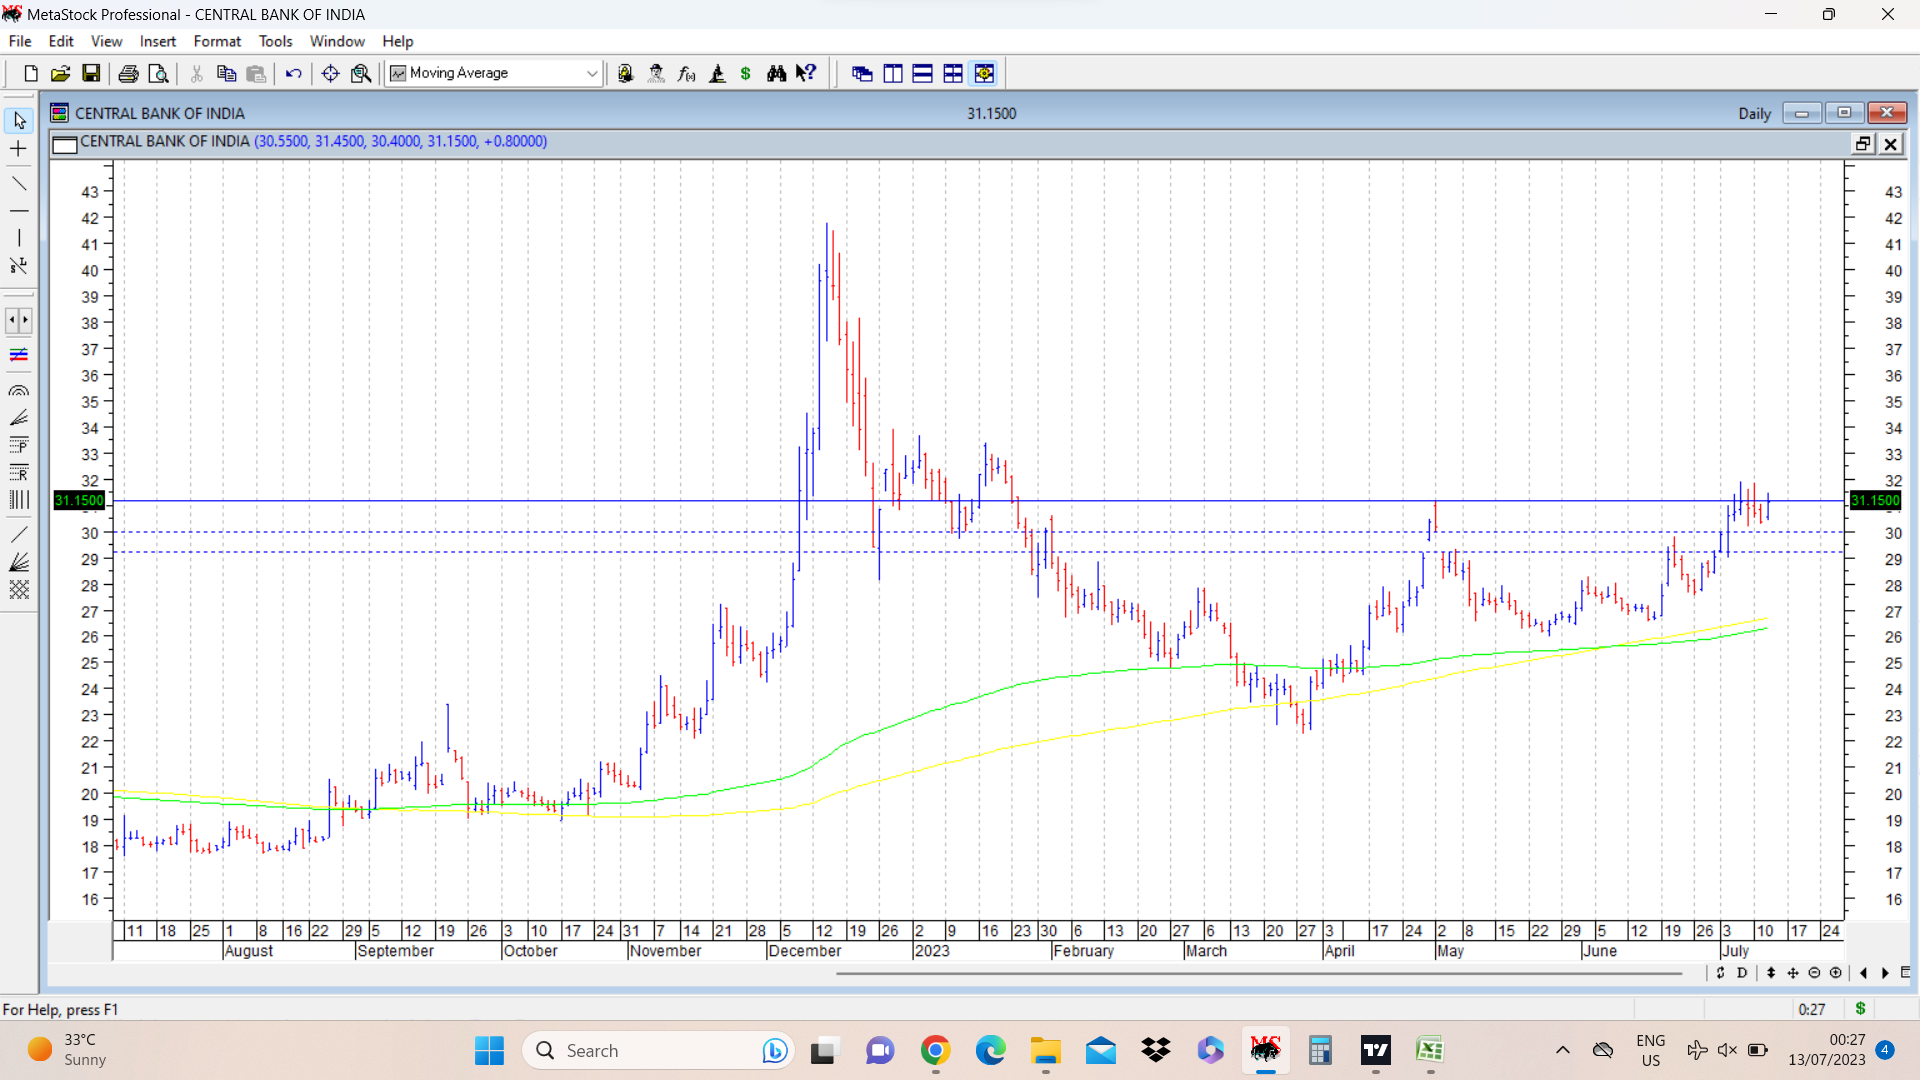
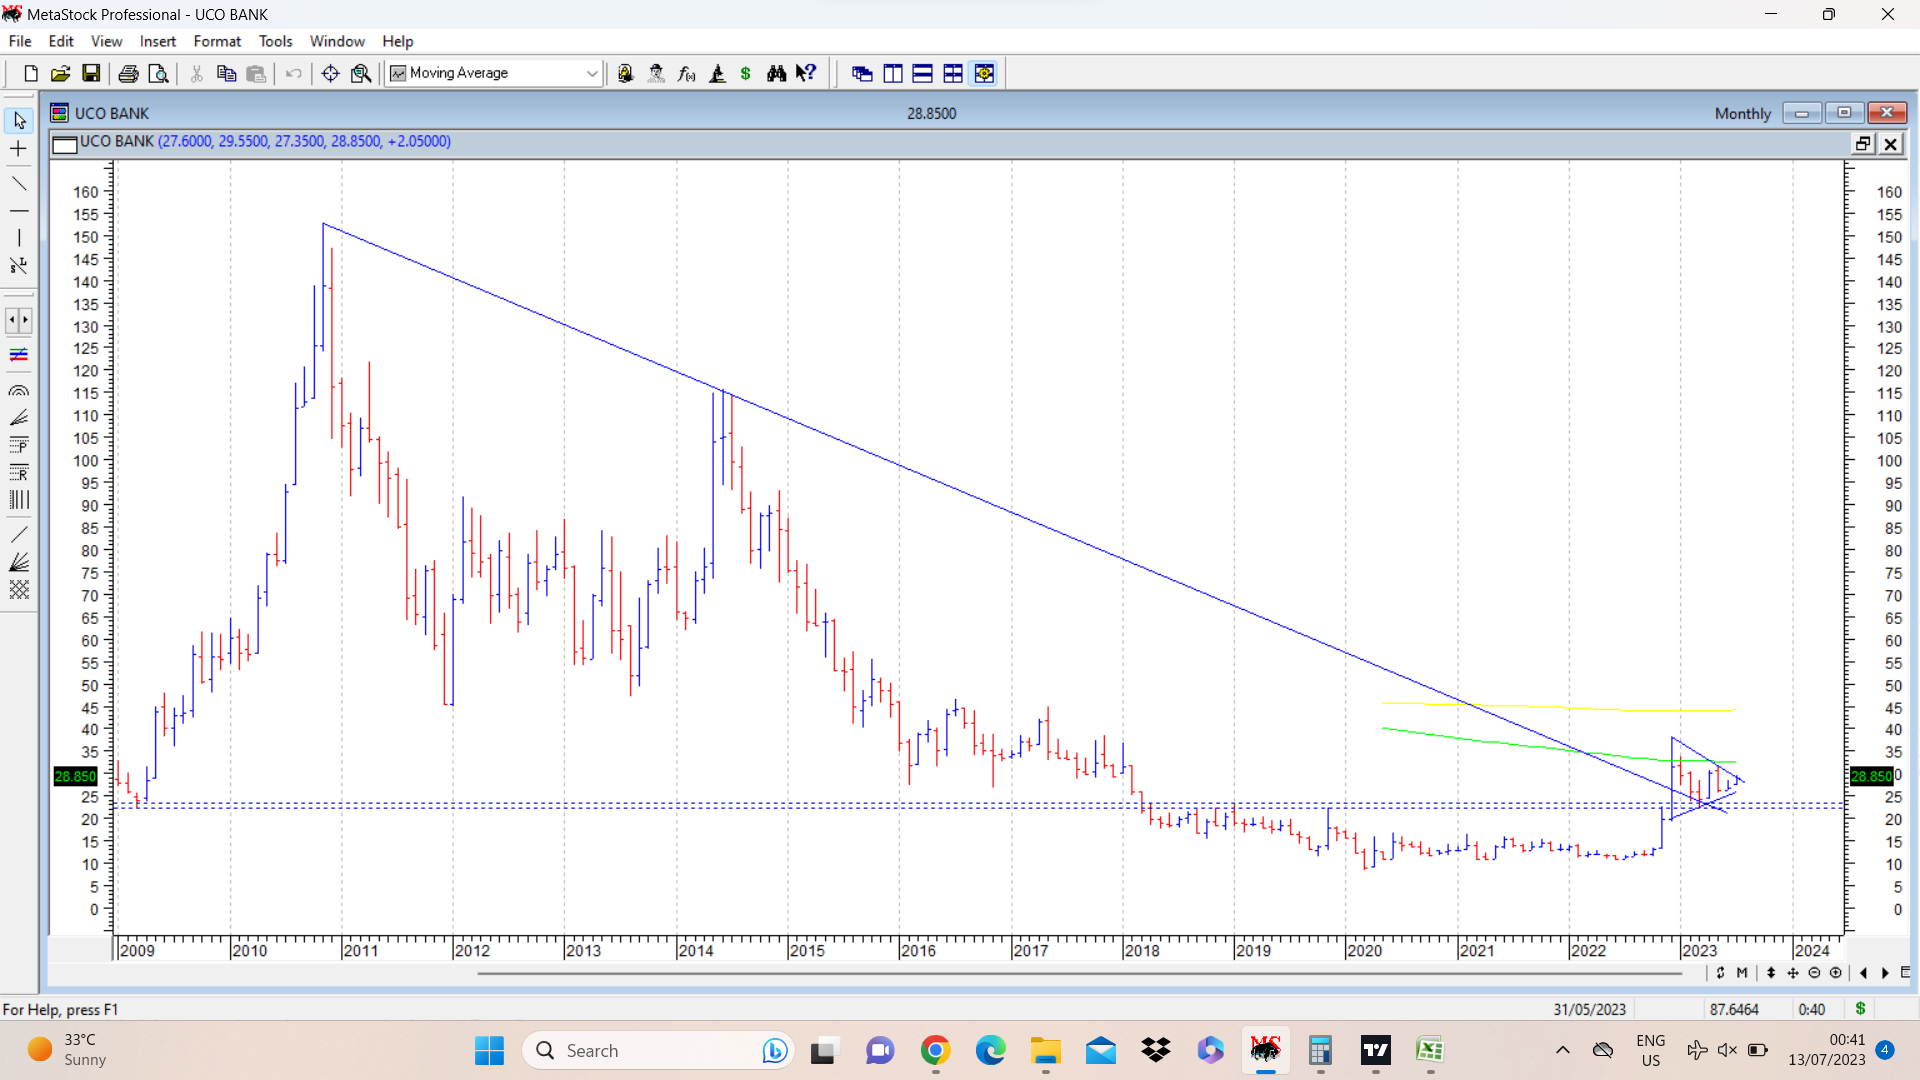
Central bank of India (cmp 31) is one of the smaller PSU banks which was under correction since Jan 2023. Key point was a rising gap followed by a falling gap within same region of 29-30, which was a bearish island reversal pattern, marked by dotted blue lines. ( both rising and falling gap falling within same price range. ) Stock price went below these levels, and after a period of nearly 2 months, managed to stay and trade above the island gap reversal region of 29-30 and is consolidating sideways.
Medium term swing high of 41.80 posted in Dec 2022 was then a 4 year high, crossing key resistance of 37-38 and stock price went into a medium term correction, posted a swing low of 22 in March 2023 and has managed to claw back to above key resistances. Near term resistance would be the above mentioned swing high of 41 and post that, there should be a good upmove.
disc: invested as a techno funda bet. (basket approach in south ind bank, IOB, UCO bank and central bank. there are a lot of such small banks to choose from, and one can create an appropriate basket based on own parameters. )
UCO bank monthly chart put up shows a trendline breakout and a triangular consolidation thereafter, and maintaining above the key breakout levels of 22-23 (marked in dotted blue lines) , which was a 4 year high breakout back in Dec 22, when stock price went above these levels and hit swing high of 38, before correcting in a triangular pattern. disc: invested in smaller psu banks as a basket mentioned earlier. ( this is not a recommendation to buy or sell. just an academic chart put up with patterns discussed. )
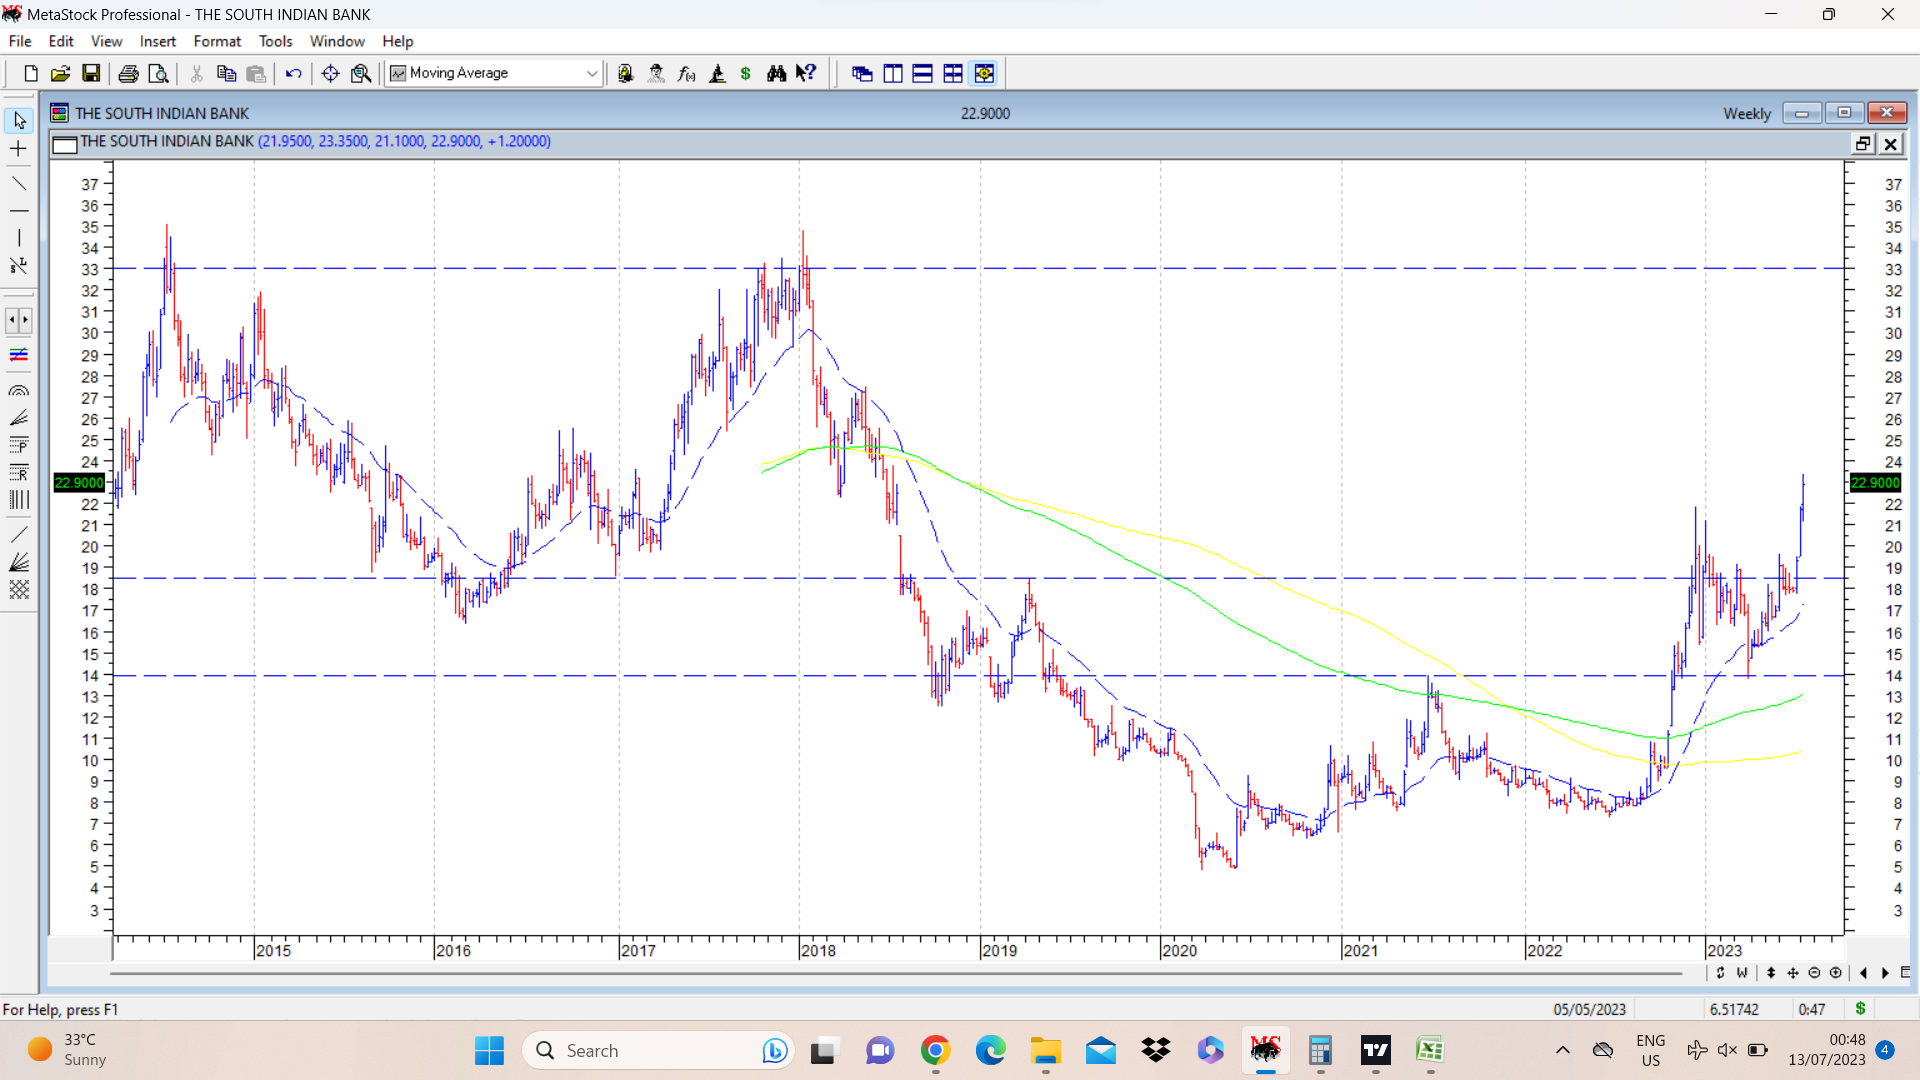
South ind bank cmp 22.80 is another example of a small bank trying to make big moves. After correcting from a double top of 35 in 2018, stock price went down to post a low of 4.80 during Covid crash.
In Nov 22, it crossed a 4 year high of 14 and went on to hit swing high of 21.80 in Dec 22 and corrected. In this correction it retested and bounced exactly from previous major resistance at 14 and has now gone above previous major swing high of 21.80. Among the smaller banks, it seems to be one of the stronger charts.
disc: invested based on a basket approach based on techno funda picture. (not a reco. )
Hello,
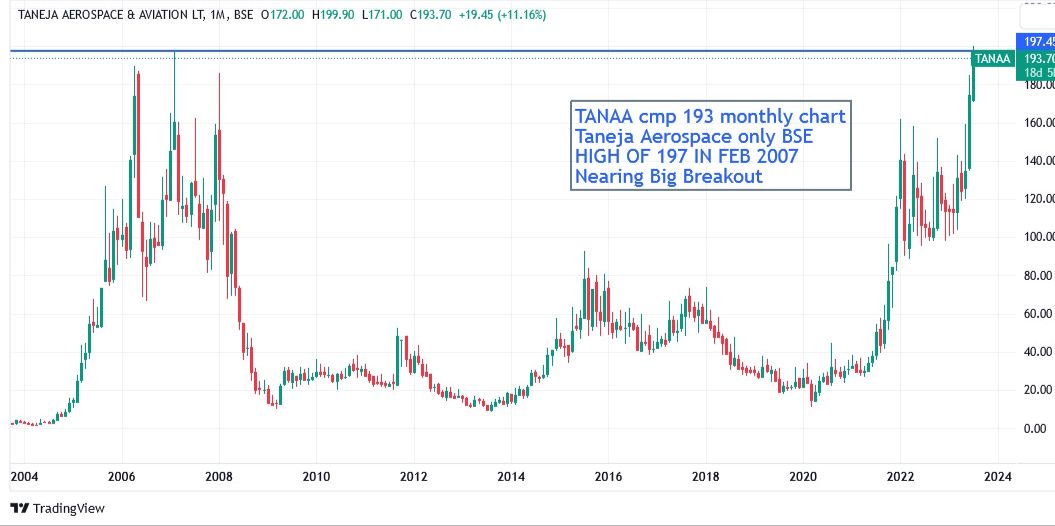
Anyone any View on TANAA cmp 193
Taneja Aerospace only BSE ,
into Business of MRO ( Maintaince , Repair , Operations )
Technicaly Near a BIG Breakout
Chart Attached … Views Welcome
EIL continues its upmove after breakout mentioned in above post. The next crucial resistance mentioned in the post of 120-21 proved to be a hurdle for a few trading sessions and stock price broke out and closed above this resistance zone yesterday. Today it closed at 127. Putting up a monthly line chart with resistances marked in dotted red lines.
Stock price is bound within a rectangular multi year range and that is clearly marked in chart . First breakout above 88-90 marked a breakout from lower end of the above range and now second breakout has happened. How far this goes up needs to be monitored. Upper end of range is at 190-195 and Wolfe Wave target marked on chart is at 290. disc: I remain invested as disclosed before.
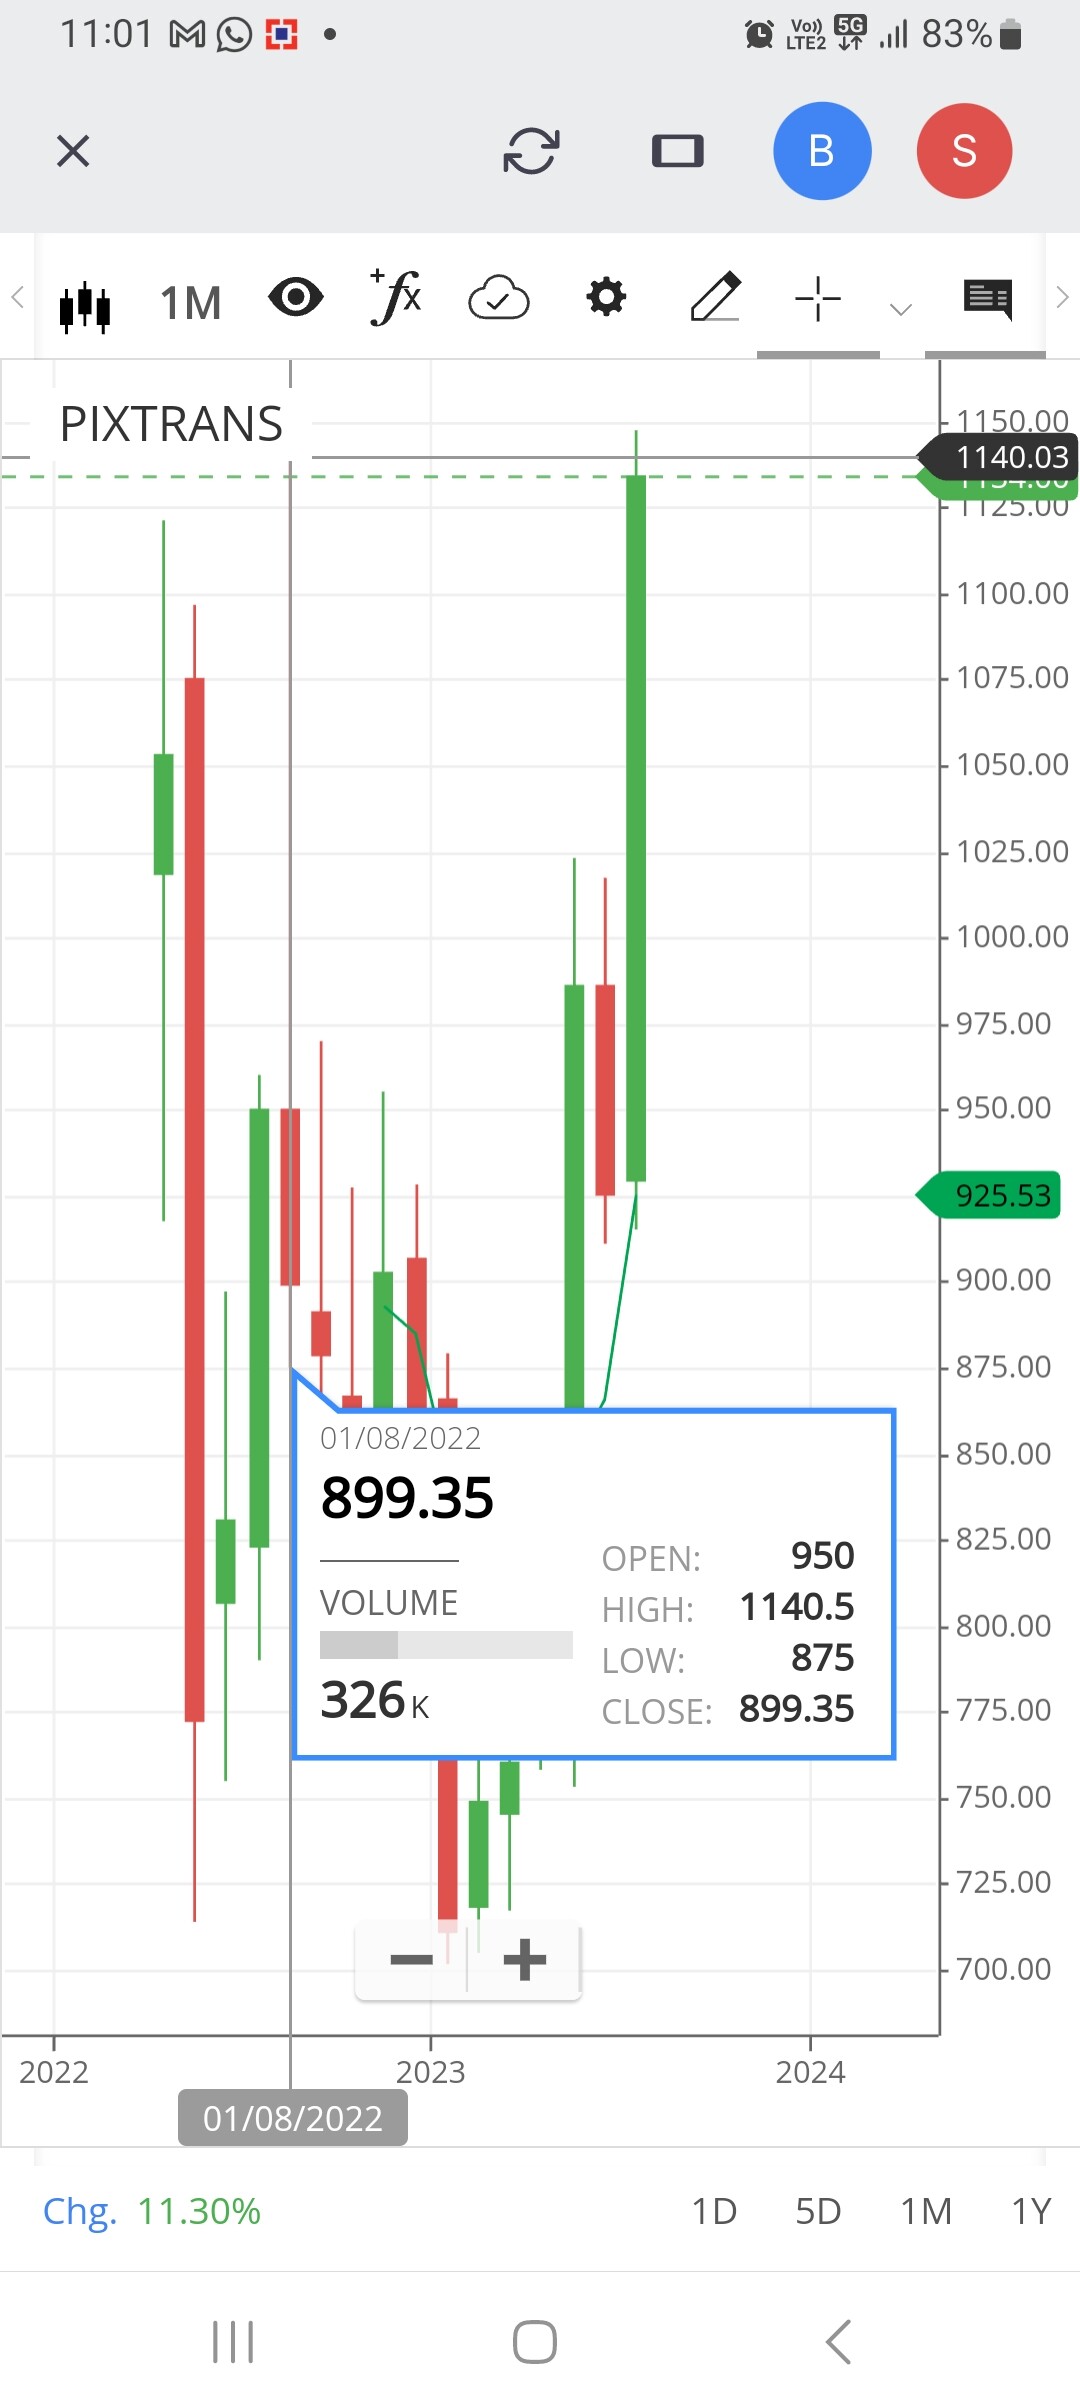
After consolidating between a wider band of 1140 on upper side and 702 on lowe side for more than 10 months.Today the stock broke the upper resistance.A weekly close above 1140 can lift prices to 1500+level in short term.
@hitesh2710 - Hi Hitesh, looks like it crossed 122 today, which was the swing high of June 2023 which it couldn’t take out then. Also, there seems to be near term trigger as well i.e. Chennai petro tender for 9MMTPA refinery closes today, which can be a large opportunity for EIL. The full project cost would be 31,580 Crores apparently. Your thoughts on the risk to reward here? Thanks
Thanks for the fundamental update. As you mentioned, stock price convincingly crossed its major resistance at 121-22 today and closed at 127.
Regarding risk reward, I think one has to keep appropriate stop losses and follow the trade set up, keeping an eye on the possible targets. For me EIL remains more of a technical position and hence I keep the trading plan in place and trail stop losses. Anyone contemplating investment should do their own research and take a call. The post does not mention any buy or sell recommendation.
Two important aspects I considered at the time of entry were price pattern on charts and initial signs of sectoral fancy in PSE companies at that time.