
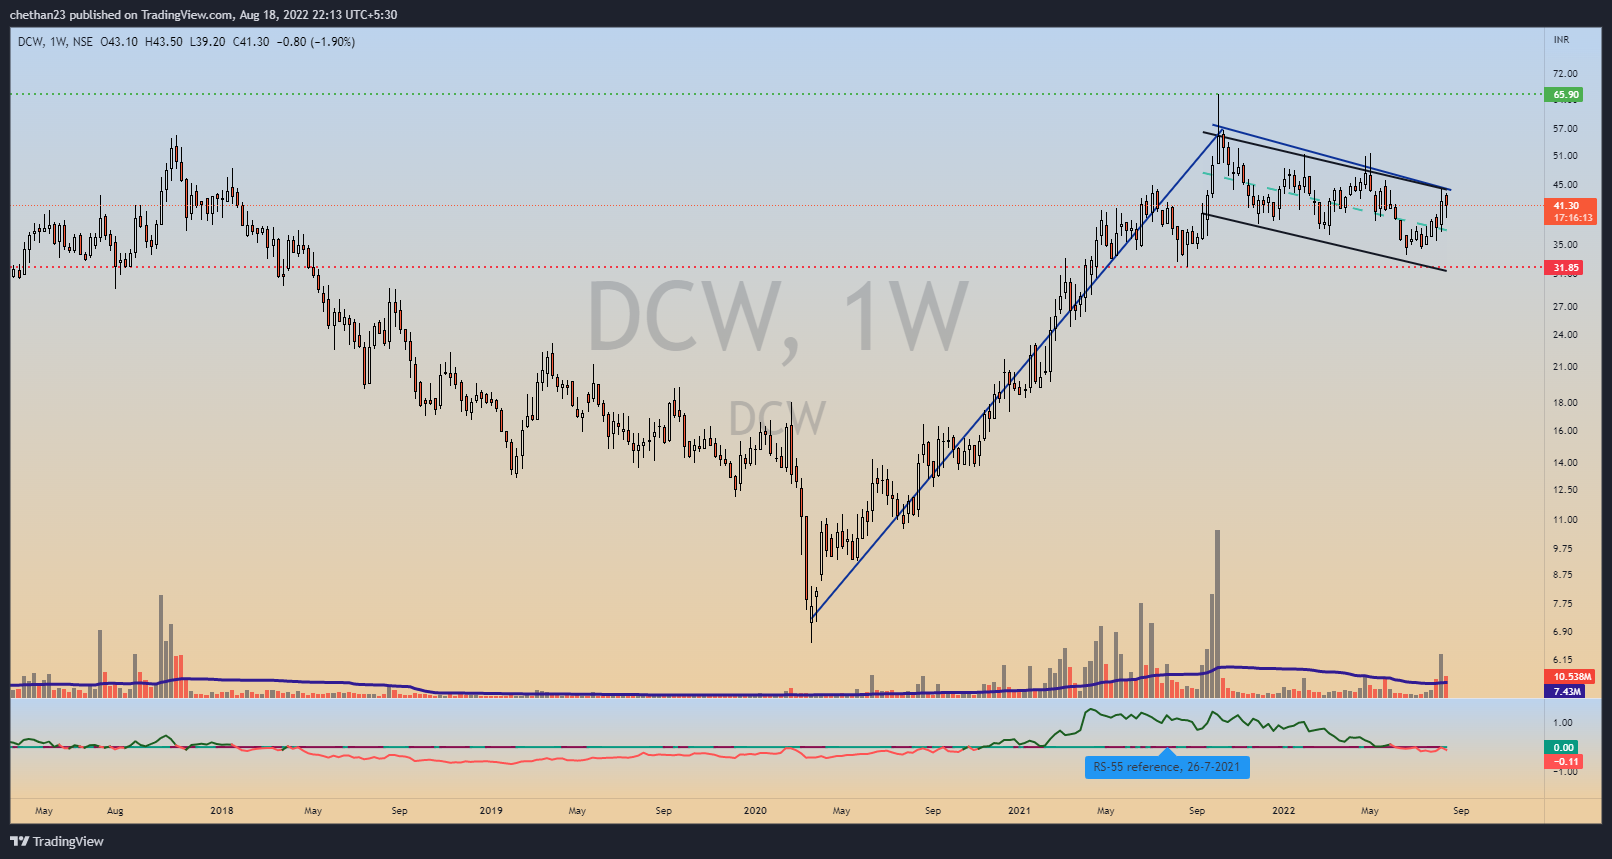
DCW, Wkly chart, after making a move over 250% , price in a range for over 11 months now, also 3 touch points can be seen, price near BO point now. We can say flag pattern as well
2 Likes
Artemis Medicare - chart since 2020.
Stock seems to be breaking out on the upside of long term range - volumes last week were decent and also results were good in the previous quarter.
Stock is at 52 week and all time highs now. Comfortably above both 30 WMA and 10 WMA (both tilting upwards sharply)
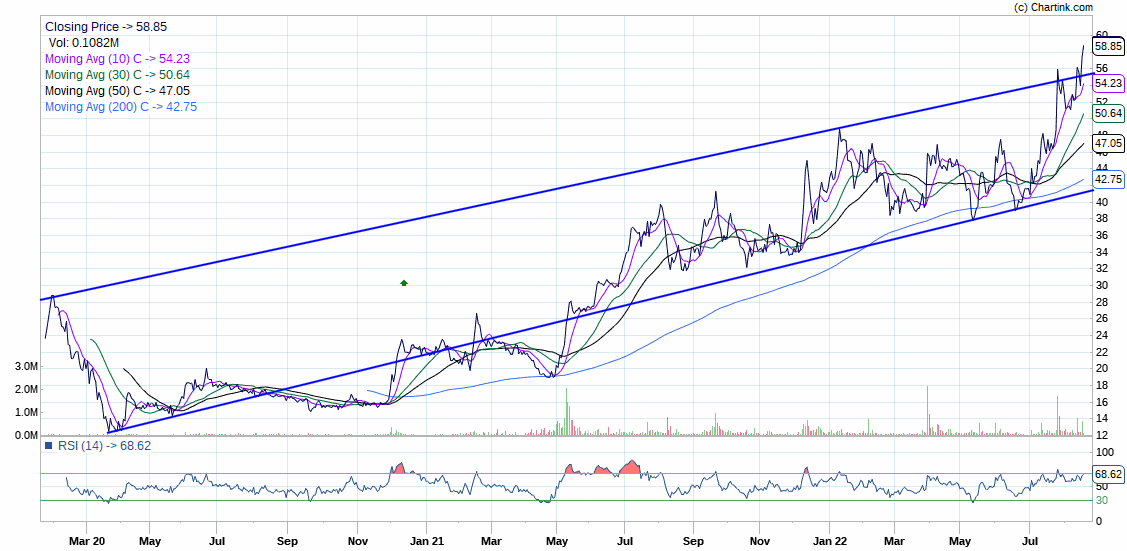
Disclosure : I am invested in the stock on fundamentals and added more recently. Rationale covered here Artemis Global Life Sciences - #40 by Lynch Still learning technicals/techno funda, so there might be more to this
1 Like
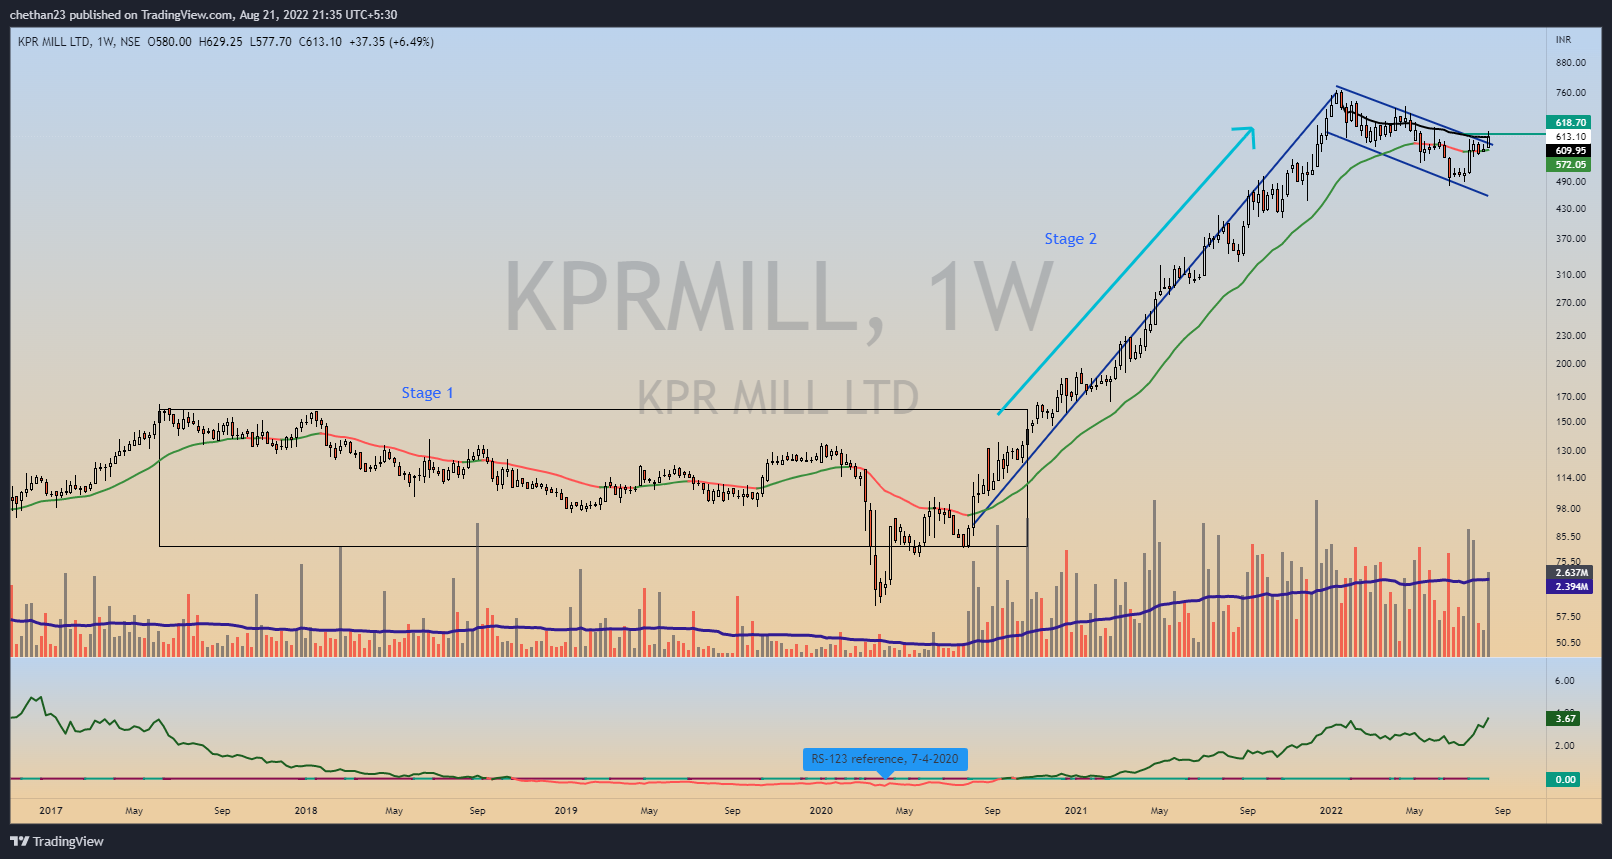
KPR Mills, Weekly chart, after price broke out of stage 1 it has moved over 350% and is consolidating for past 8 months, has formed flag pattern, also price tightening can be seen.
4 Likes
Philips carbon chart breaking out with high volume after forming a RHS and I also see a flag and pole breakout.
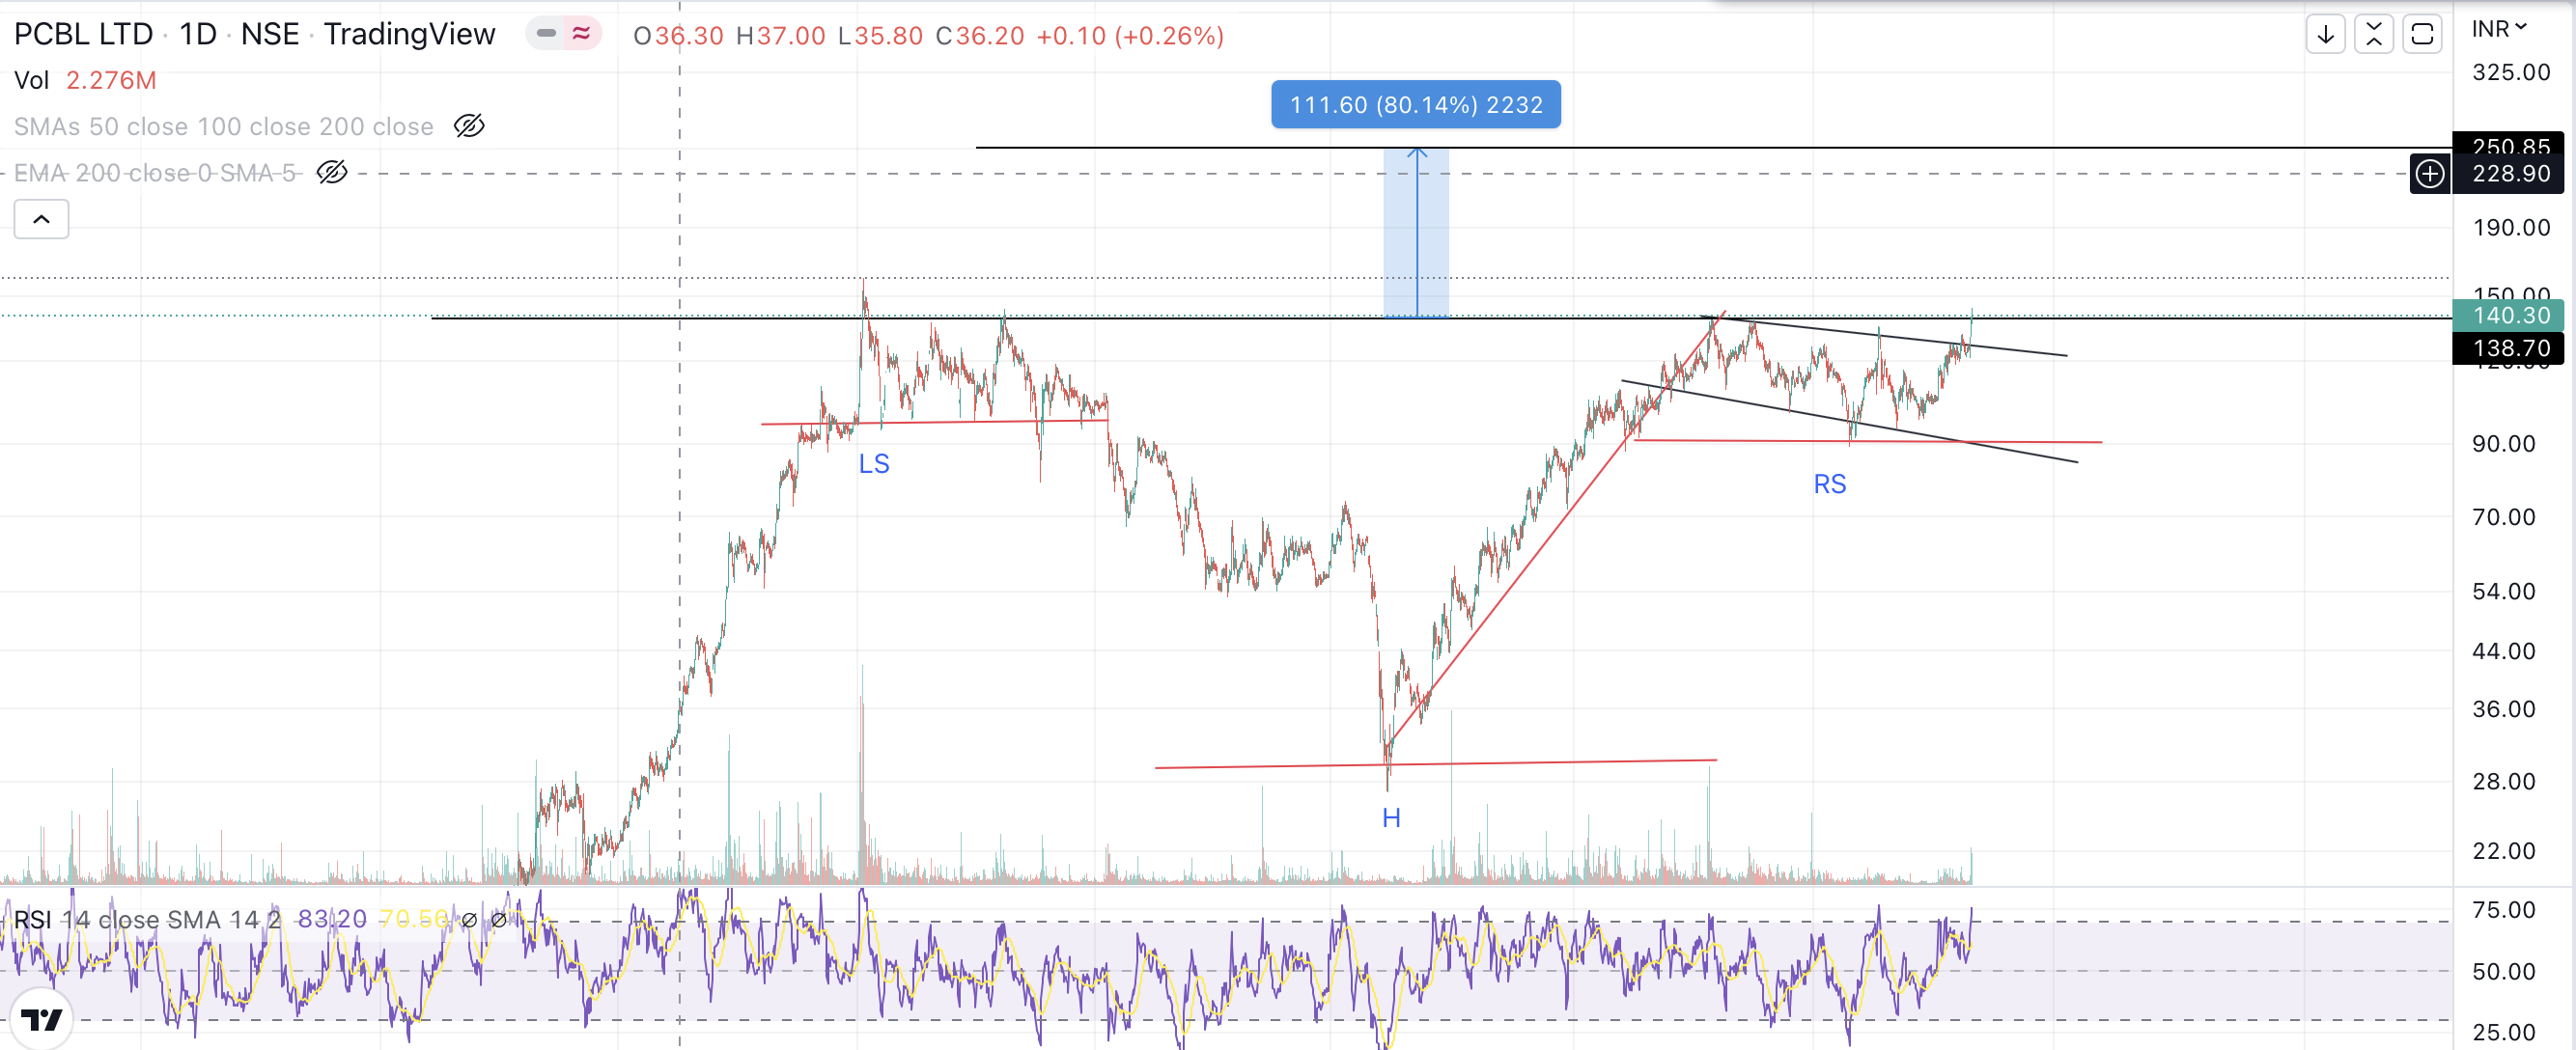
Disc: Invested
1 Like
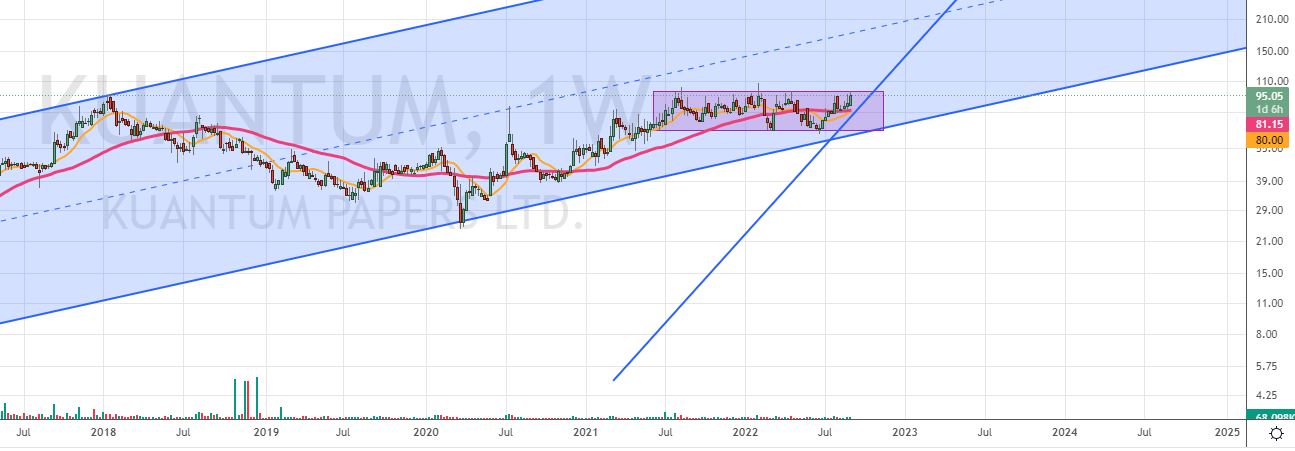
laggard in paper sector due to debt/pledging ?.. new all time high…
started doing cancall…
switched to new tax regime…
one time write off due to new tax regime…
low taxes next year…
paper prices high and demand due to new text books NEP set to go higer…
huge jump in roce…expected…
invested: lower levels
1 Like
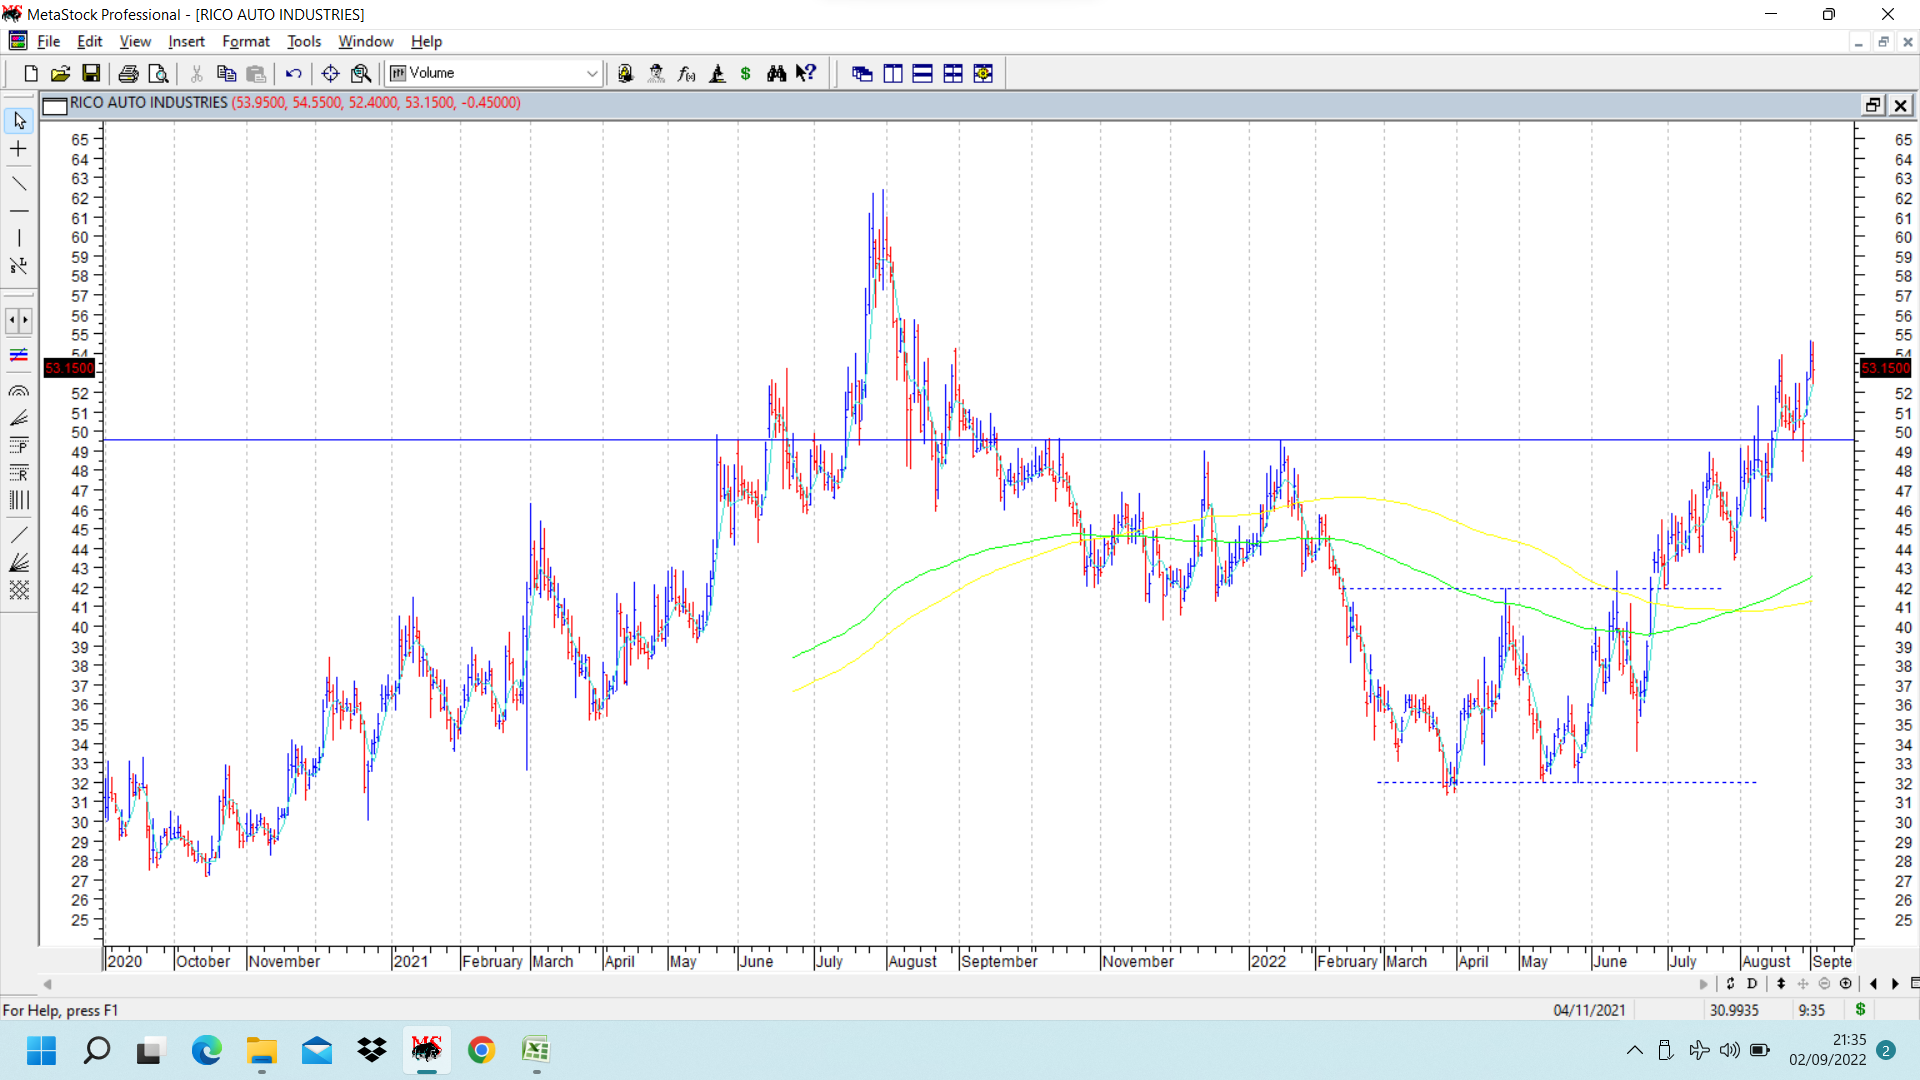
Auto ancillaries have been showing strong momentum during the last few weeks of market rally. Rico auto chart was shared in an earlier post. Stock price crossed an important pivot of 49-50 few days back and has been consolidating above that level. Pivot is shown in attached chart as solid blue horizontal line. (also shown in dotted lines is a double bottom formation between 32-42. Going ahead, 62 can be an interesting level to watch, where a previous top was in place. disc: invested as a techo funda bet. ( management commentary in q1 fy 23 concall remains bullish and target of 2400 crores sales with improving margins for fy 23 re iterated. )
14 Likes
Hello Hitesh Sir
As you gave your view about Pricol Ltd in Oct’21 at that time it was @107 and you suggested TGT 170-180 now it has run up to 170 and I am holding since then thanks for guiding us
3 Likes
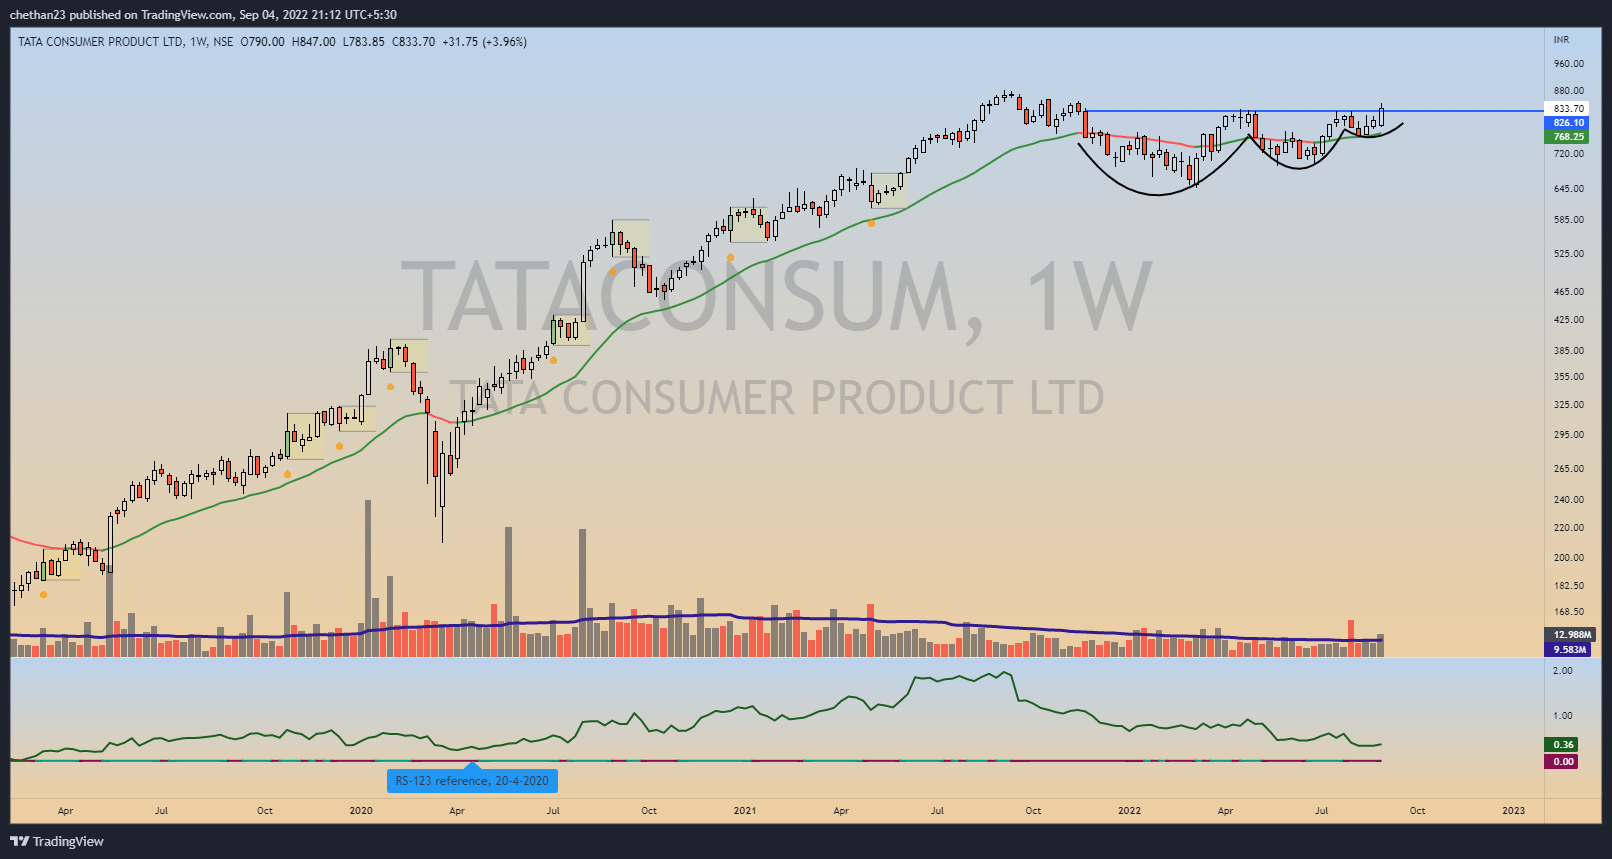
Tata consumer, VCP on Weekly, now price has tightening considerably for past few weeks, also its from strong sector FMCG
4 Likes
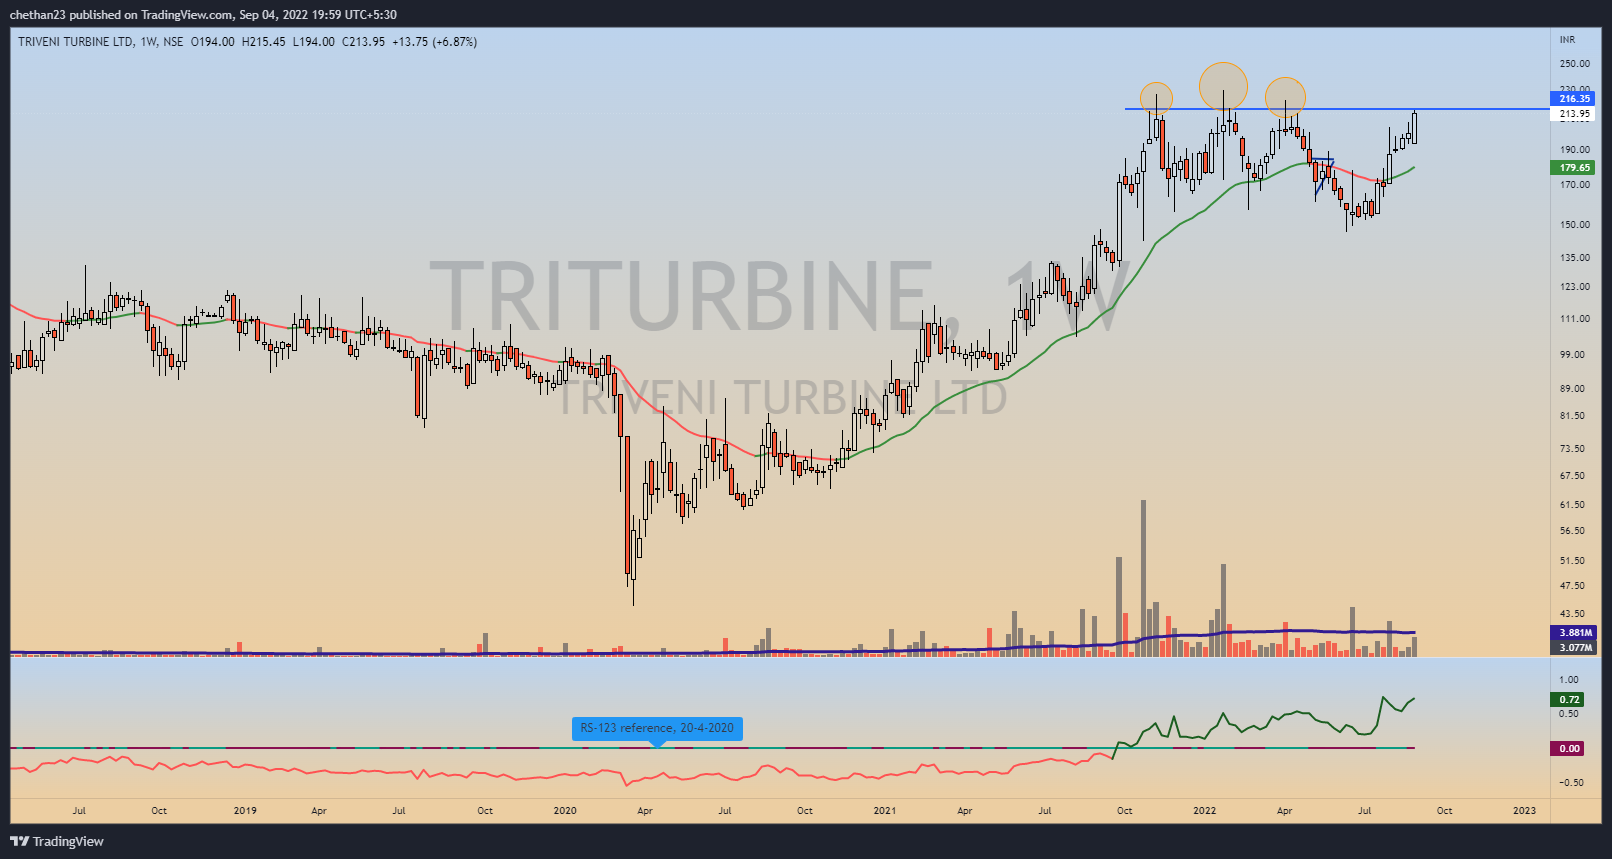
Triveni Turbine, Wkly, now price has come to same level where it was rejected 3 times earlier, marked with circles, also green candles with higher volumes suggesting some buying interest, Price is near ATH
1 Like
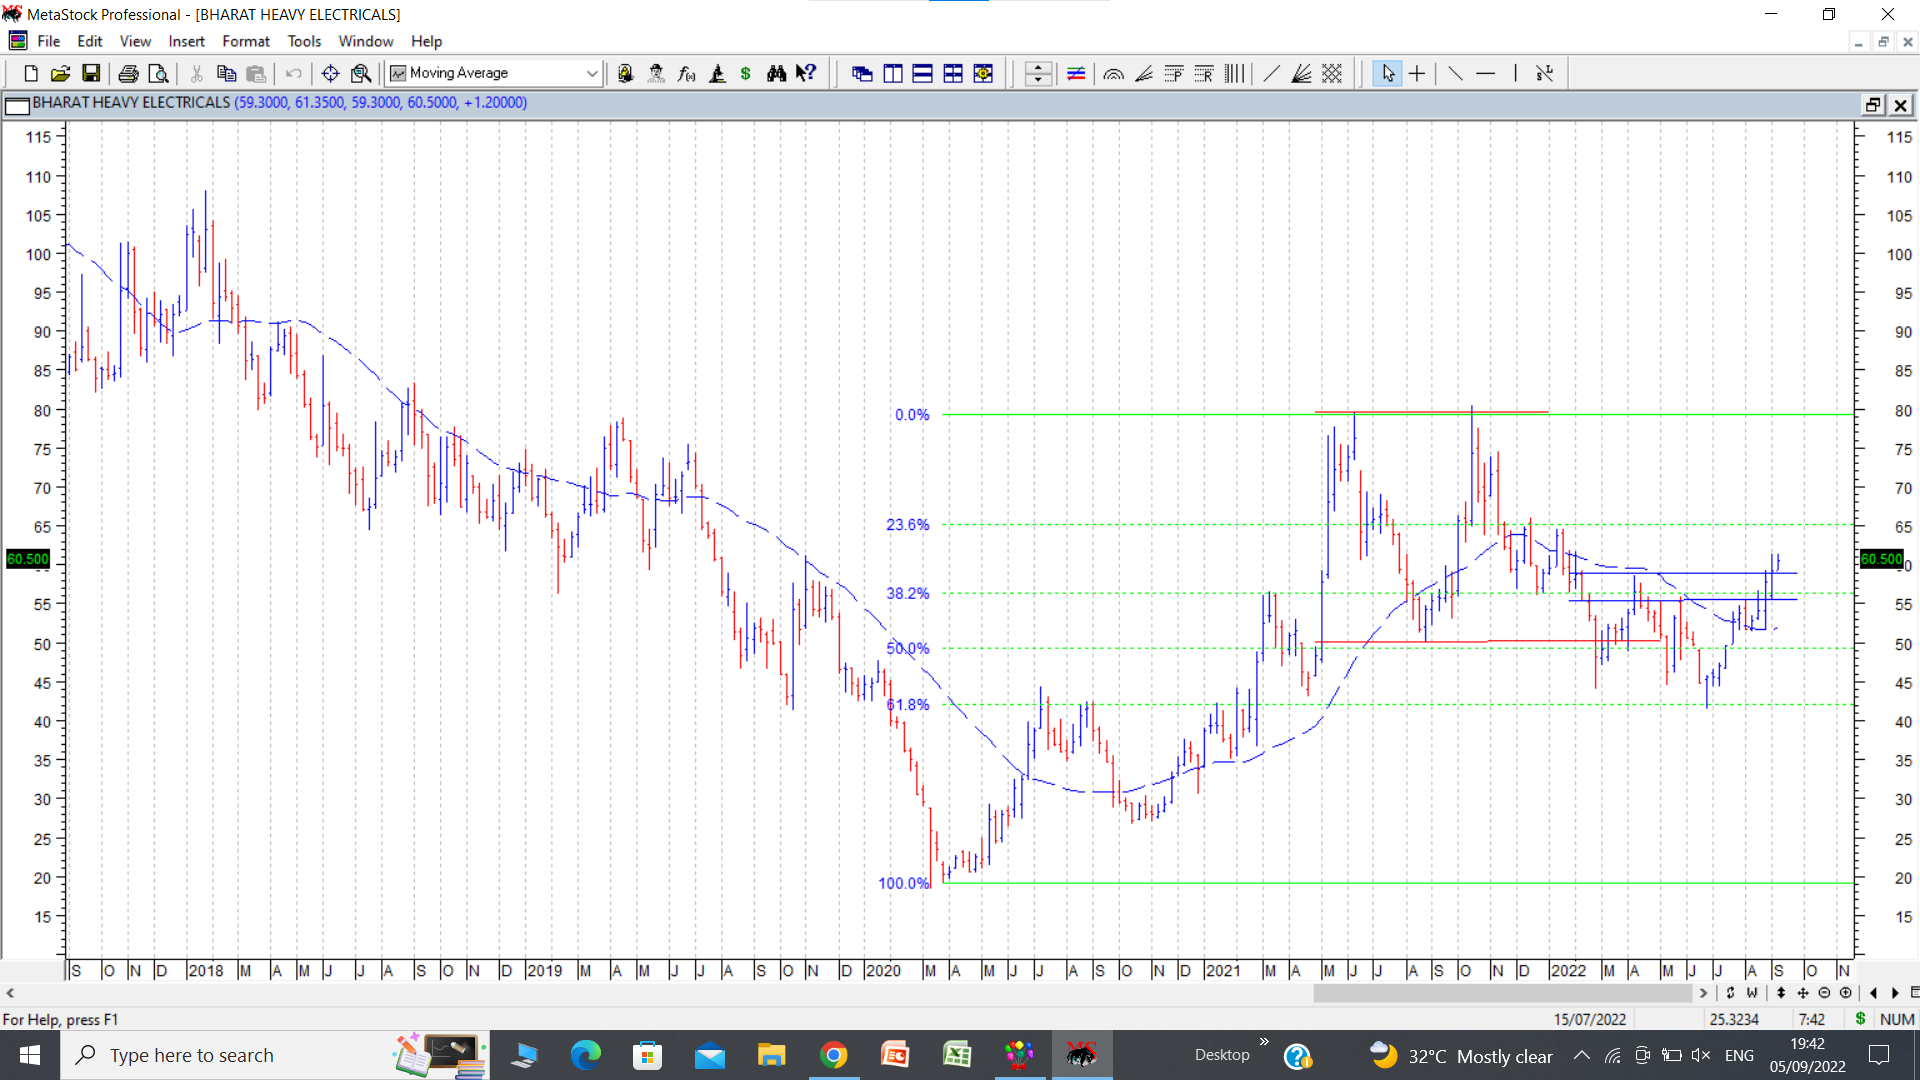
PATTERN FAILURES AND ITS RAMIFICATIONS.
Whenever a very clearly visible pattern occurs and gets confirmed and then it does not play out as expected, but instead stock price starts doing opposite to what is expected post pattern confirmation, we label that situation as pattern failure. Usually when a pattern failure happens, the move in opposite direction is quite strong and worth tracking (and riding if one is confident)
e.g In the example I have put up of BHEL weekly chart, stock price went up from Covid lows of 29 in March 2020 to high of 80 in June 2021. Then it went down to post a swing low of 50 in August 2021. Again it went up to post another high exactly at 80 (rounded off both tops for ease of visualisation) in October 2021. And started falling from there to break below the previous intervening low of 50 in Feb 2022. Now technically this double bottom breakdown (both tops and intervening bottom marked in solid red lines) should have led to targets of 20 in the stock price. ( double top at 80, intervening bottom at 50, so distance is 30 rs. If you subtract that from breakdown level of 50, we get target of 20) Instead, stock price bottoms at 41.40 and forms a weekly doji with a long tail with a bottom exactly at 61.8% retracement level to entire previous rally from 29 to 80. And reverses. Now it has crossed two important pivots marked in blue horizontal lines at 55-56 and 58-59 and is trying to consolidate above that level and is above the 30 week moving average in dotted blue line and the 30 WMA has started to turn up and is currently at 52.
Sectorally the cap goods/electrical equipment segment has been on a strong run and a lot of stocks from the sector like ABB, Siemens, Cummins etc have run up and posted very strong rallies. BHEL is a relative laggard. In sectoral bull moves, the laggards often move late on in the sectoral run, but often run the hardest and often end up giving spectacular returns.
Example of what I mean by run ups in sectoral bull runs… In sugar rally, Balrampur Chini was sector leader and went up above its all time high of 200 in March 2021. At that time Renuka Sugar was at around 9-10 Rs. Since then Balrampur chini posted a high of 525 and is currently at 362. Whereas Renuka posted a high of 63 and currently at 48. The laggard has shown better returns as compared to the leader. So I am often a fan of combining few stocks both leaders and laggards to ride a sectoral rally.
disc: I have a starter position in BHEL more as a technical bet based on above observations with low allocations. Trying to test the above hypothesis of pattern failure, and sectoral rally, all bunched up together. (this is not an investment advice, but shared as an example to illustrate a theory not practiced frequently, about pattern failure and its ramifications)
36 Likes
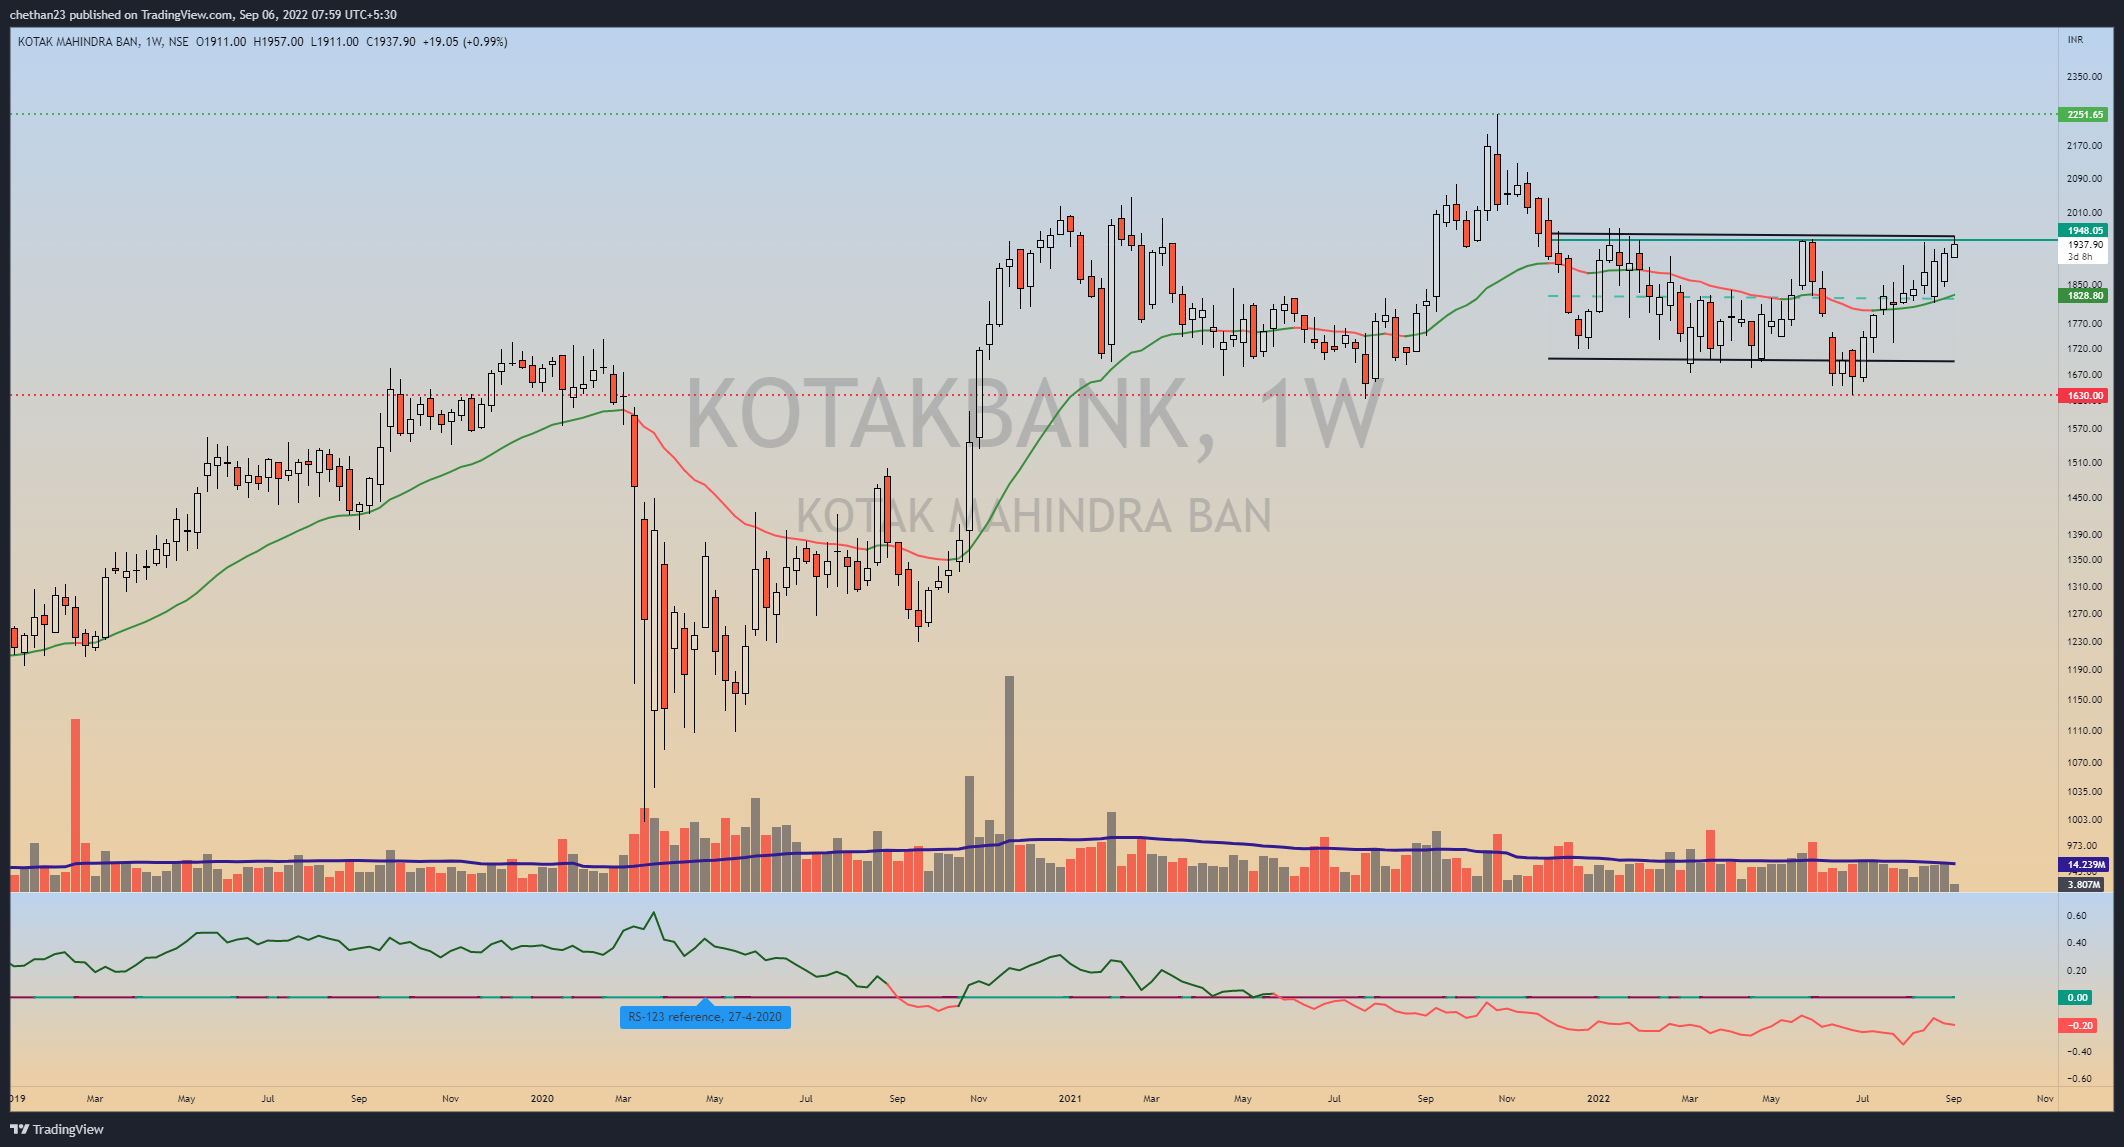
Hi Hitesh Ji, Will you consider even Kotak bank in this category or you see that stock has to retrace to certain percentage, If you see banking sector is strong many stocks like Federal, ICICI, SBI, etc are almost near ATH and strong compared to Kotak, if you see the chart its in stage and near BO. I have attached the chart here.
So what would be the trigger(s) to sell on the downside? -
a. Would it be a break-down by the sector leaders or
b. Would it be when BHEL drops to say 20 or so levels?
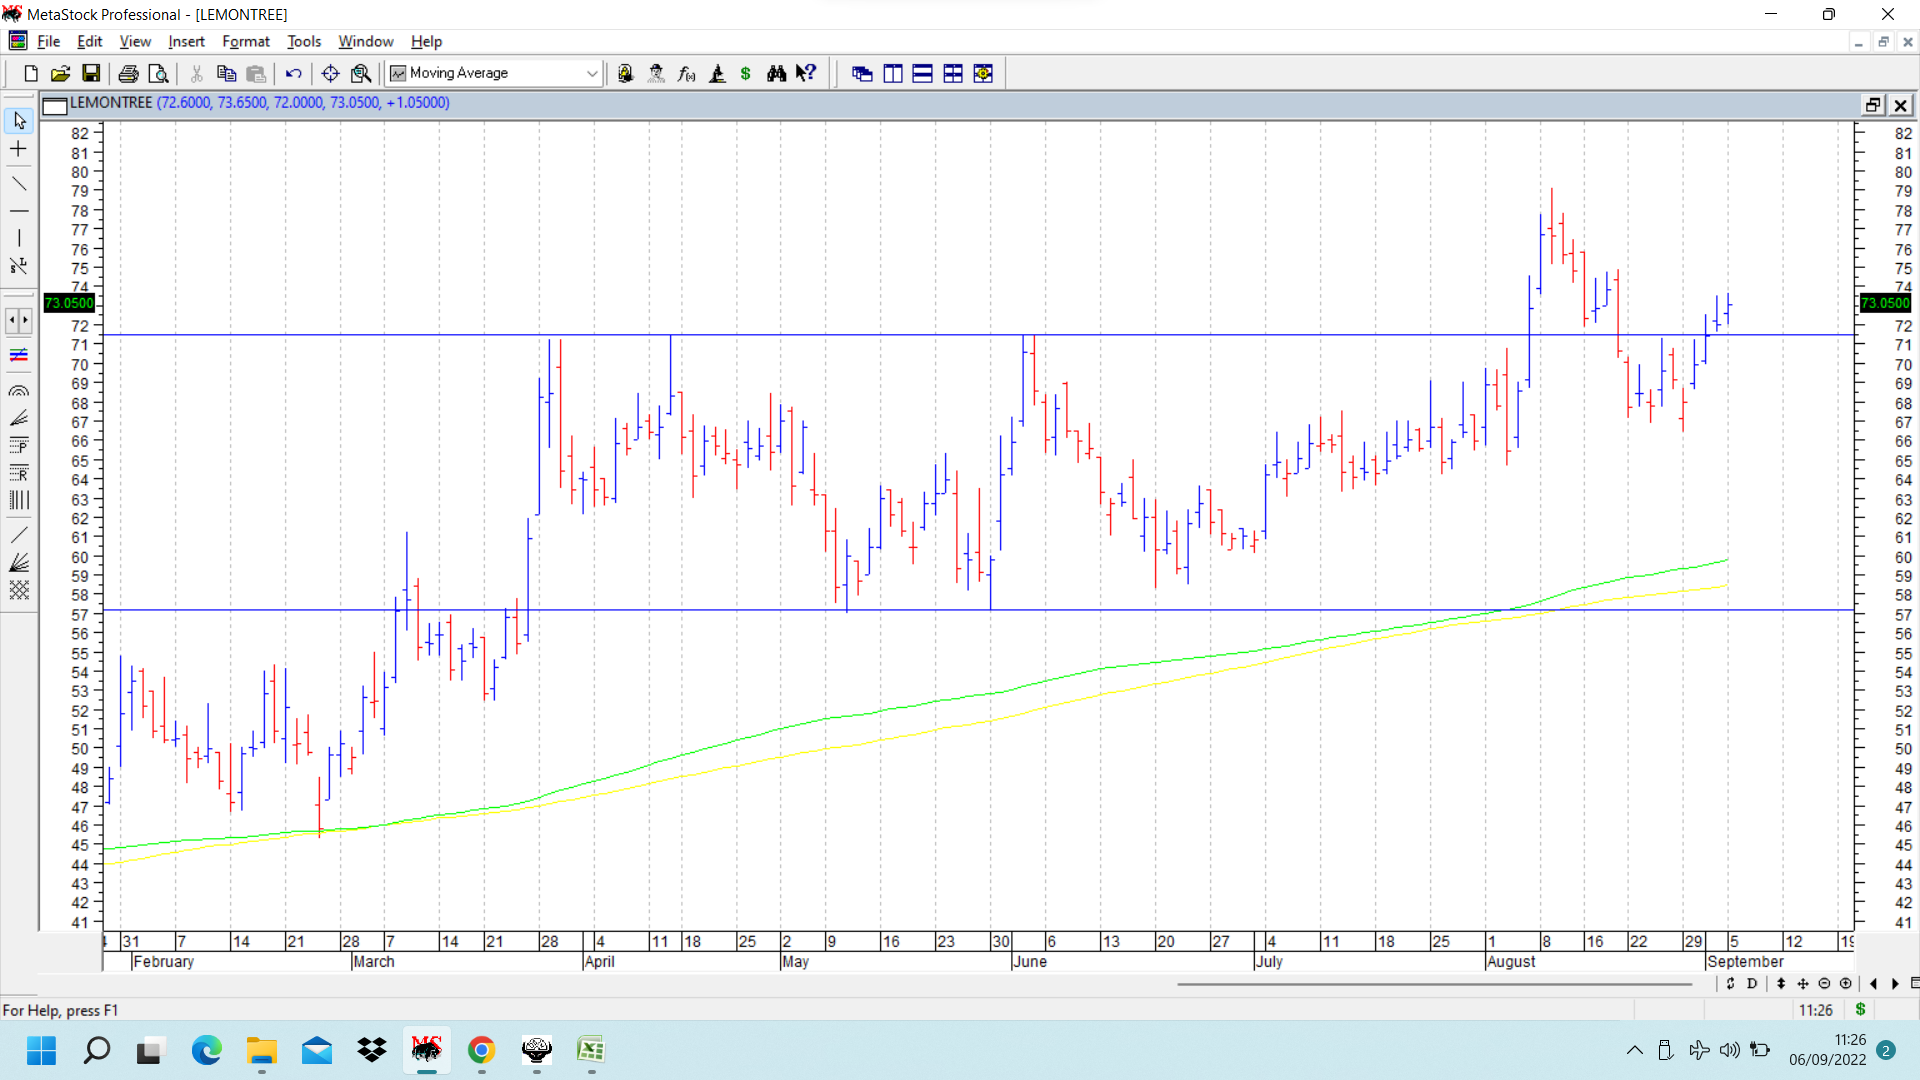
Lemontree follow up.
Stock price had broken out above the perennial resistance of 71-72 on 5 august 2022 with huge volumes and posted a high of 79.10 post that. It then corrected and went down below the previous resistance zone (which was supposed to act as support, but was briefly breached for few days in a shakeout kind of move) posted lows in region of 66-67 and resumed its upmove, re crossing the resistance zone mentioned before at 71-72.
On daily charts we have a double bottom at 57, confirmed by a breakout past 71 , going up to 79, and again a retest of breakout pattern. Now if going ahead pattern plays out, double bottom target can be close to 85-86. cmp 73. disc: invested as mentioned before.
6 Likes
In kotak bank chart, I cannot make out any pattern failure. It’s more of a range bound movement and once it breaks out of range, it can provide a tradeable move.
But in banking, leadership seems to have changed from HDFC bk-kotak to ICICI bk-sbi and the latter two might be the places to be if one wants to ride the sectoral rally. A couple of smaller banks can also be added.
In the example of bhel, stop loss can be considered as recent low of 41, if one is investing for medium to long term of say 1-3 years. For short term guys, maybe 10 percent below buying price can be considered. But these are the things one has to adjust according to their own risk reward equation.
10 Likes
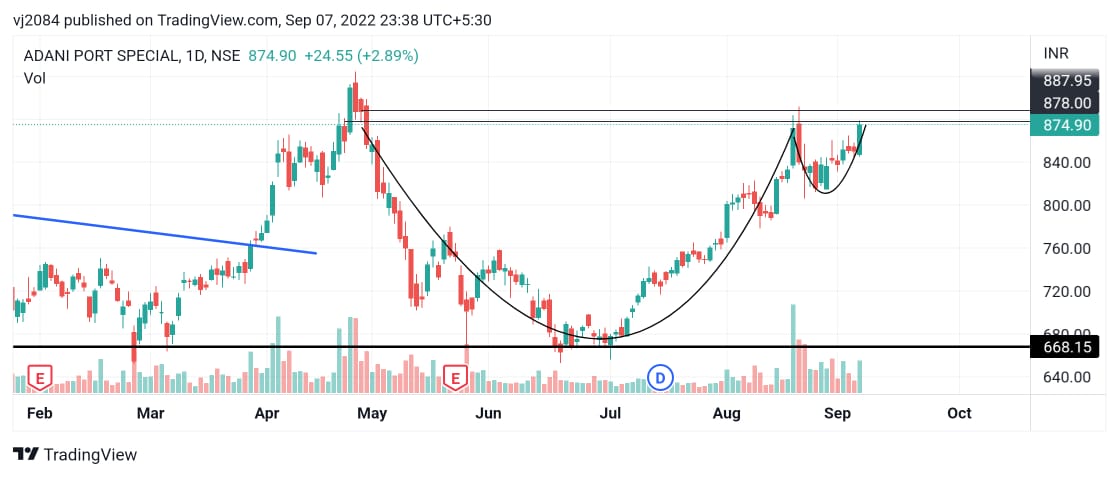
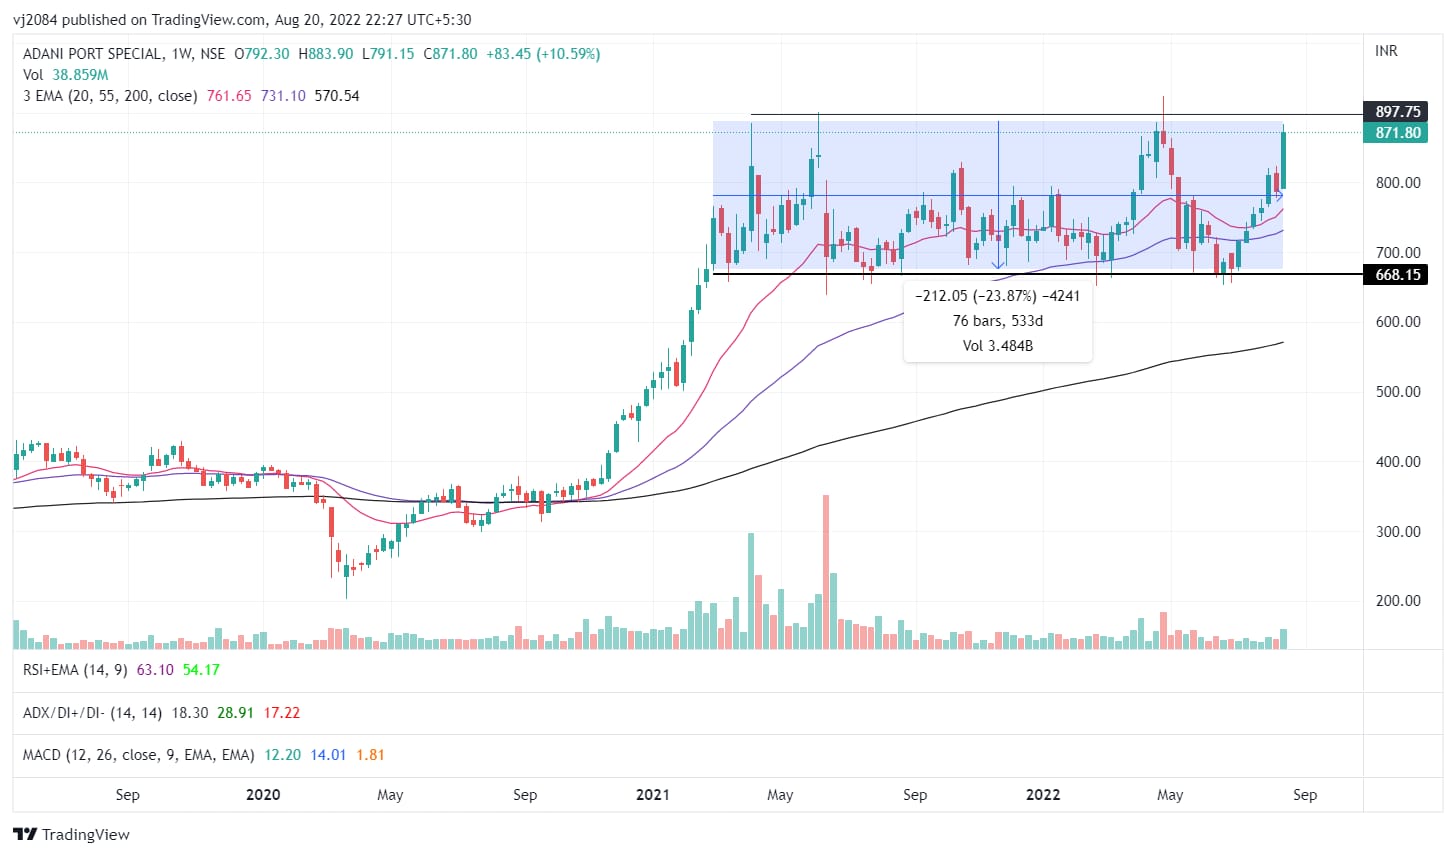
#Adani Ports near to highs CMP 880…formimg cup and handle pattern and breakout above 890-900 range. It has trading in 660-900 range for almost 15 months…depth of cup is Rs.200 so technically tgt should be Rs.1100…
Fundamentally it has posted highest cargo volumes in Jul 2022 and handles major trade volumes of trade for India.
6 Likes
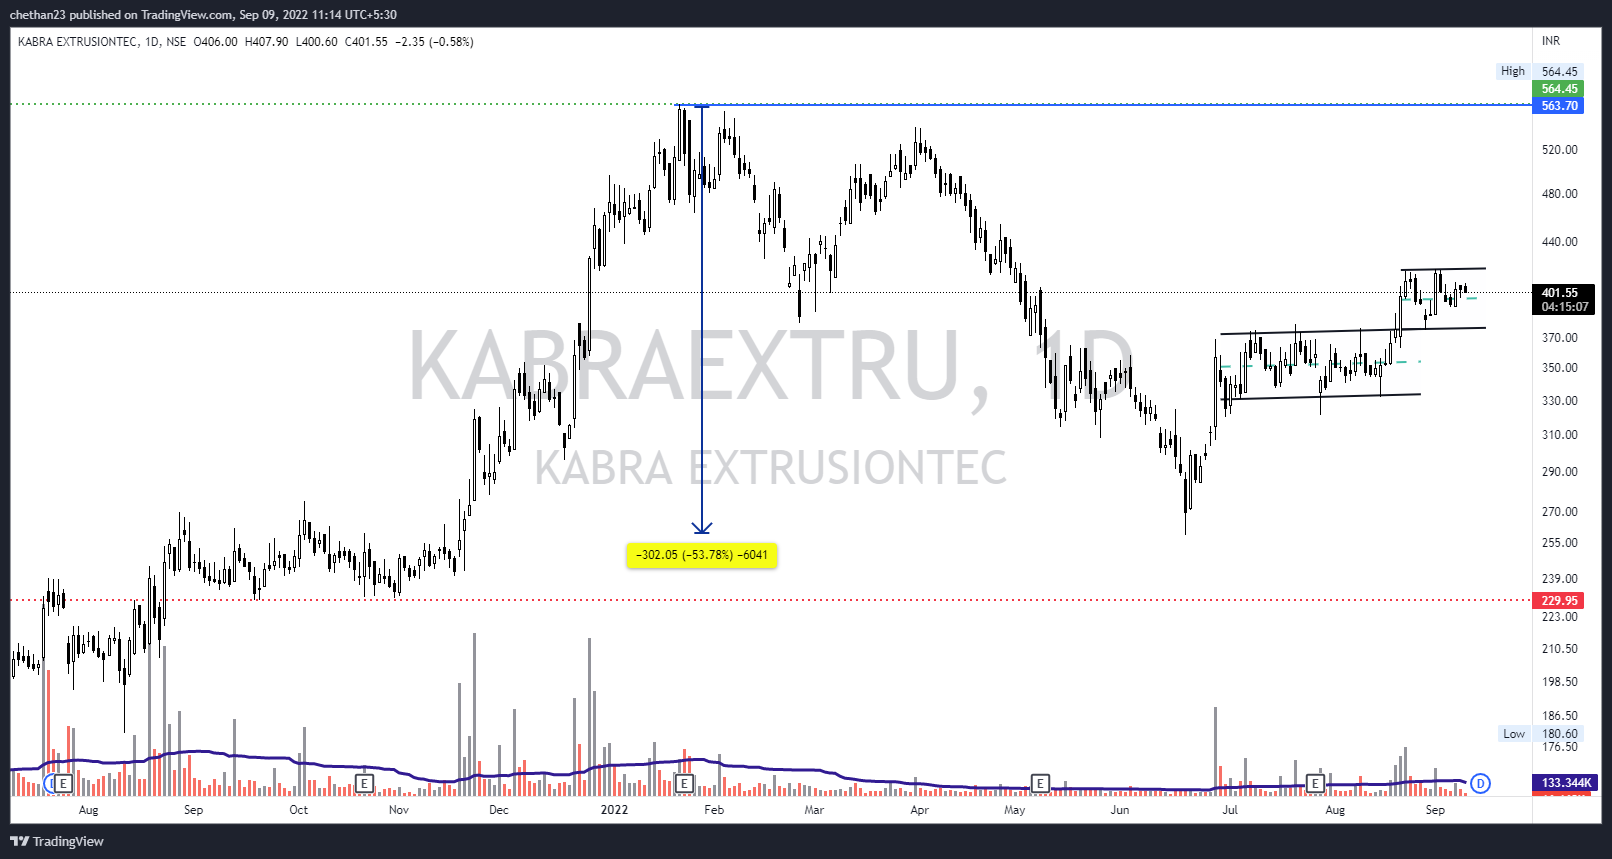
Kabra Extrusion, Price did fall around 50% from the top and then slowly moved up and formed base or stage and it did break out and now forming another base, we can say base on base , volumes seems to be drying up and whenever there is green candle or price up move volumes seems to be prominent, suggesting buying interest, price breaking out above 418 may start next leg up move.
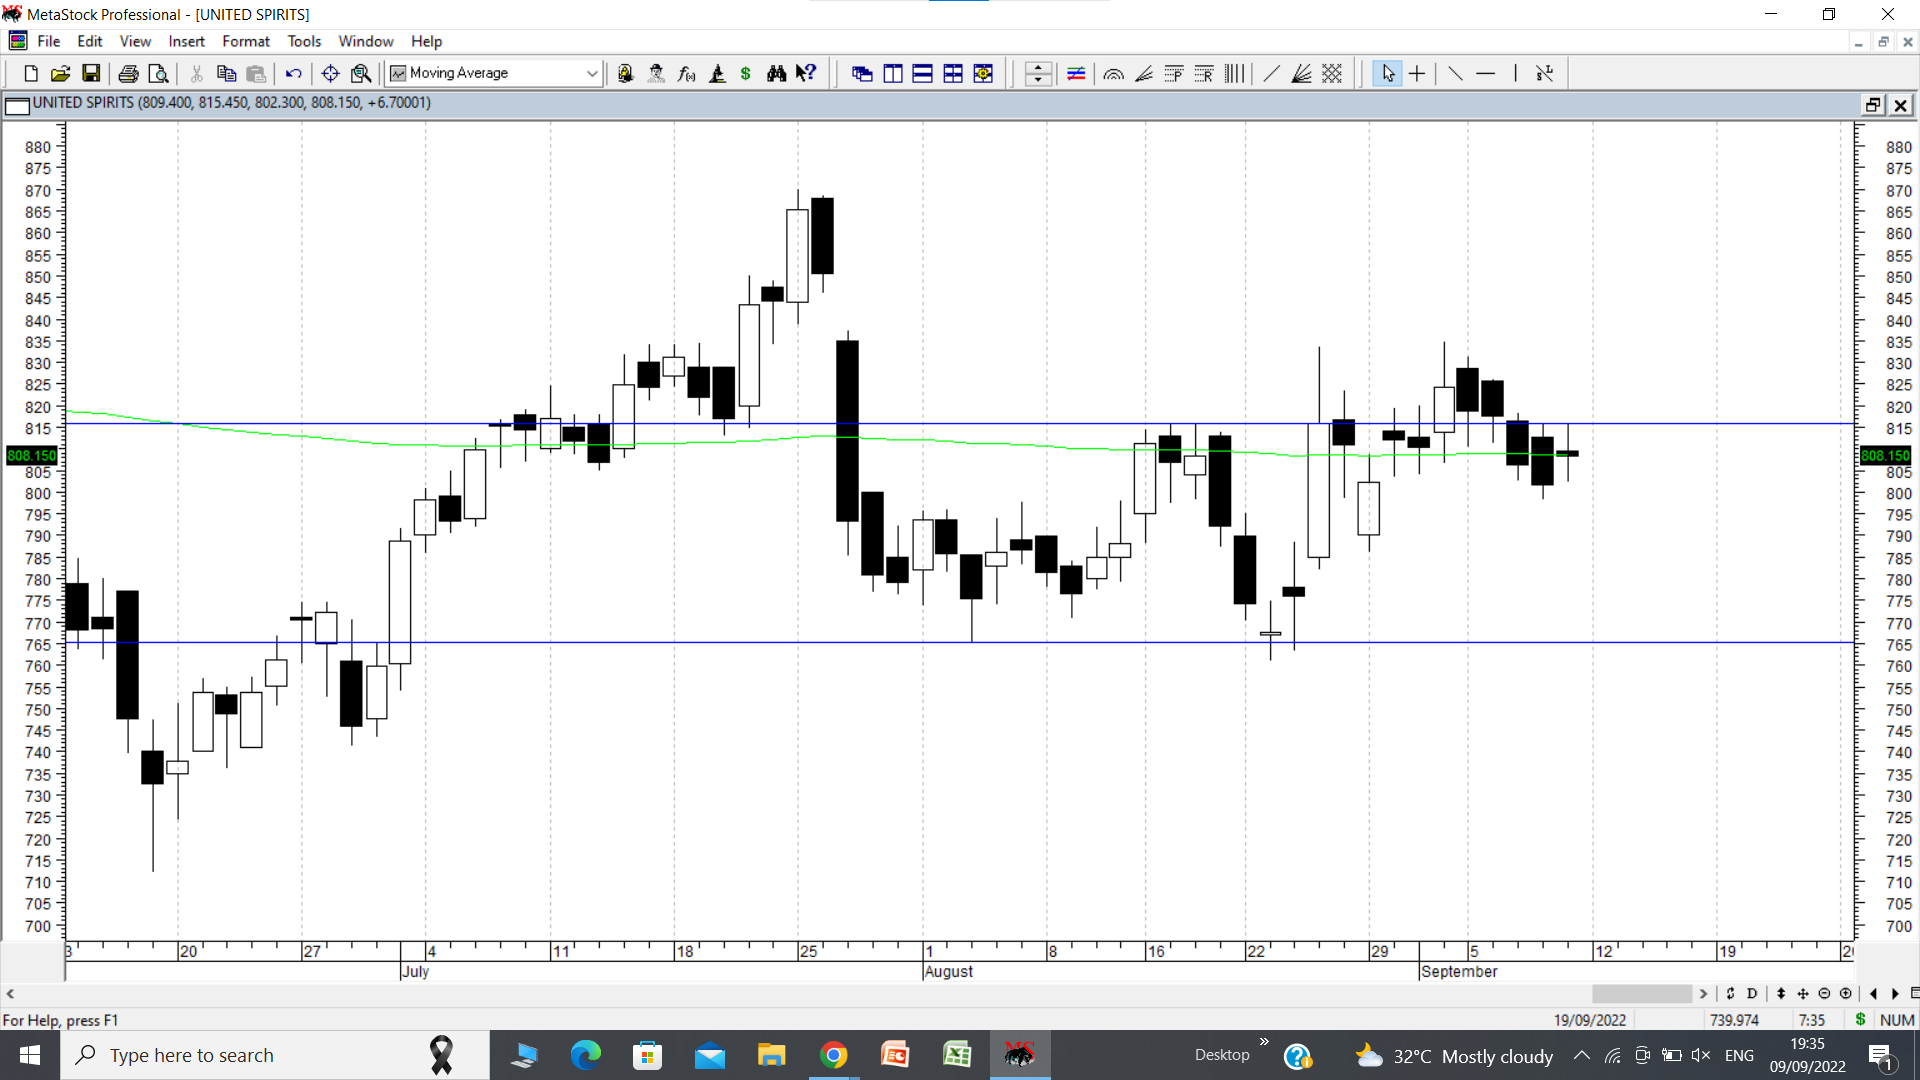
I had mentioned about a homing pigeon candlestick on Usha Martin thread when I put up its chart. Here’s another example of United spirits chart where today there is a homing pigeon candlestick. Here the example seems much more relevant.
On daily charts, United spirts staged a smart rally from 760 on 23 August to a high of 833 on 25 August and made a swing top at 837. Since then it has corrected and last 4 candlestick prior to today’s have been bearish candlesticks wherein open is much higher and close is well below that near to the lows of the day.
Today stock price opened higher, but closed lower than high (though not by too much) but still above yesterday’s close. This two candlestick pattern is called a homing pigeon candlestick. It can occur over various time frames, like daily, weekly , monthly and is often useful in detecting trend change on that particular time frame. We will keep observing for next few days, how it moves.
There is a small double bottom pattern also here, marked between 765 and 815, which if successful can lead to near term target of 865.
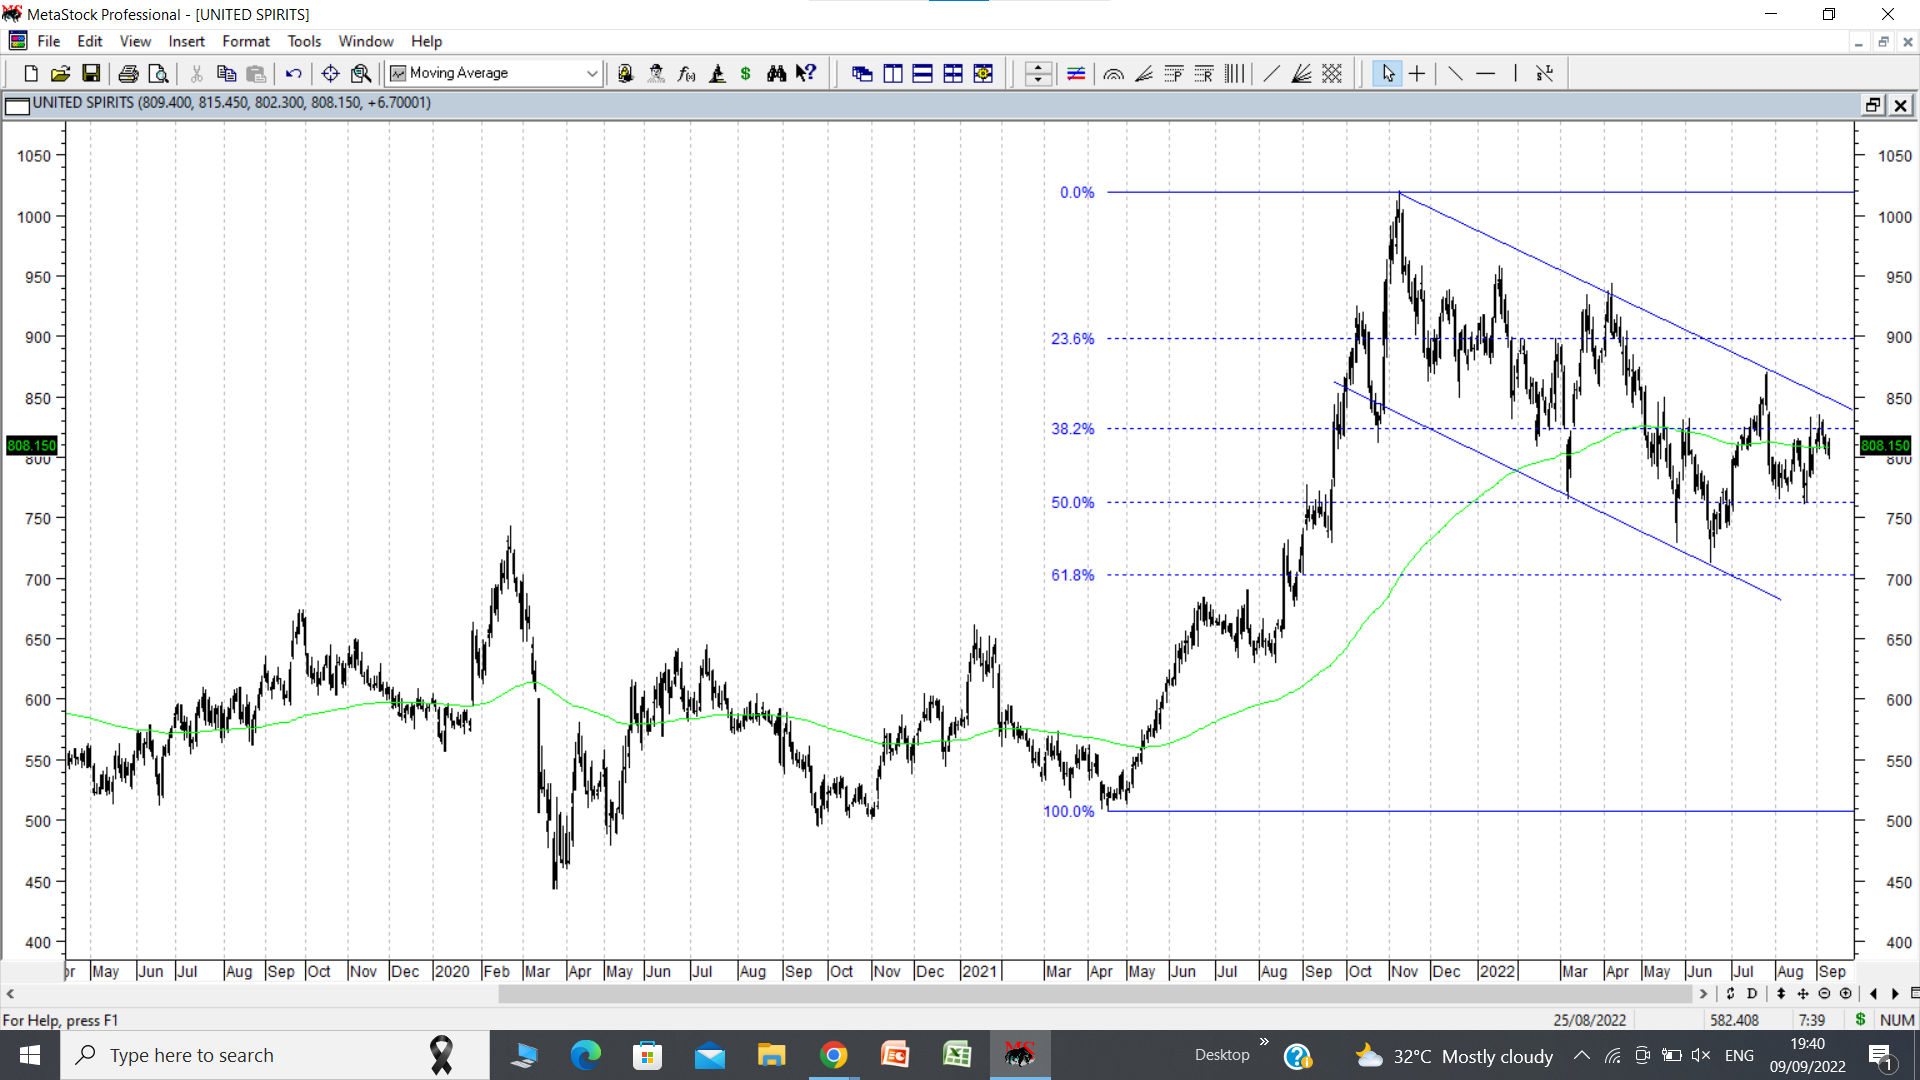
On slightly longer term time frame, we have a flag like pattern marked on chart with breakout above 850-855. Flagpole extends from 525 to 1010 and breakout point is 850. Target based on this can be 1335 if this pattern plays out. One thing I don’t like in this chart is that the flag seems very droopy though it has not corrected below 61.8% retracement of previous rally. (Ideally the flag part should not correct more than 50% , better still 38.2% of the previous rally from bottom to top of flagpole. )
8 Likes
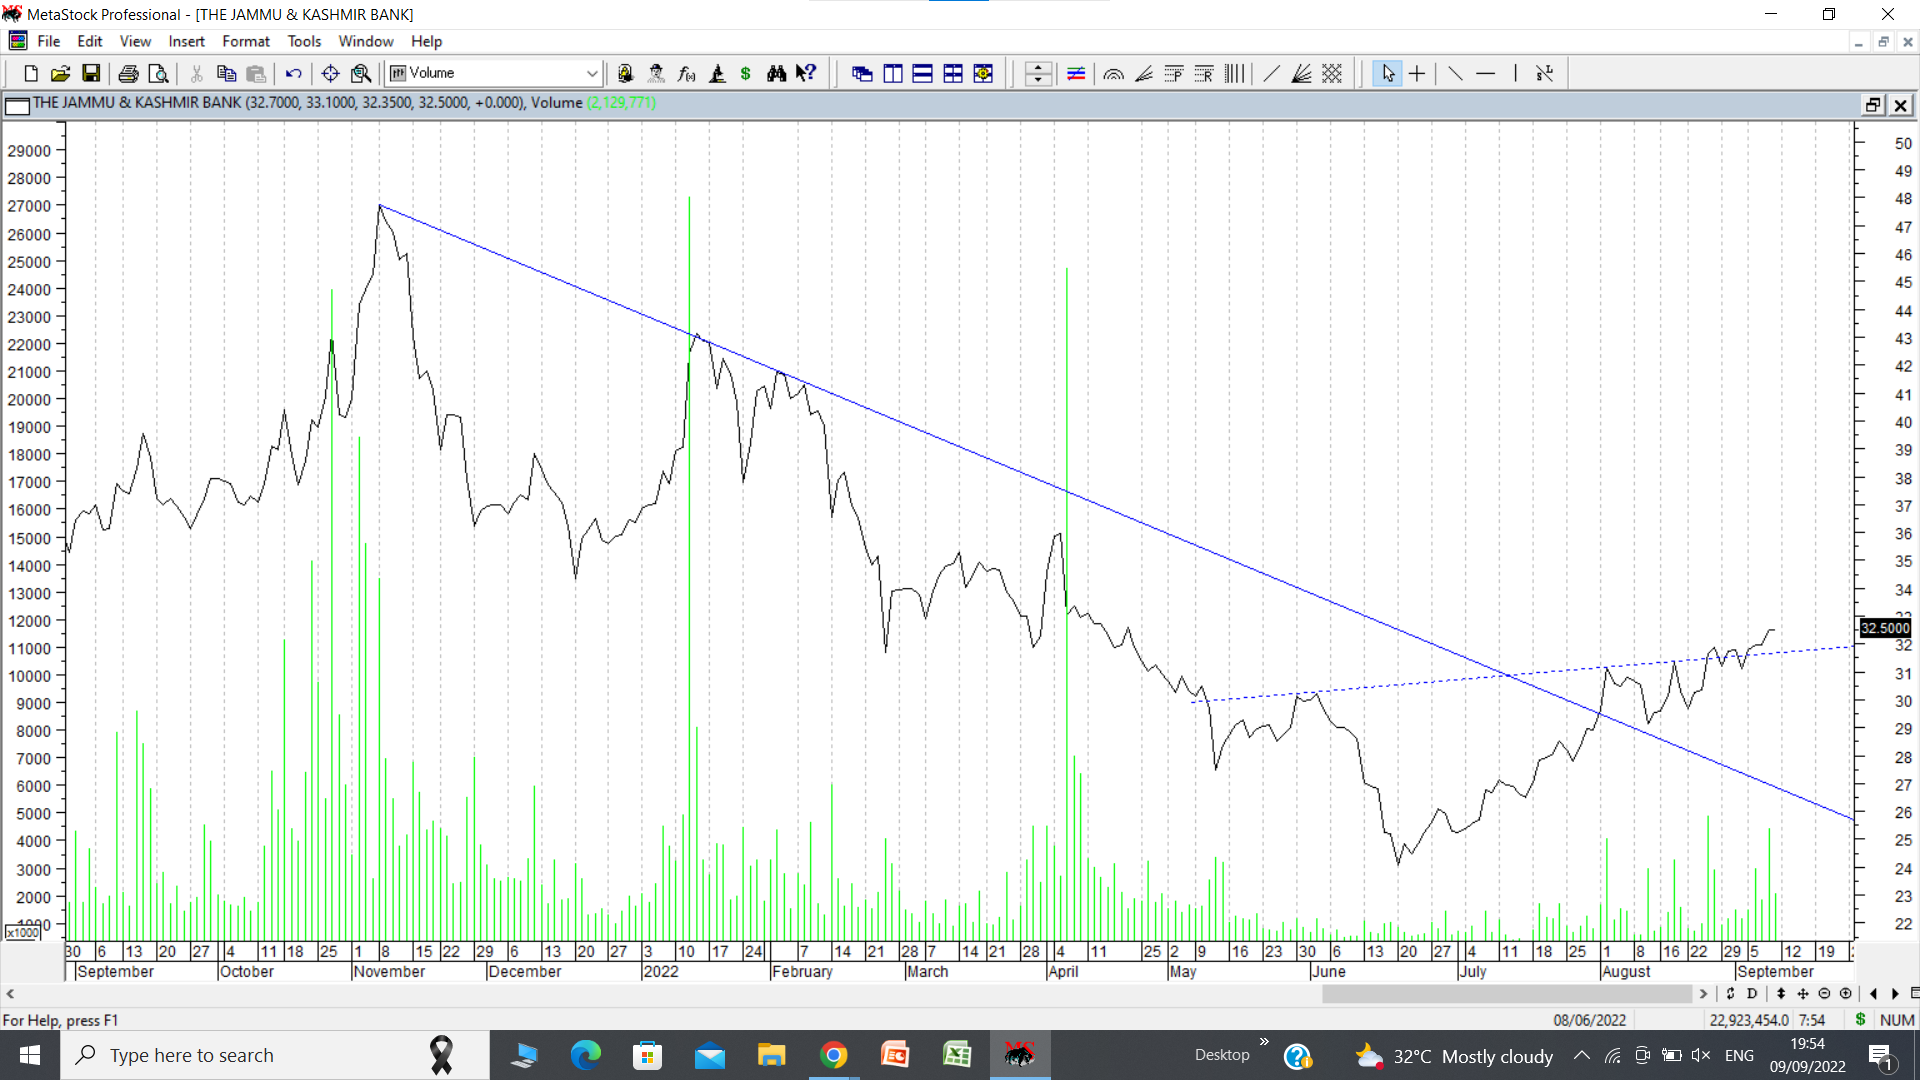
J&K Bank was mentioned in my portfolio thread as having an interesting short term reversal pattern. Putting up a line chart here, which shows two things.
- Breakout from a short to medium term falling trendline.
- Inverted head and shoulders breakout. Note the slight spike in volumes at the time of breakout above dotted line which is neckline of the pattern. Near term target if pattern plays out can be 38-39.
Fundamentals are not too conducive as is usually the case in most stocks near the bottoms. Book value is 85, however NPA remain high. disc: very small tracking position based on charts.
5 Likes