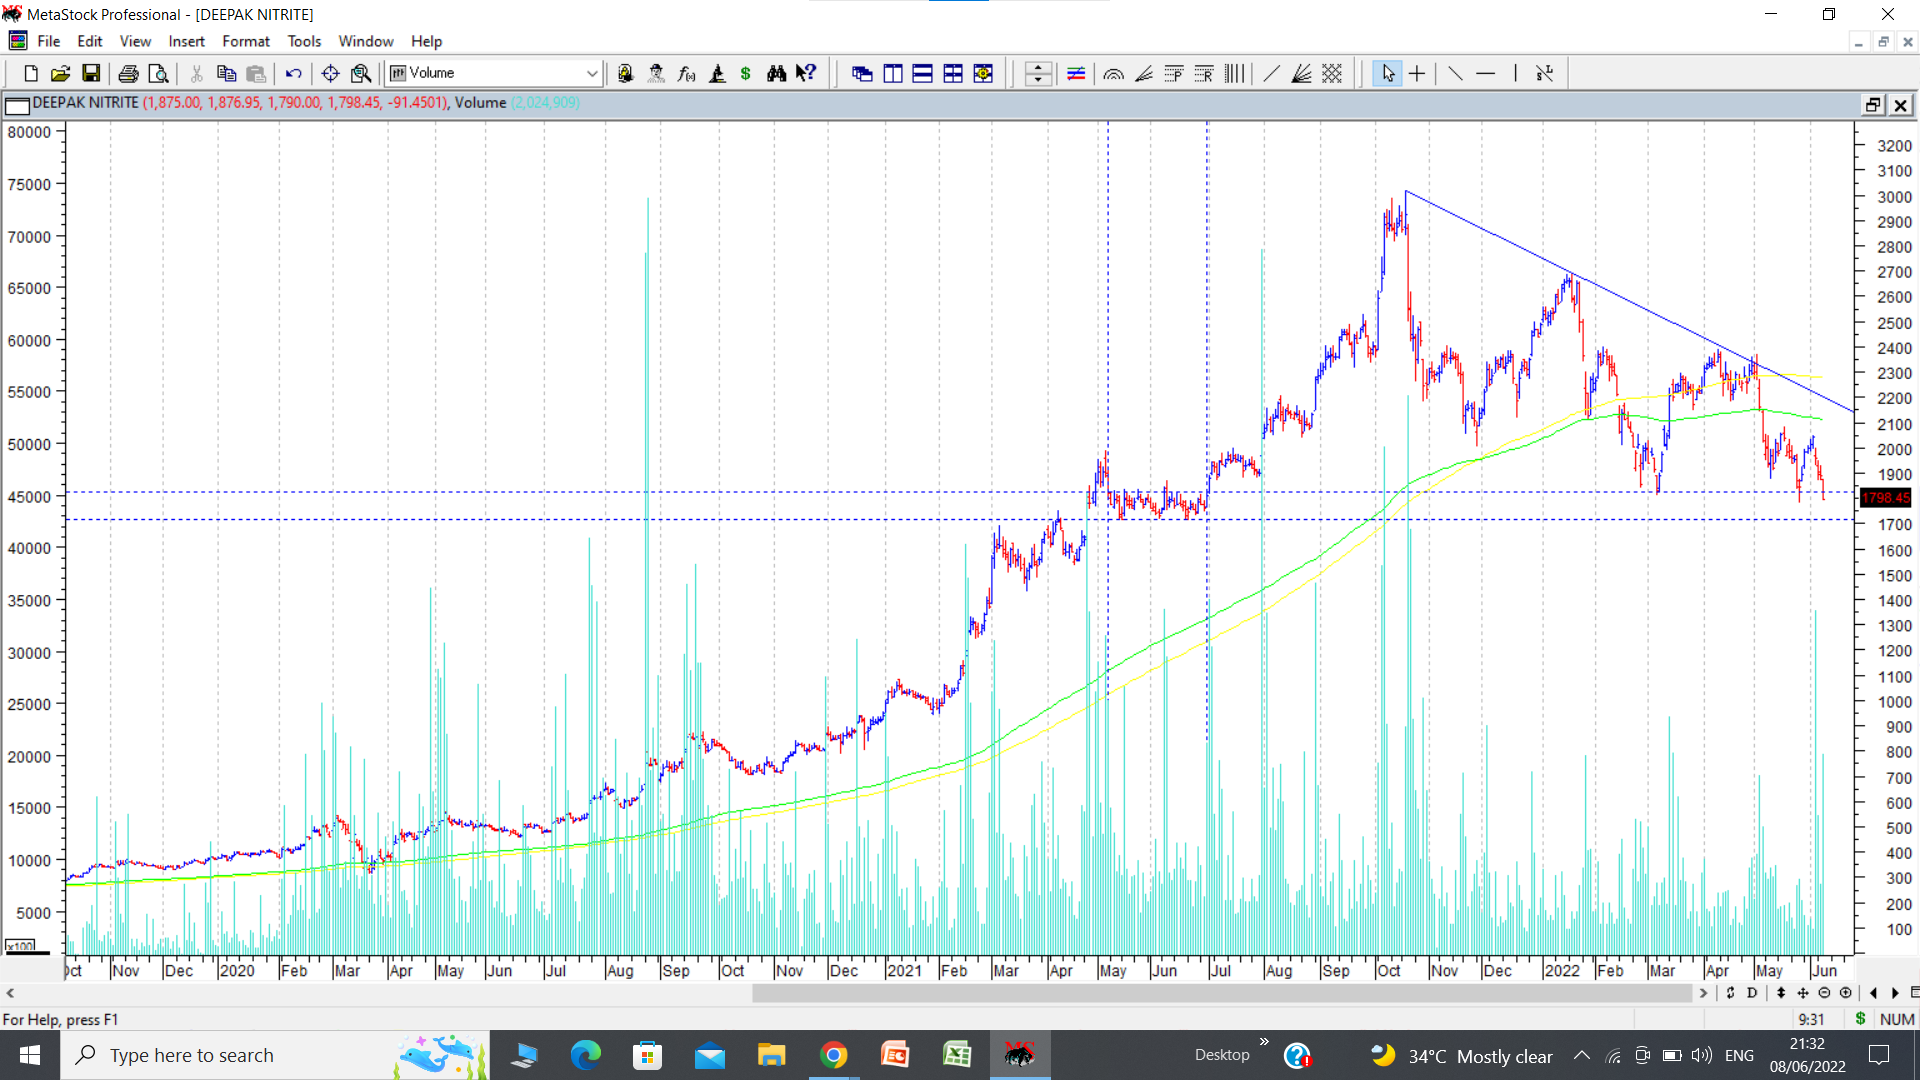
A follow up of Deepak Nitrite chart which was posted on 30 March 2022. Price then was around 2200. Today it broke down below crucial 1800 support. More worrying factor are the two high volume bars in the last 4-5 days and that too on the down days. Looks like post the accident there is a lot of bailing out being done. Could be the last of the convinced bulls getting worried due to one or other reason. (here the major worry is the impact of the recent unfortunate accident. )
Also to be noted is the area marked between two horizontal and two vertical dotted lines. This is the area of tight consolidation between 1720-1820 on the way up when the stock price made a base before the final parabolic move to 2900-3000 kind of targets. This is the area that needs to be watched for support on way down.
Again this was considered to be a SIP candidate by many seasoned investors, in some Whatsapp groups where I am an observer.
Here the distribution is of a slightly different type than the earlier chart of GMM Pfaudler which is classical and easy to recognise. disc: no positions, but academically interested to see charts of companies where immense wealth has in the past been created and a lot of even smart folks are sucked into the story.
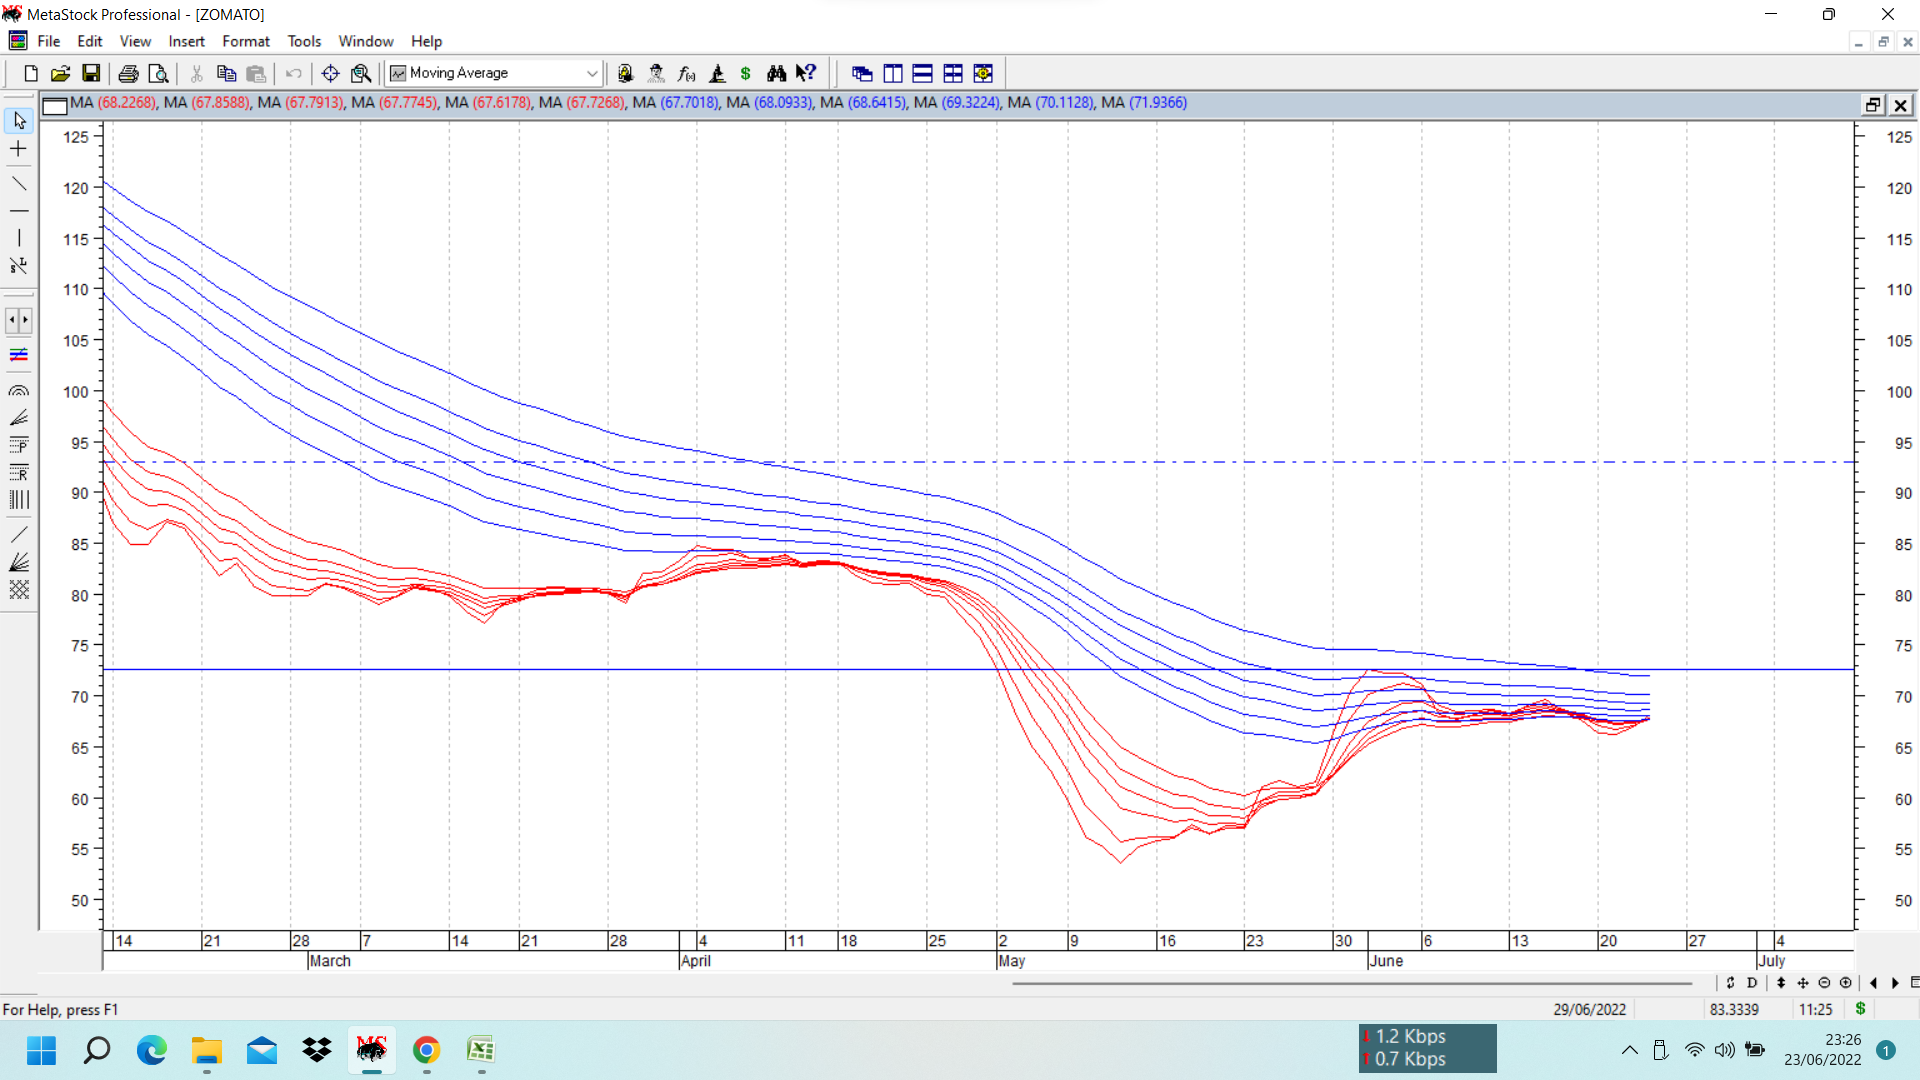
Zomato has had a torrid time since its listing. From a high of 169 in Nov 21 to a low of 50 in May 2022, it has had a persistent downtrend. Now it seems to be forming a potential cup and handle pattern. A breakout above 72-73 can provide confirmation of cup and handle pattern with potential target of 92. Putting up a GMMA chart which shows the pattern with clarity. disc: bought as a testing position.
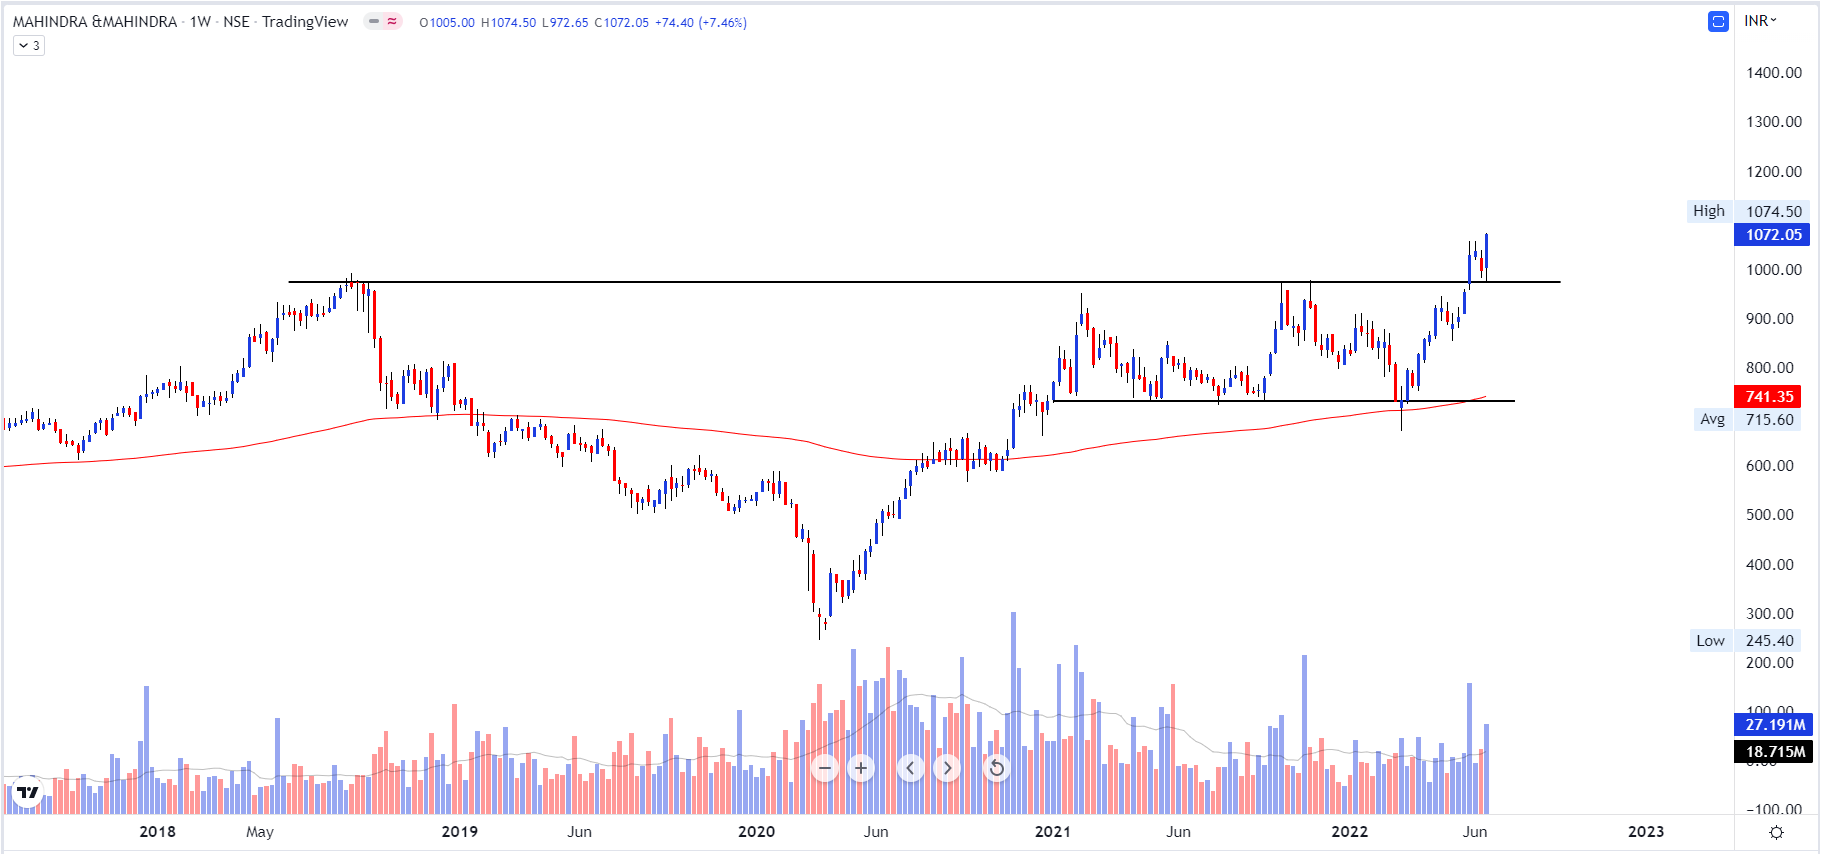
MAHINDRA & MAHINDRA
Stock recently break 52w High and currently trading at ATH also if we try to see the auto index trending strong and not much collapse during last 6 month compare with other sector
It clearly winner and outperform sector, M&M break 2018 high and showing strength and it break Cup and handle pattern Stock Support around 950 to 1000 next level it move 1200 1300 1400
Disc: Already having position in this
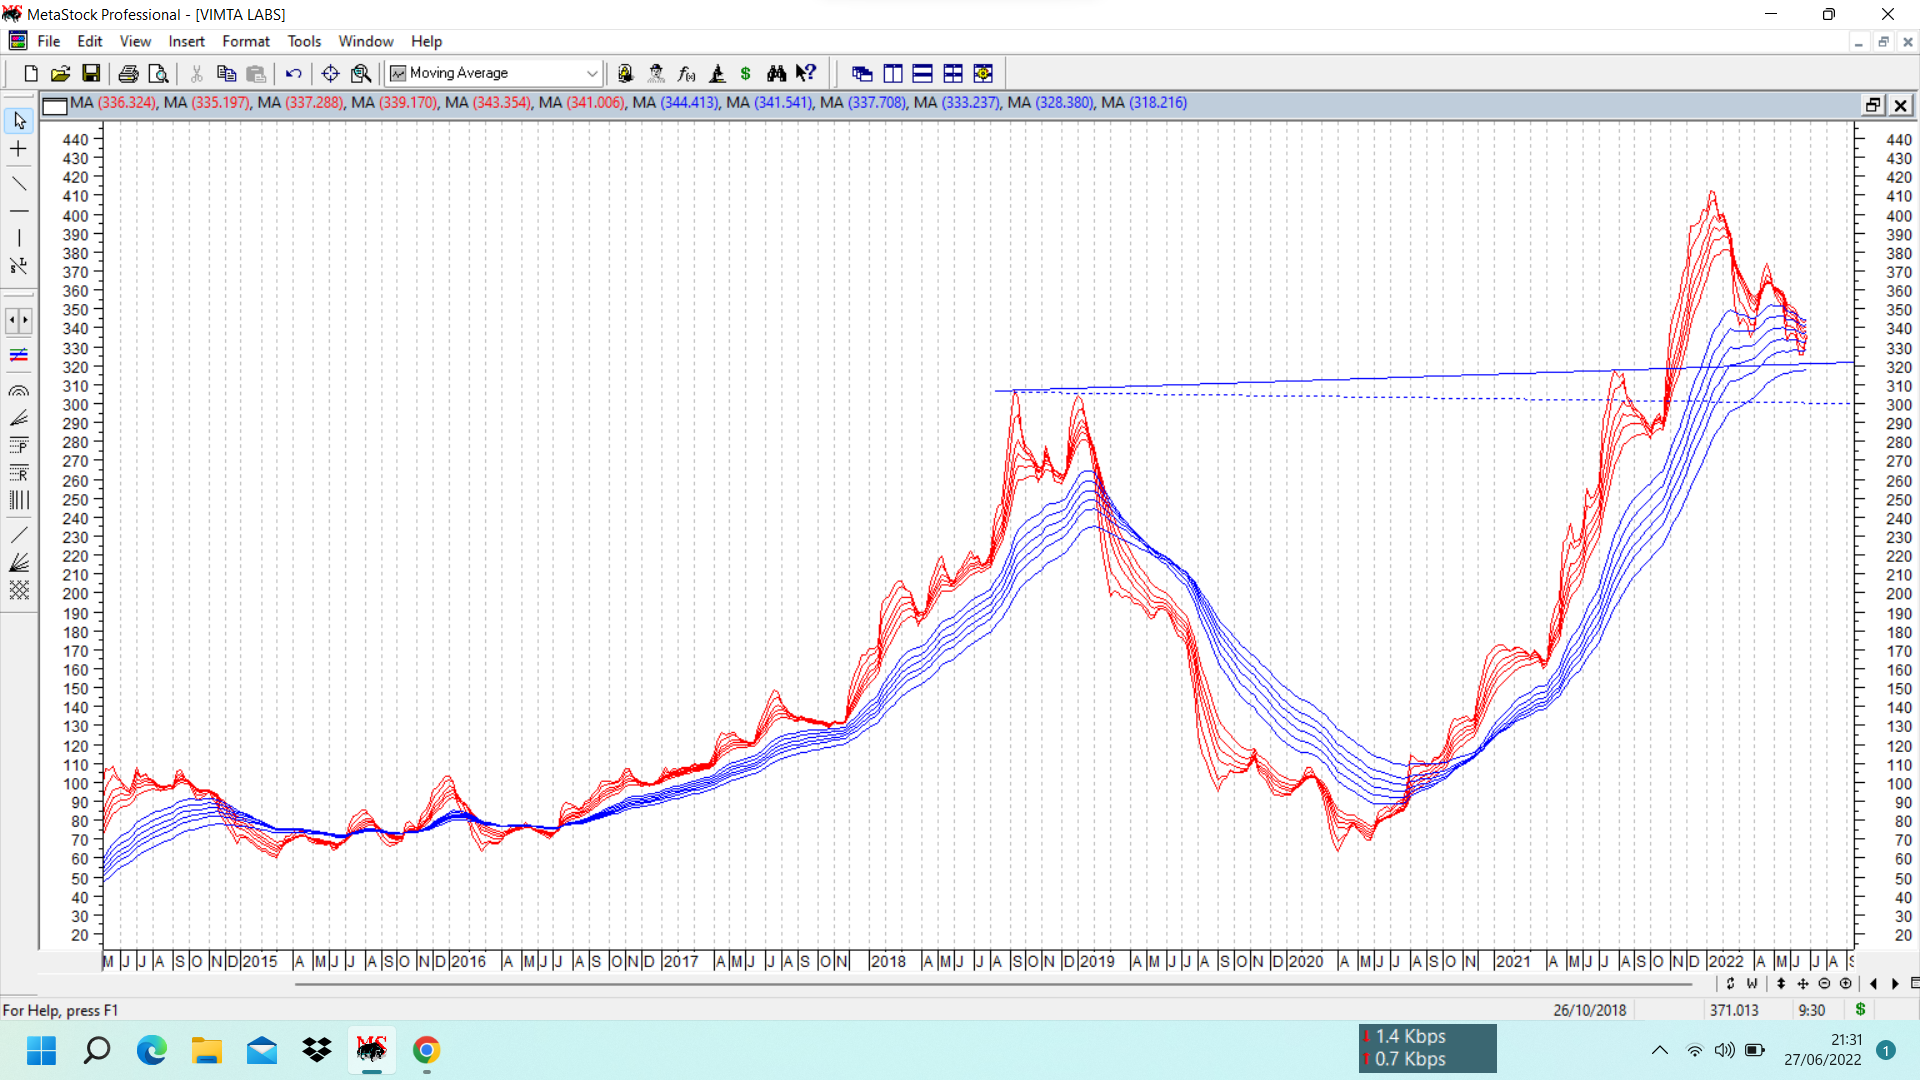
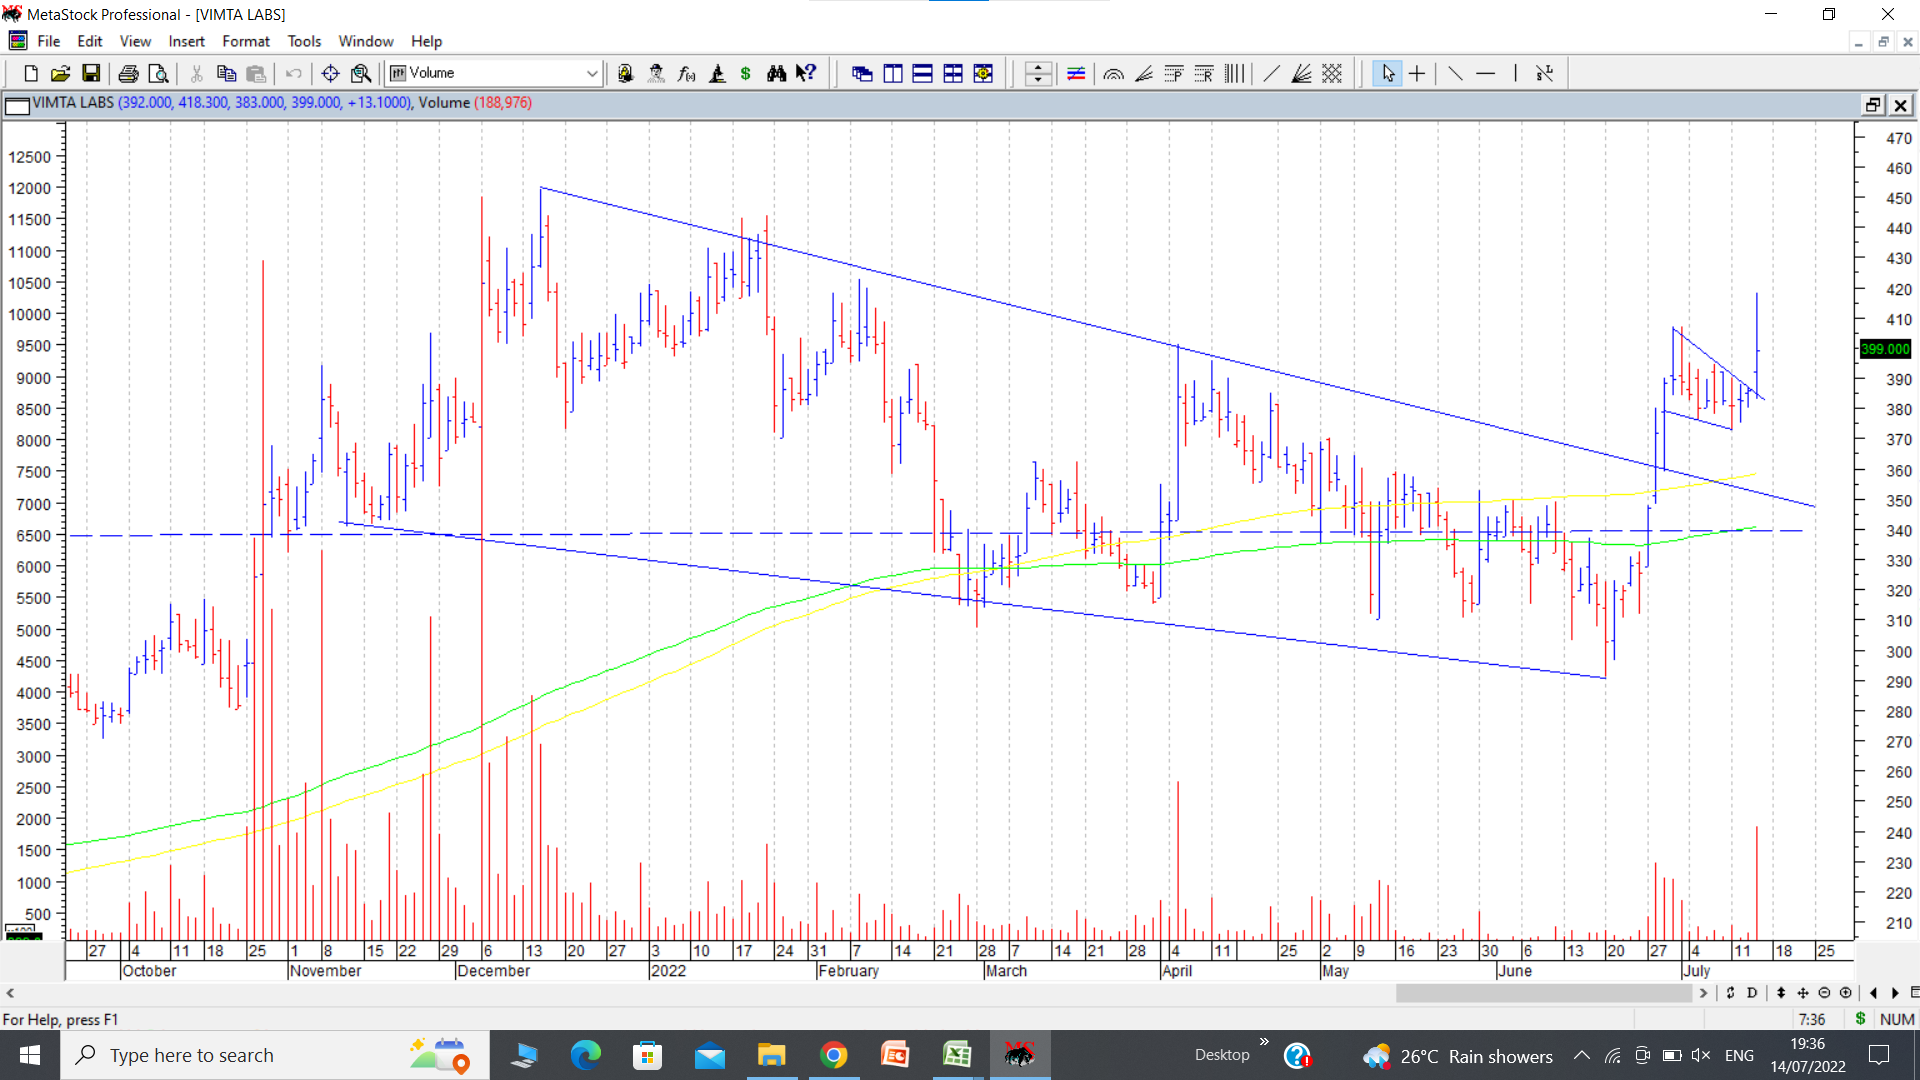
Vimta labs AGM had the management re iterating its strong growth commentary. They re affirmed their confidence in achieving sales of 500-550 crores by FY 25. They may or may not achieve this but this kind of communication gave some confidence to market participants and stock price staged a recovery of sorts today, and managed to close above 200 dema with decent volumes.
Putting up a weekly GMMA with two trendlines drawn. We can pick whichever we want, and it seems the trendline retest/support has held as of now.
The stock price still remains below the very well discussed 30 week moving average, but since the stock price has not broken down conclusively below 300, and fundamental triggers seem in place, even for FY 23, there is a case to remain invested in this one for me. If numbers do not come along, one has to be nimble enough to exit. However if numbers do come about, this is a sort of one of a kind company (a la hester) and hence things can become real interesting in that case.
The whole idea of this chart is to re iterate the importance of looking at the chart structure in conjunction with fundamental triggers, which can help in making informed decisions.
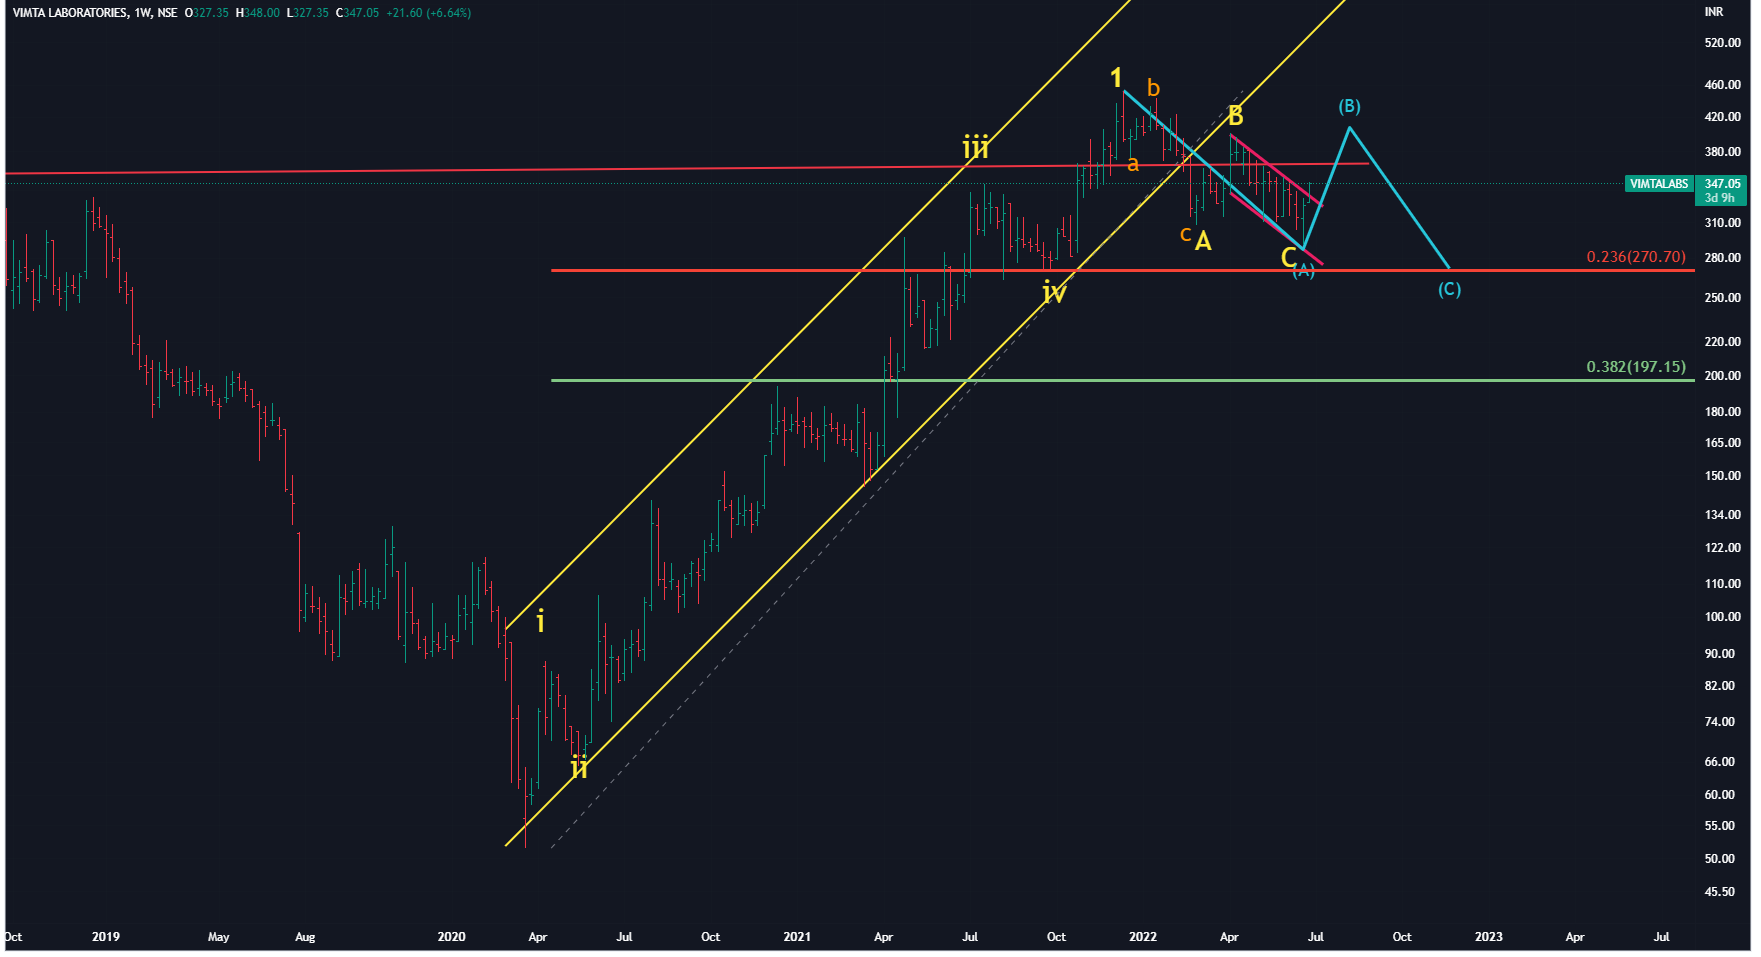
Tried to analyse the same (Vimta Labs) from EW prespective.
Key Hightlights : It seems to be in the middle of a complex correction. One should not expect much upside at least for few weeks/months as overhead resistances are quite nearby . Rather a correction can happen as it has not even corrected 23% of recent run ( Fibo levels -minimum correction) - not madatory but generally it happens.
Currently it has broken a falling channel ( wave C ) and may show some upside , but to get a significant upside move , it needs to first cross 61.8 % of recent wave B decline ( near 355-365) and that also happens to be an old resistance.
After that it needs to cross 3 more hurdles (i) 61.8 % of whole decline at 382 (ii) Wave B high near 394 (iii) then wave b high and ATH - in summary ,lot of steps .
In this temporary bounce , it can try to go upto 382 - an optimistic scenario .
If the overall market -sentiments become bad (as per EW , small and mid-cap are yet to complete their correction) it can get into bigger correction.
It can get into a double zig-zag type correction and come near to the lows of wave IV of the previous leg i.e. 270 and that also mathes with 23.6 % of Fibo levels as shown on the following chart.
Diclaimer: These charts are for study purpose only. No one can predict the exact path of a stock. One can only think in terms of probabilities - and these probabilities may come out wrong.
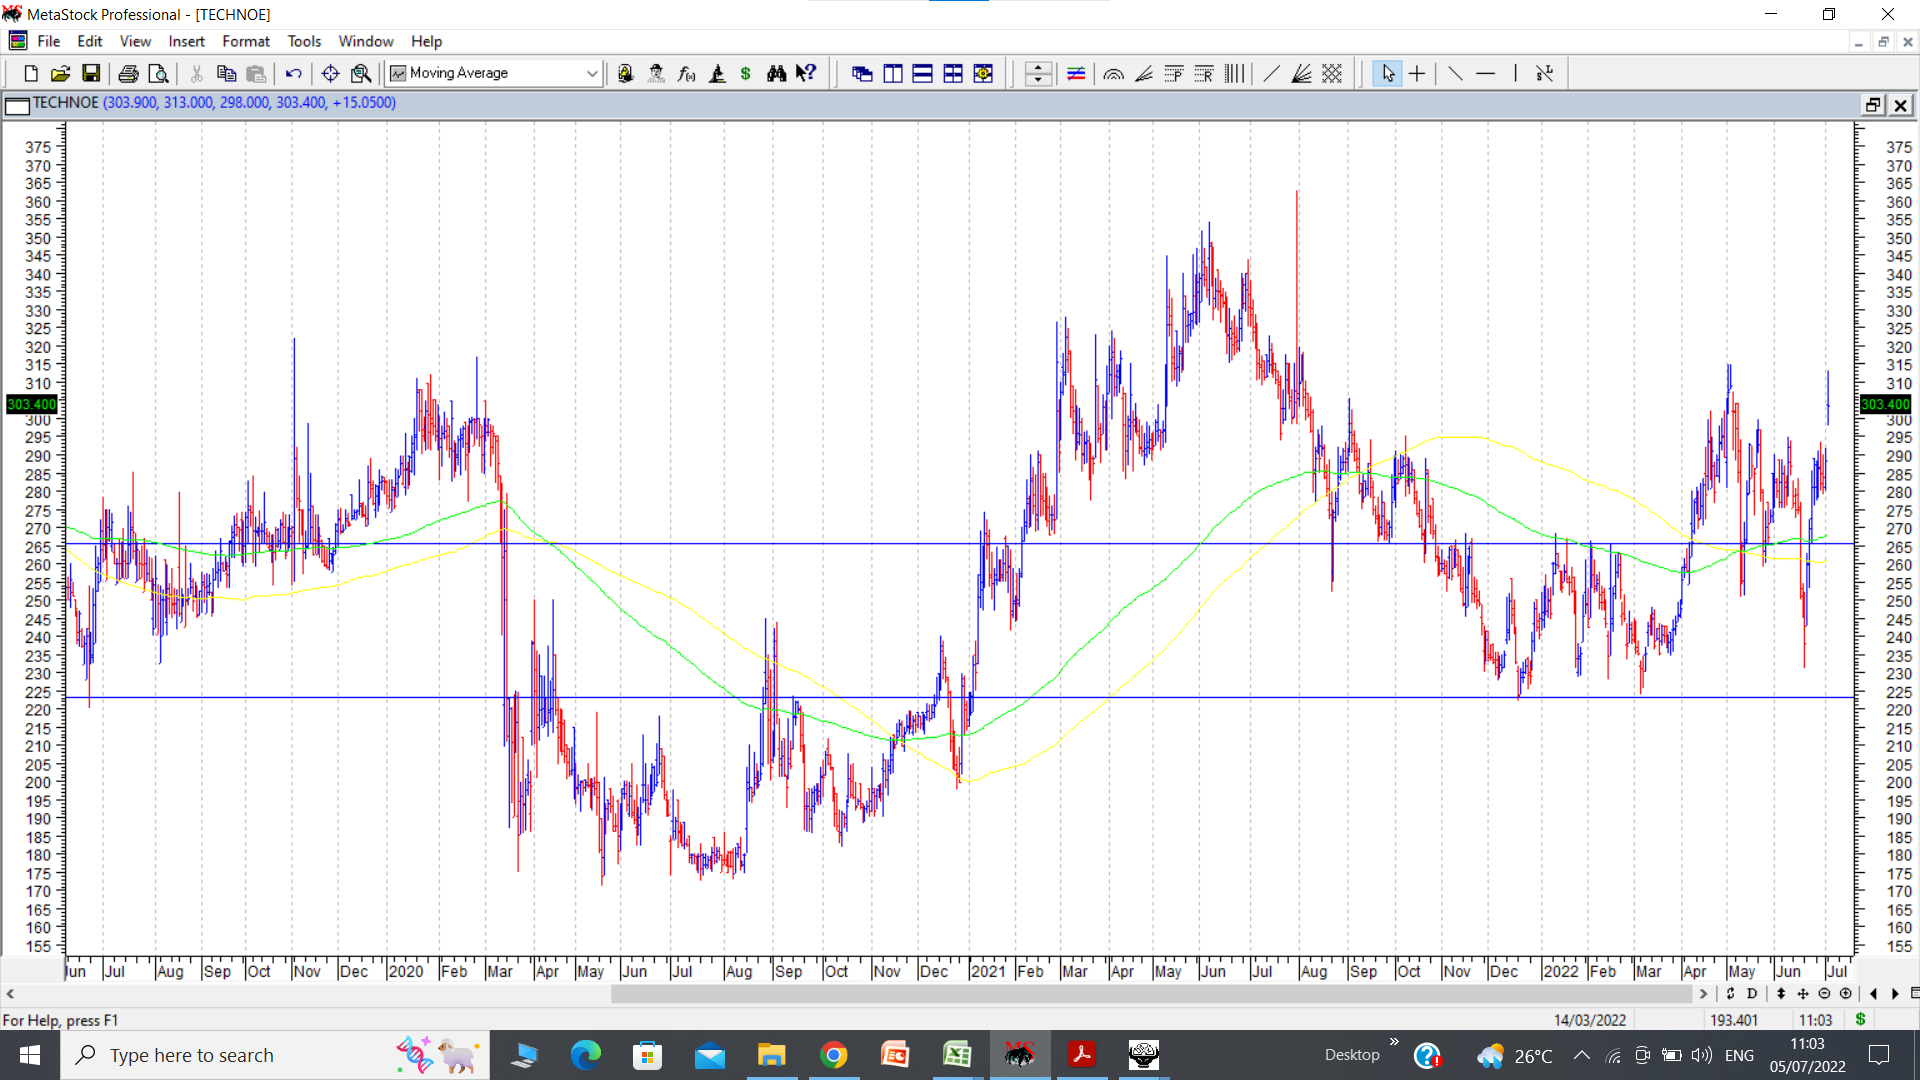
Techno electric is an EPC company run Mr P P Gupta, a veteran and a respected person in the field. In the latest concall, promoter talks about doubling of revenues in next 3 years. Near term triggers would be FGD orders and medium term triggers would be the Data Center in Chennai, powered by its own green energy. Company has cash and equivalents of 1200 crores.
Technically stock price made a double bottom at around 224, which got confirmed on breakout above 265. This whole double bottom happened between Oct 2021 and April 2022. After breaking out from double bottom,stock price hit a high of 314, and then during the panic of June 22, made a higher low of 234 and quickly rebounded from there. It seemed like a shakeout move. Yesterday, stock price gapped out above 300 and now seems to be at interesting levels close to 300-310. In last few weeks it has shown good resilience as compared to overall weak markets. disc: bought as a techno funda bet. Those contemplating fundamental research would find q4 fy 22 concall transcript useful.
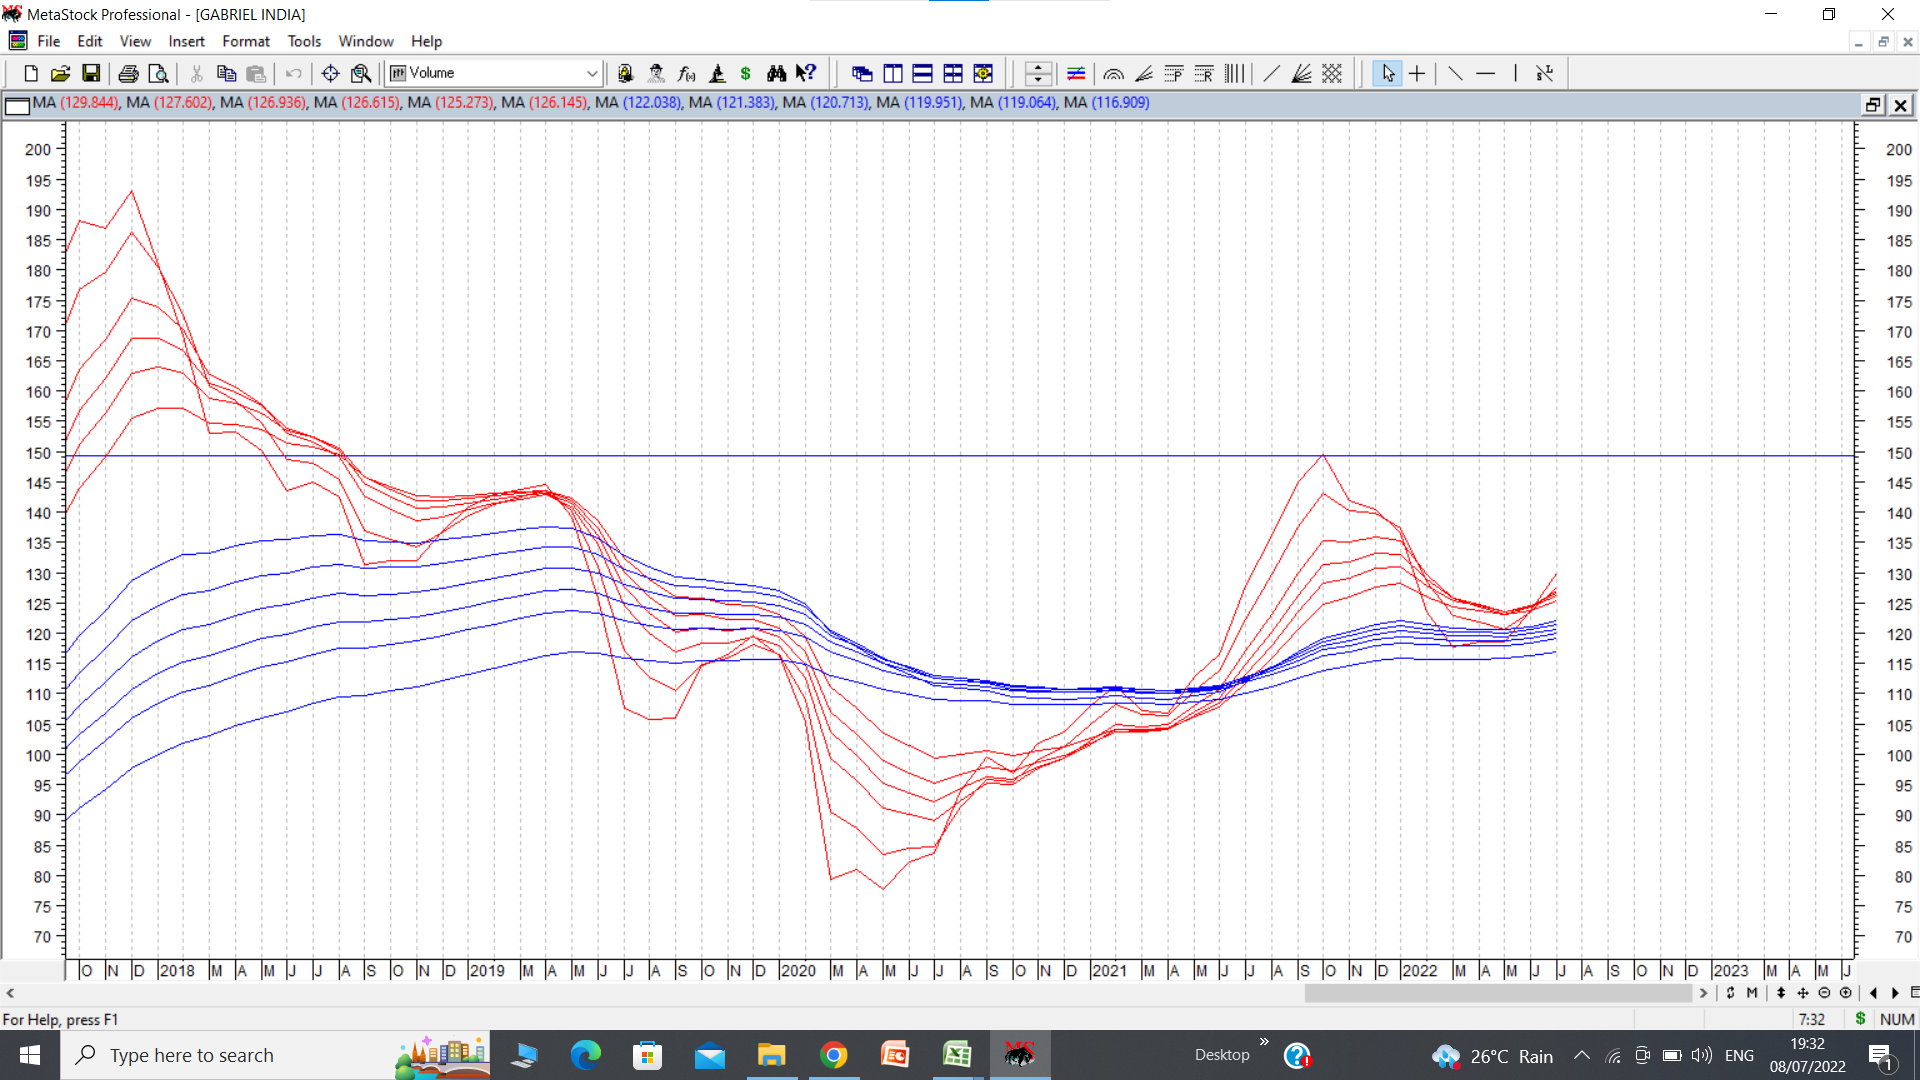
Gabriel India is an auto ancillary company which has a dominant position in auto ancillaries space especially in shock absorbers. Cmp 136 . Auto and auto ancillary companies have been on a strong run and this looks like a sectoral move going on. Putting up chart of Gabriel India. It is a monthly GMMA chart with possibility of a cup and handle pattern breakout above 150. If it does indeed cross 150 and pattern plays out to perfection, target can be around 220 in the medium term. Note that this is monthly chart and results have to be expected in months. On GMMA monthly charts, the short term moving avgs in red have compresssed and broken out on the upside and all this while support has been taken from long term moving avgs in blue . This kind of pattern often provides early entry if taken with appropriate study and stop losses. disc: bought as a techno funda sectoral bet.
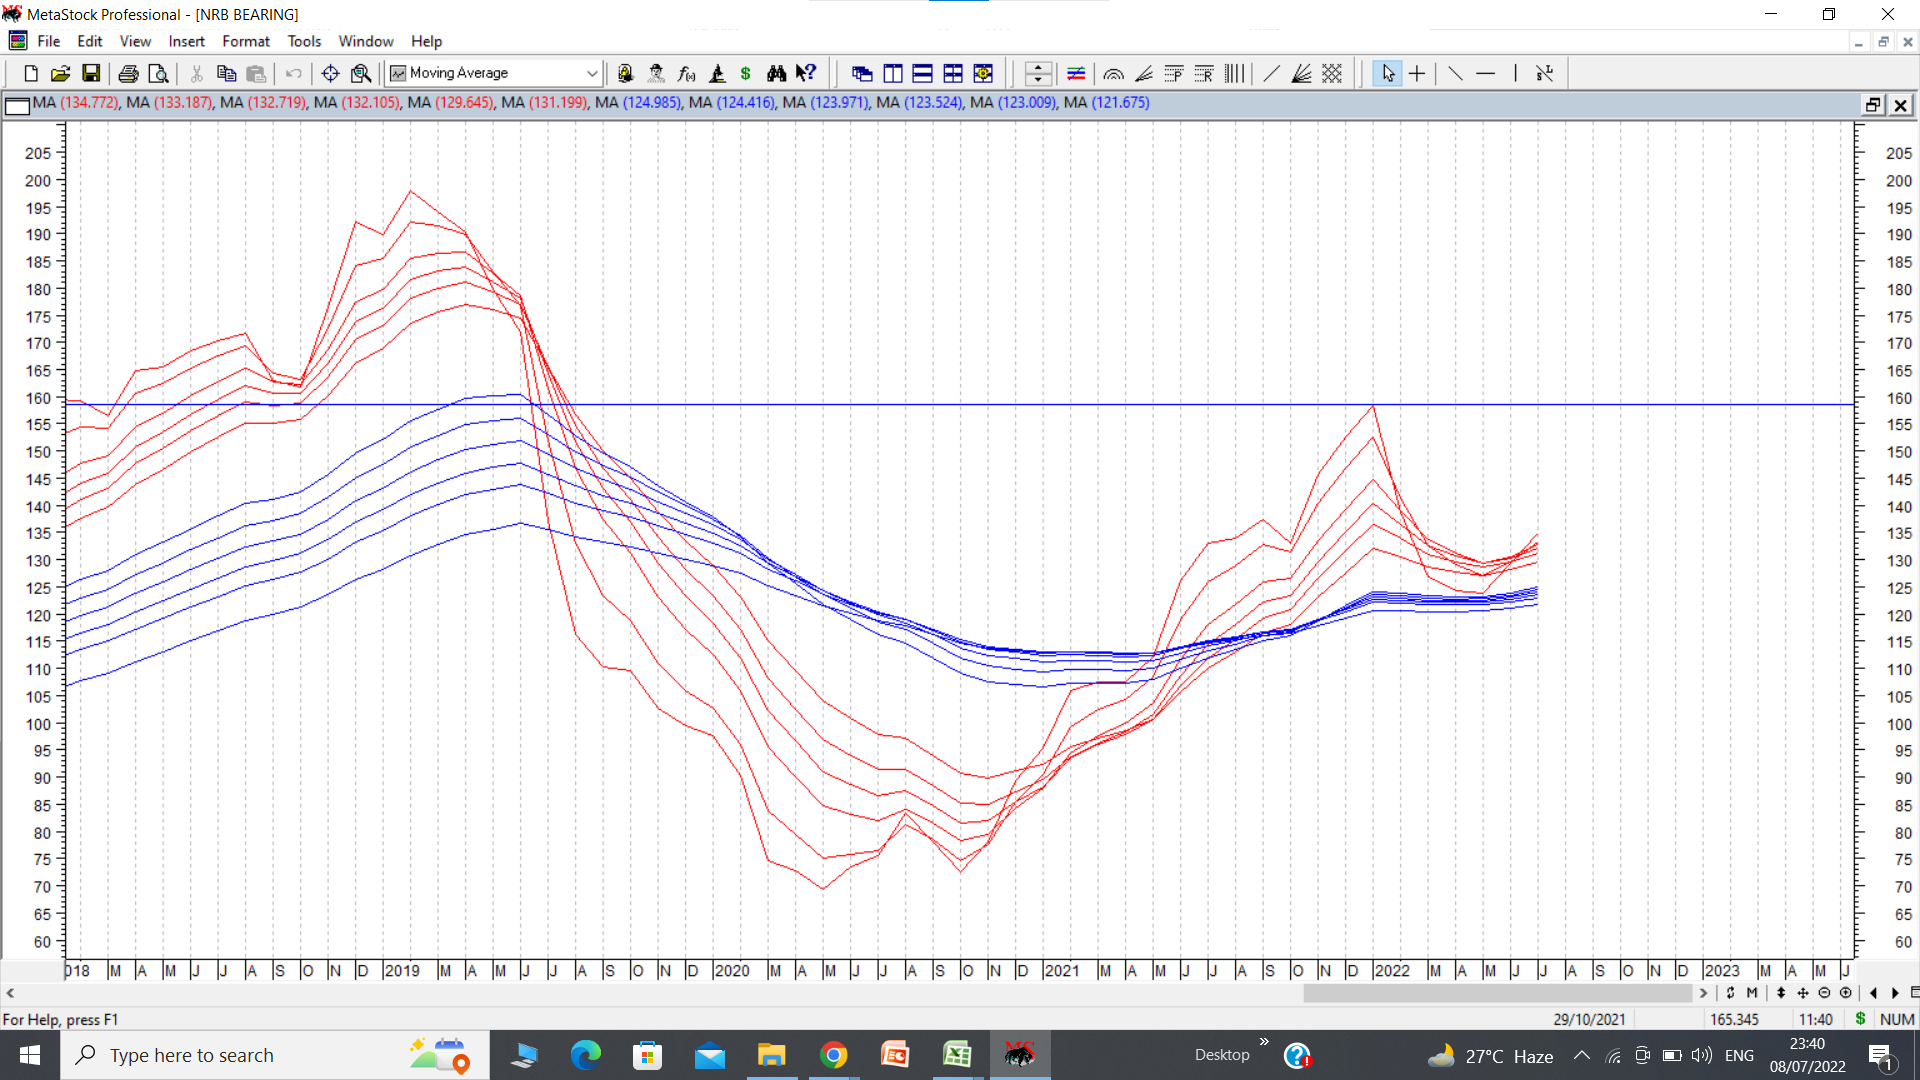
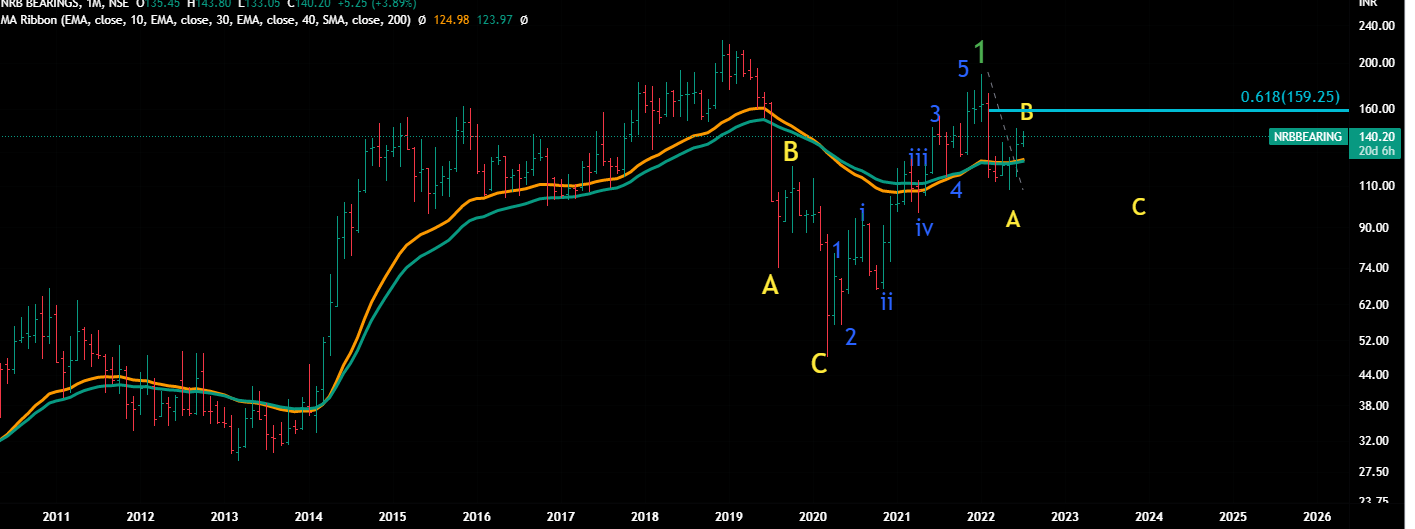
A chart very similar to the above chart of Gabriel India is that of NRB Bearing. Company is mainly into bearings for automobiles and is largely an auto ancillary play. In their presentation, management mentions an important growth driver in the form of launch of hybrid vehicles especially in foreign markets. Even in Indian markets, auto makers have started launching pure hybrids which do not have the hassle of electric charging and still give high fuel efficiency. It might/might not catch car buyer’s fancy.
On the monthly GMMA charts attached, the short term moving avgs in red have compressed and broken out on upside and longer term moving avgs have offered support on declines. Above 160, there is a possibility of a cup and handle breakout on monthly charts. Current price is around 140. Stock price has closed above 30 WMA which is at 135 but 30 WMA is yet to turn up. If the longer term monthly cup and handle pattern plays out, and there is a successful breakout above 160, there can be potential targets of 250 on the longer term. But for these targets to be achieved, it will need strong sectoral tailwinds and overall market strength. Plus there can be some whipsaws on the way which one might have to digest. disc: A small token position, to test the pattern. Not an investment advice but posted because two auto anc cos are showing nearly similar patterns.
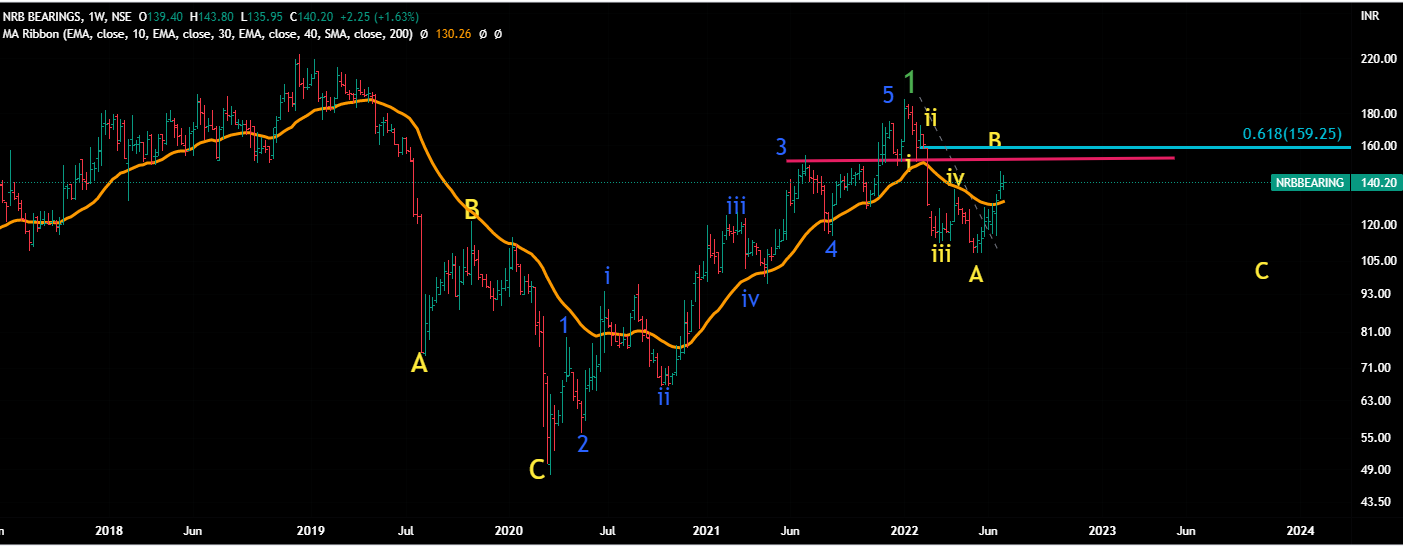
Same goes with NRB Bearing – but the chart is better than Gabriel as it has a clear 5 wave rise after COVID… but still could not close above 78% fib level of retracemnt.
It also seems to be in ABC correction… it will be proven wrong if we go and start closing above 61.8 % fib level retracement (160 ) of recent decline. And the should cross its recent high (188) and then Dec 18 high - in short lot of challenges on the way.
On weekly chart, it shows 5 waves correction in wave A, so it might give us a Zig Zag correction - B wave rise ( currently going on ) then fall in C wave in 5 waves.
Also there are closeby resistances at 152 - so although it is above 30 WMA , but it needs to break the trading range as well as need to cross and close above 61.8% fib retracement level.
Hi Hitesh Ji - Had a long term EW analysis of Gabriel
Not very encouraging.
On monthly chart, it is clear that we’re in 4th wave since 2017. It made a low during March 2020 (covid) but after that it went up to 170 …but the rise does not look like 5 wave rise.
As EW theory , if the rise is not impulsive (5 waves) , the stock is still considered in corrective phase.
Another indication is thit at looks more like B of larger ABC as it never gave a monthly close above 61.8% retracment of whole decline ( decline from 2017) .
Now after giving a bounce in B wave , it again gave a correction (from 170 to 102) in 5 waves - as clear in the following chart - that can be considered as (A) of larger C and now it is bouncing back in (B) of Larger C.
It appears to be a ZIG Zag correction - ABC -535 - that means 5 wave decline followed by 3 waves up, followed by 5 waves decline.Currently we’re in wave (B), that should be followed by C ( 5 waves decline). That may take it much lower than 100.
In short term, we have resistance near 155, and that is also 61.8% retracment level of recent (A) of larger C.
In short , I will avoid this stock unless I am interested in 10 -15% gains ( from 135 to 165/170)
@StageInvesting Thanks for inputs. I had read a lot on EW and used to follow Vivek Patil also when he used to write on icicidirect. And had read Prechter’s predictions off and on. But I found that part of analysis extremely difficult to follow and implement. Had read Ramky Ramakrishna’s short simplified version of EW also. But never latched on to the subject.
Instead of that I have found that very simple looking things often give superb results. And after reading William O Neil and reading and hearing Minervini, I felt that theirs was the method that resonated the most with me. So have been trying to learn more and more and improvise on those systems.
Charts of most autos and auto ancs seem quite strong and once sectoral fancies start playing out, we never know how far the moves can go. Atleast that’s what I have observed and learnt in last couple of years… Stocks in chemicals, sugar, API - bulk drug players etc went up much much higher than what anyone expected.
And in my view, having very fixed ideas about where markets are headed also does not help. Its better to follow the trend as long as it lasts. And sectors and stocks which outperform the broader index are always going to provide big winners. So I usually do not worry or try to predict where markets are headed and instead try to focus on opportunities where a lot of boxes are ticked for me, both in terms of fundamentals and technicals.
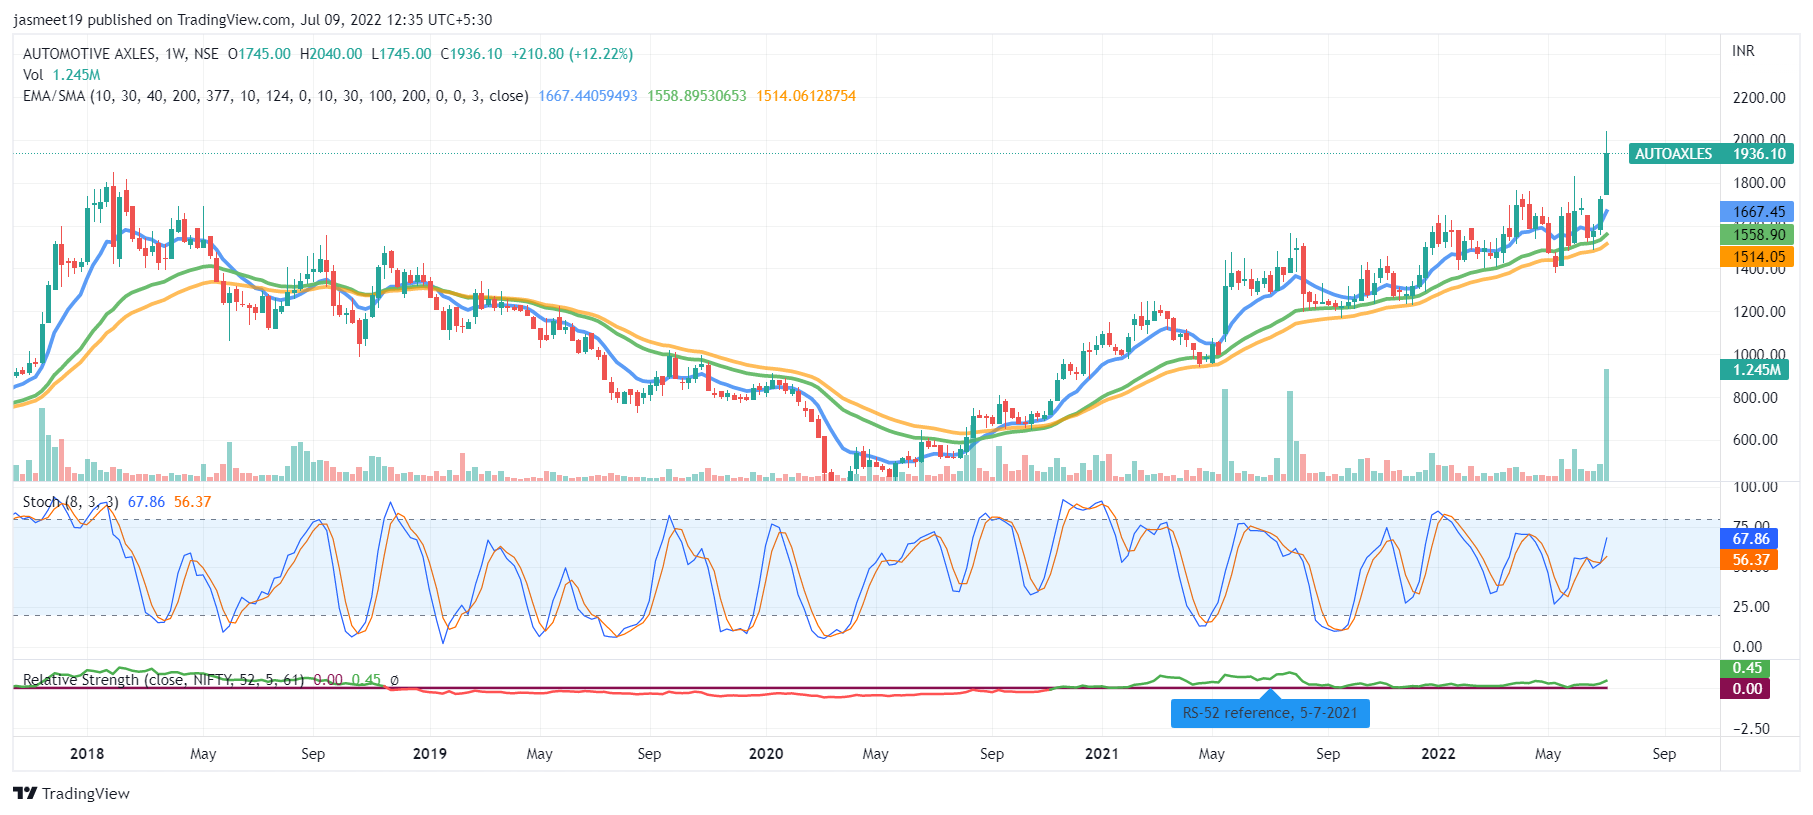
Please look at the chart of Automotive Axles. Price breakout to multi year high with strong volumes on 4th July. Sector is also favorable.
Fundamentally, looking decent with 3 years growth. Please check its weekly chart.
I am still learning technical analysis, looking for guidance whether it’s the right time to enter.
Everyone has his own style and aptitude. And one should do what suits him well.
But at the same time, one should keep an open mind - because many a times we don’t know what would suit us and we keep living on borrowed ideas and borrowed conviction. So if don’t explore, we might never know about what suits us better.
Personally I take overall market direction as supreme,then stock. Yes , we don’t ignore counter-trend bounces …that is why shared many charts, among them were Fiem & Sterling Tools as part of automobile-ancilliary play in this bear rally.
Won’t speak more and would let our charts do the talking in coming days.
At the same time would like to say again - always appreciate your deep knowlegde abut the markets, your helping nature and open-mind.You’re a gem of a person , and that too a rare one.
Stock price broke above its previous all time highs of 330-340 and went on to hit a high of 450 in Dec 21 and then went into a corrective mode broadly in a triangular fashion. It went down and posted a low of 291, but broadly tried to take support in and around previous top region of 330-340, going down ocassionally with markets when markets were very edgy. Ever since bullish commentary was re confirmed (previously mentioned at q4 fy 22 concall) at its AGM, a lot of investors I knew had turned bullish on this one. On 28 June 2022, stock price broke out of the triangular corrective phase and went up to post a swing high of 407 . It then went on to form a flag type of correction for a few days and today broke out of that flag type of formation with good volumes to post intraday high of 418 and ultimately close at around 400. Note the reduced volumes during flag formation and today’s spike in volumes. Flagpole height is 100 rs. Breakout point is 390. If this pattern plays out, we can see target of 490 based on this breakout. This will also help stock price to clear its previous swing high of 452.
Overall pattern target of inverted head and shoulders/cup and handle are close to 580. It what management talks about play out in terms of numbers, that can be achieved.
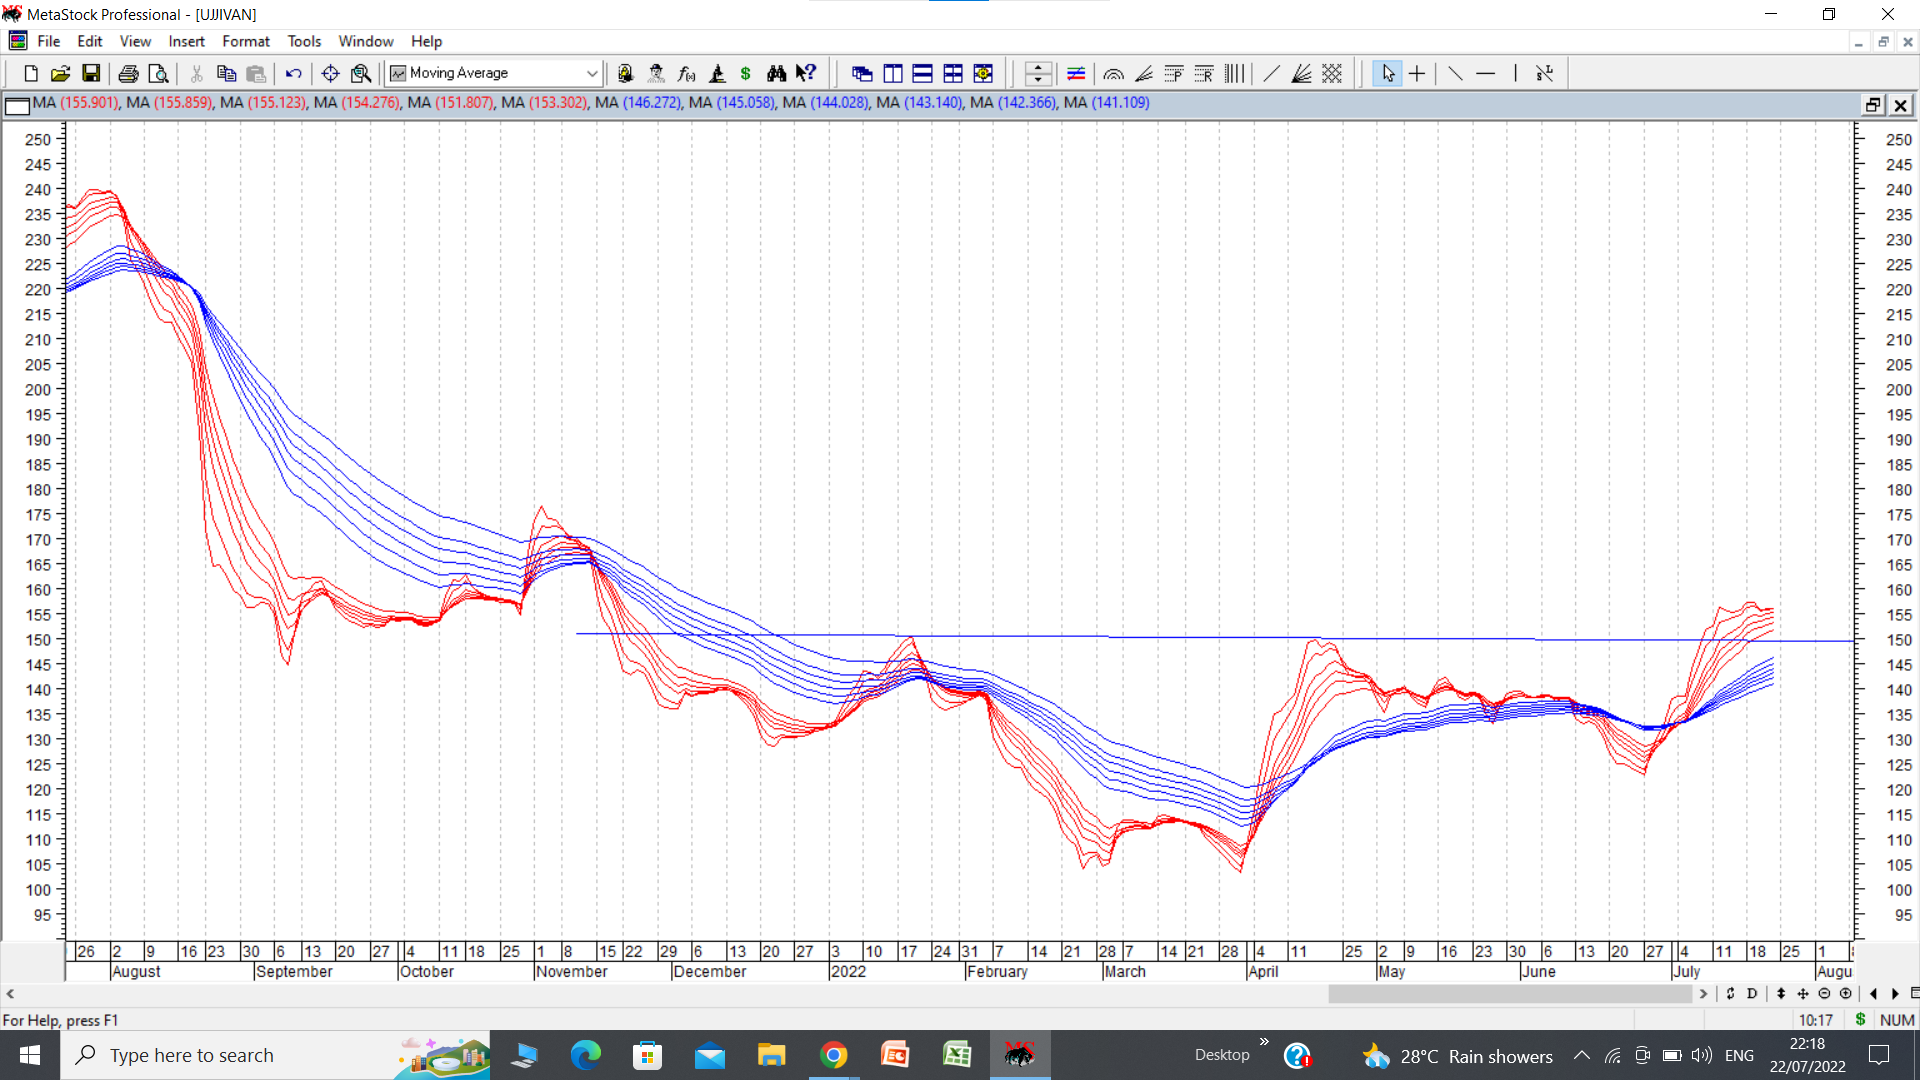
Ujjivan financial Ltd is a holdco for ujjivan small finance bank. Attached chart shows an inverted head and shoulders breakout at 150 on GMMA daily chart (and around 155 on bar chart. ) After breakout, stock price is consolidating above breakout zones with low vols in a narrow range. If pattern suceeds, target can be in region of 200. disc: invested as a techno funda bet. (Not a recommendation, please do your own diligence if contemplating investment)
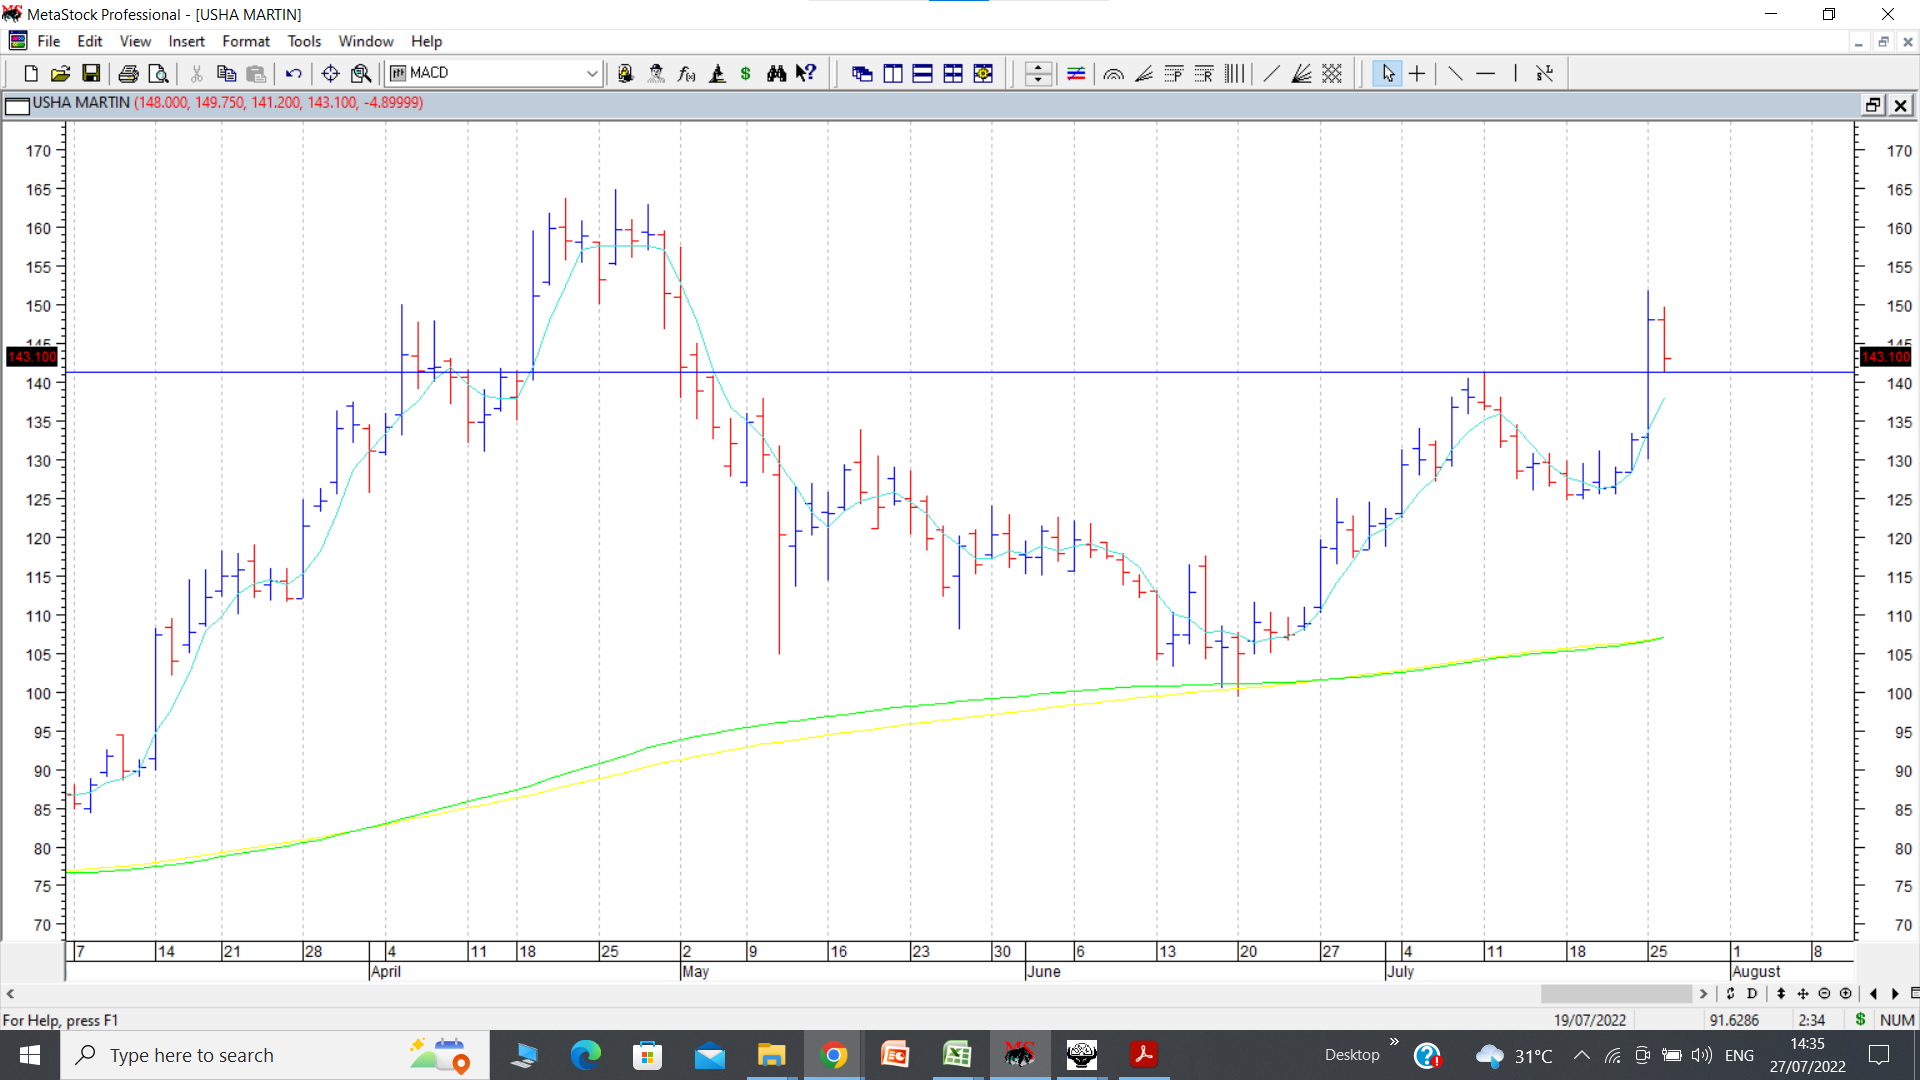
Usha Martin after hitting its all time high of 165 in April 22 went down during the market meltdown and took support near its 200 dema at around 100. Since then it has rallied recently and broken out of a cup and handle pattern above swing high of 141. Since past couple of days, it has been testing the 141 levels and managing to stay above that level. If pattern plays out successfully, then near term targets can be 180. (disc: invested since long time. bought more recently)
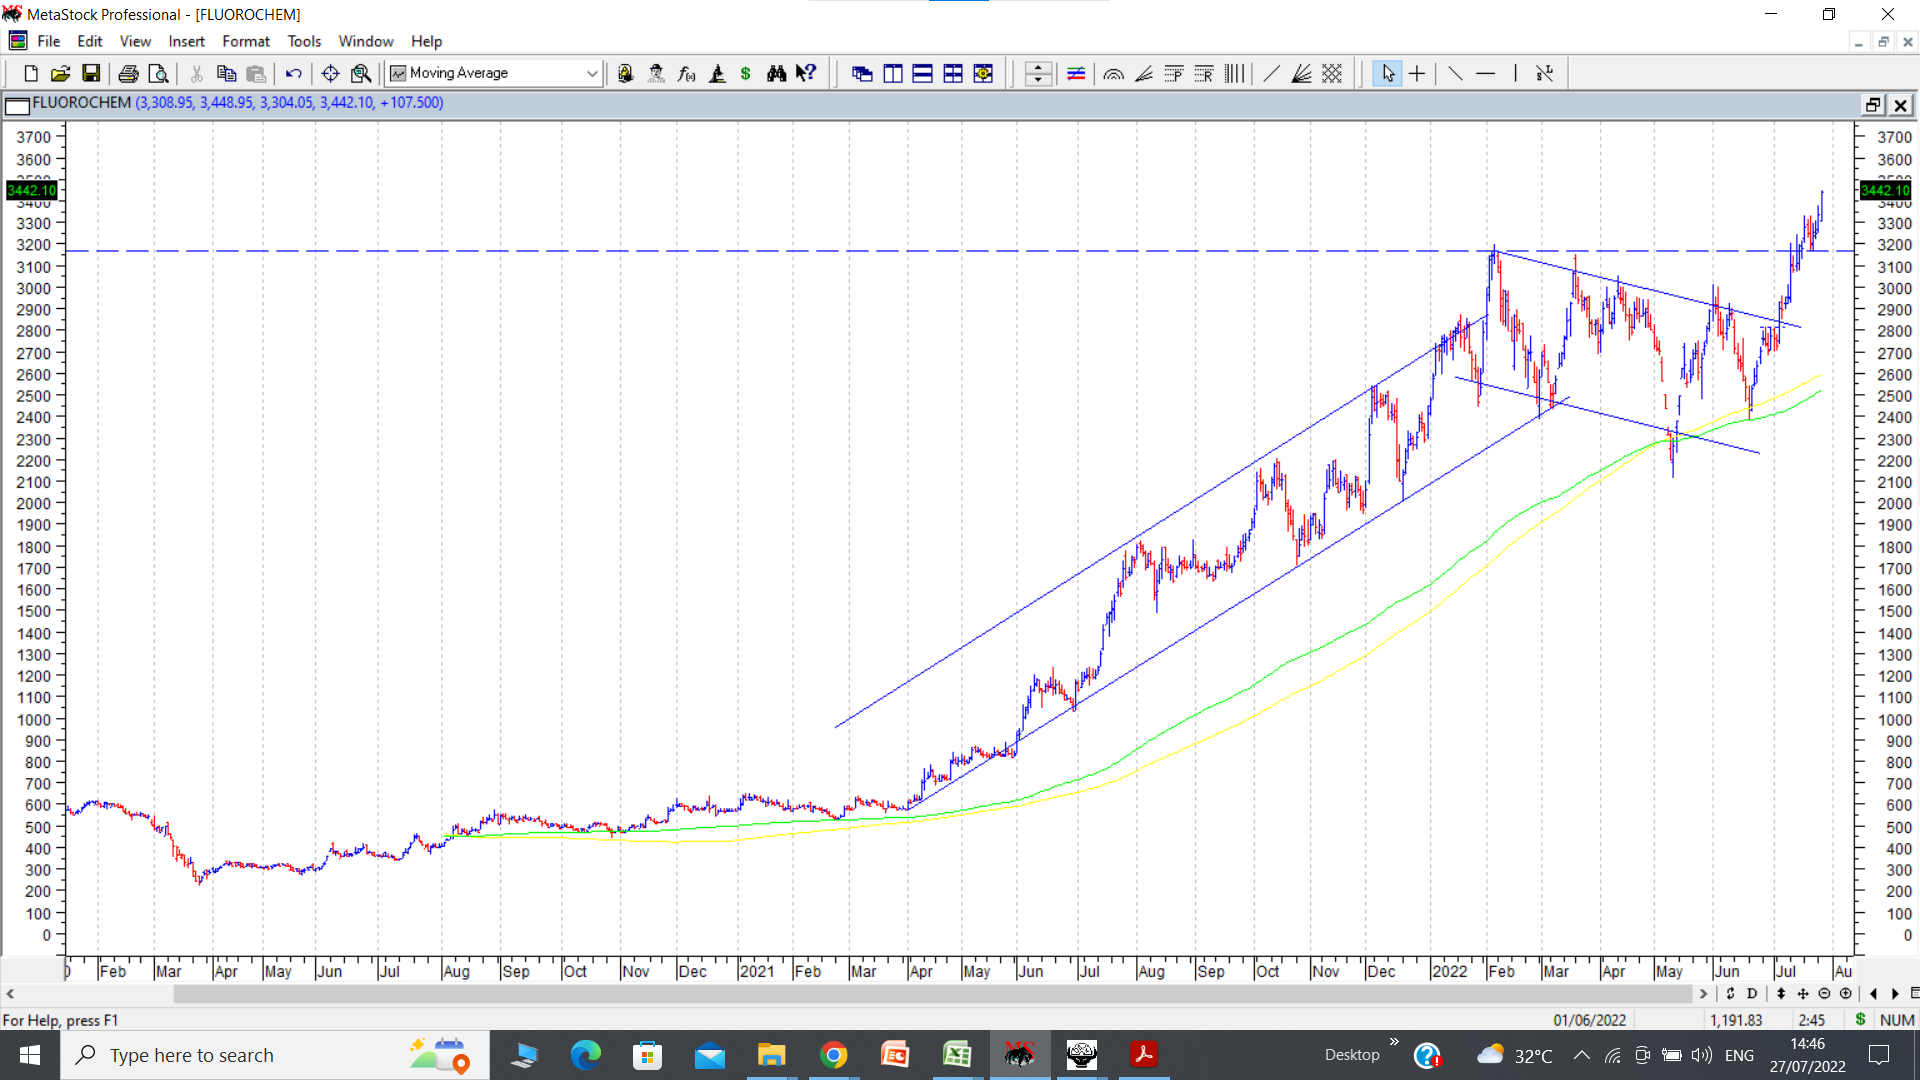
Fluorochem has posted very strong numbers today for q1 fy 23. Stock price had made a swing high of 3498 and is often the case, there was profit booking even on good numbers. The previous major swing high of 3200 should be watched for support going ahead. Today’s low was just below 3200 till now.
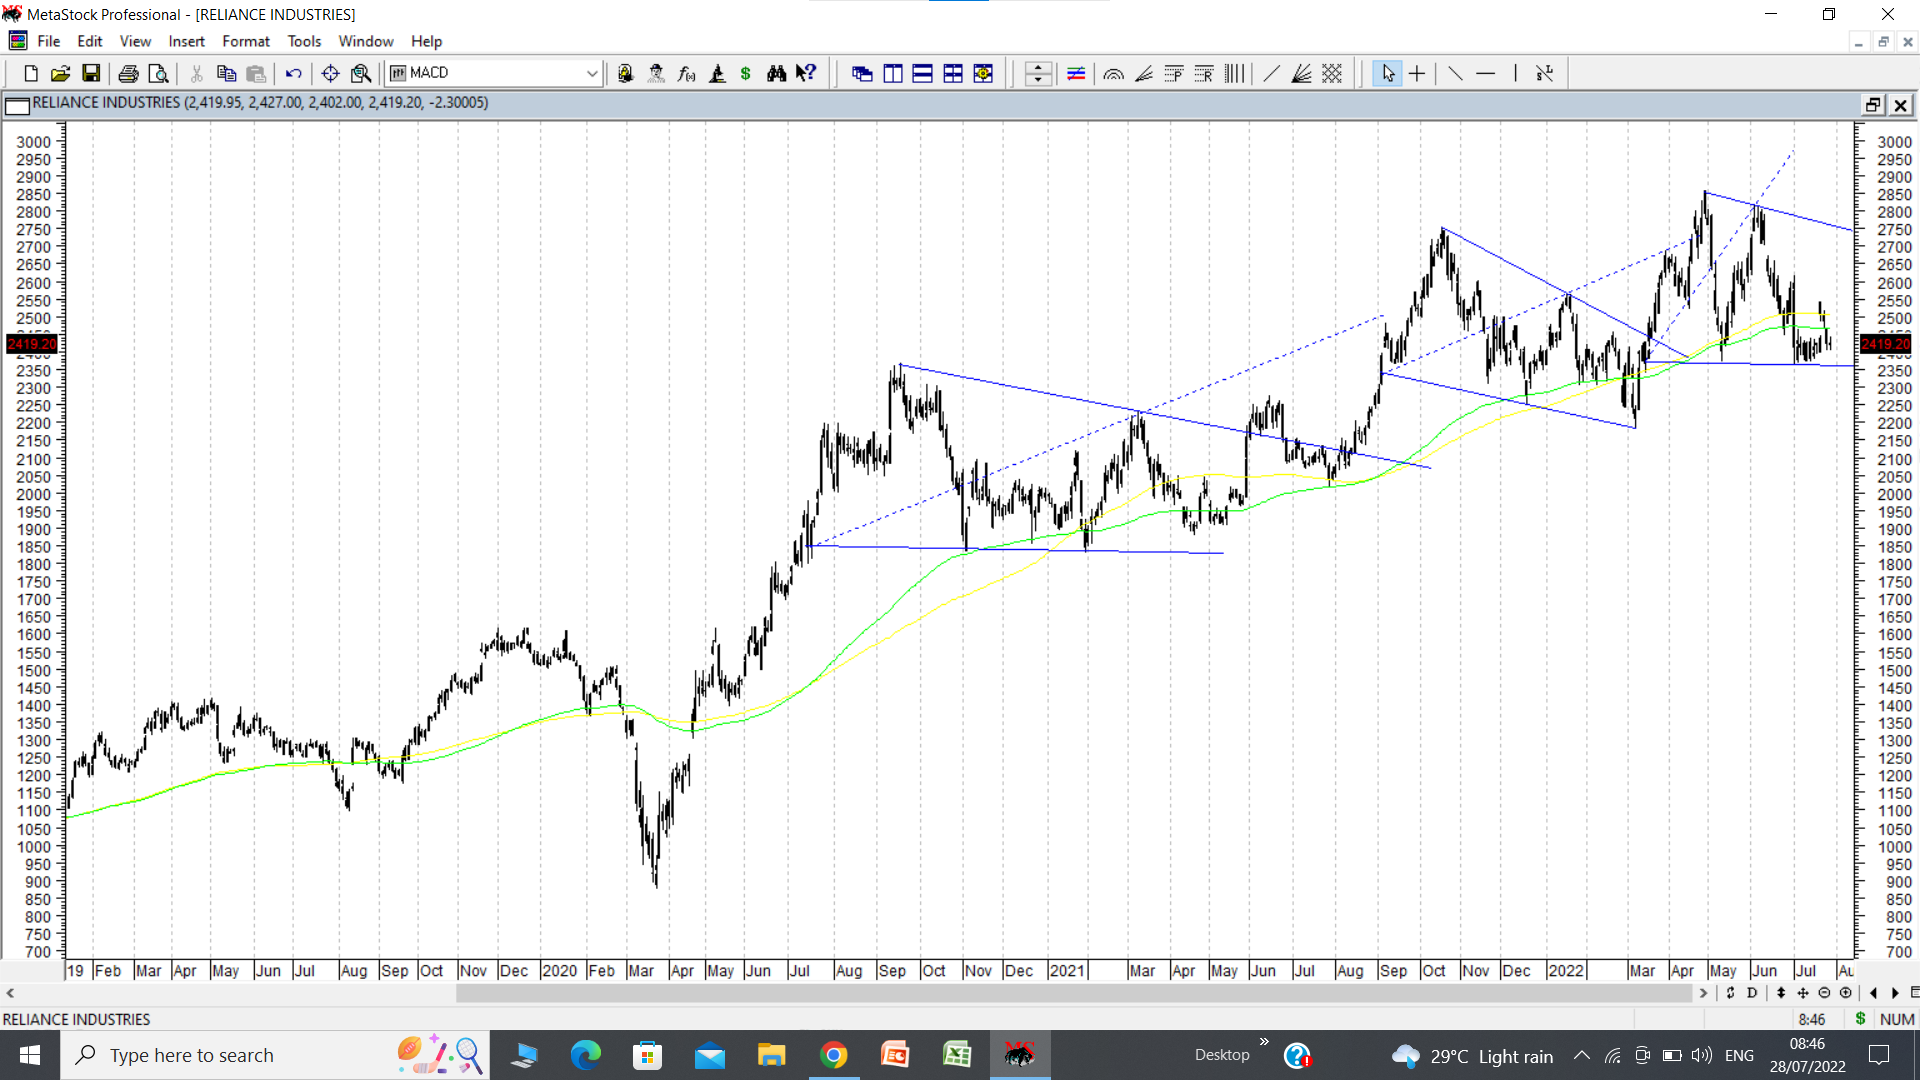
Reliance daily candlestick chart. Putting up here to show examples of Wolfe Wave, a triangular pattern with 5 waves and a clear cut target line. In this case, previous two Wolfe Waves have been successful and targets have been achieved. Also marked a recent Wolfe Wave where I would be following up whether targets are met or not. Some guys are now talking about Nifty creating new highs over next few months and if that were to happen, Reliance could play an important part, it being an index heavy weight. In last few days, Reliance has had an upward gap up, then a downward gap and dojis since past two days. (disc: only for academic purpose, more to illustrate examples of Wolfe Waves, an interesting concept. No positions or recommendations)
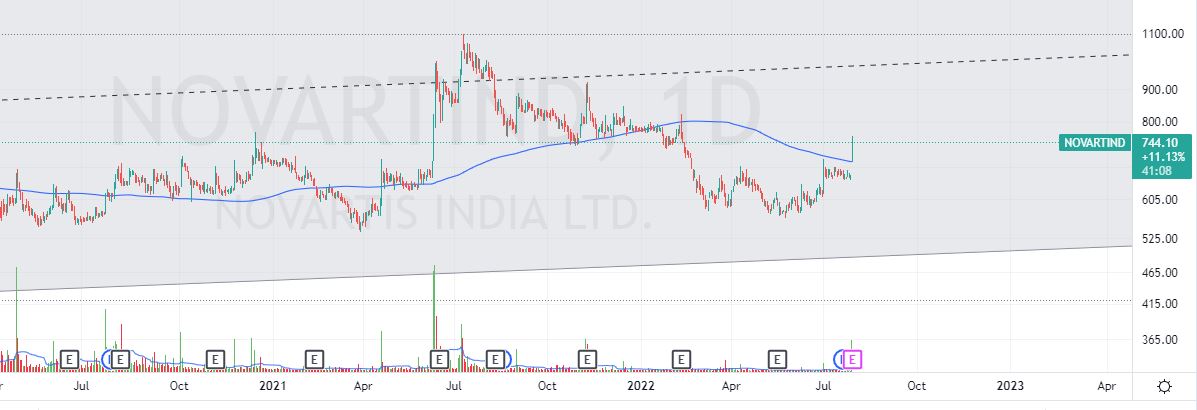
company : "Novartis India "
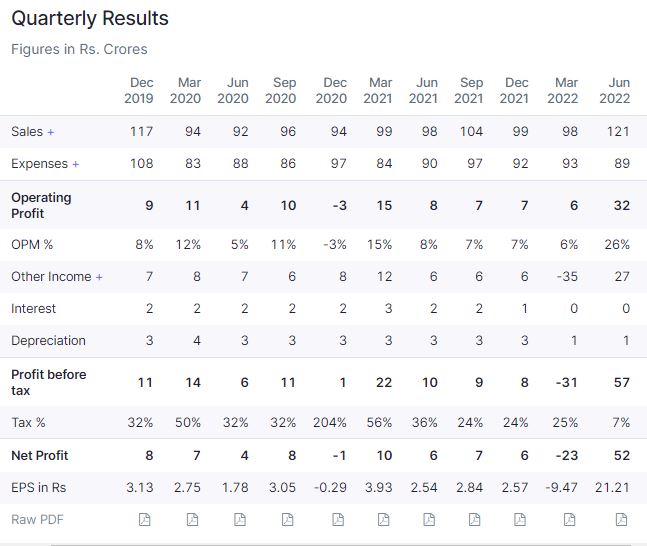
Novartis India reported huge jump in net profit and margin due to cut in employee costs (layoffs) and improvement in sales… as they have stuck a sales and distribution deal for some of their their branded portfolio of drugs with Dr Reddy labs “calicium sandoz” “diclofenac”…
source:Portfolio under Novartis-Dr Reddy’s agreement comprises over 30% of NIL’s turnover
extract form annual report.
“The Company has entered into an exclusive
sales and distribution arrangement for few
of its Established Medicines brands with
Dr. Reddy’s. This arrangement aims to
further broaden access of these medicines
beyond the current geographies to benefit
many more patients, more efficiently,
by significantly extending the reach of
healthcare professionals through an expanded
field force.”
@hitesh2710
Sir, my question…Can we see this as some kind of earnings based pivot to the upside in this neglected company with an improvement in ROCE, NPM profile along with sales due to the partnership with dr Reddy … ? can this leading to a new 52 week high ? thanks…
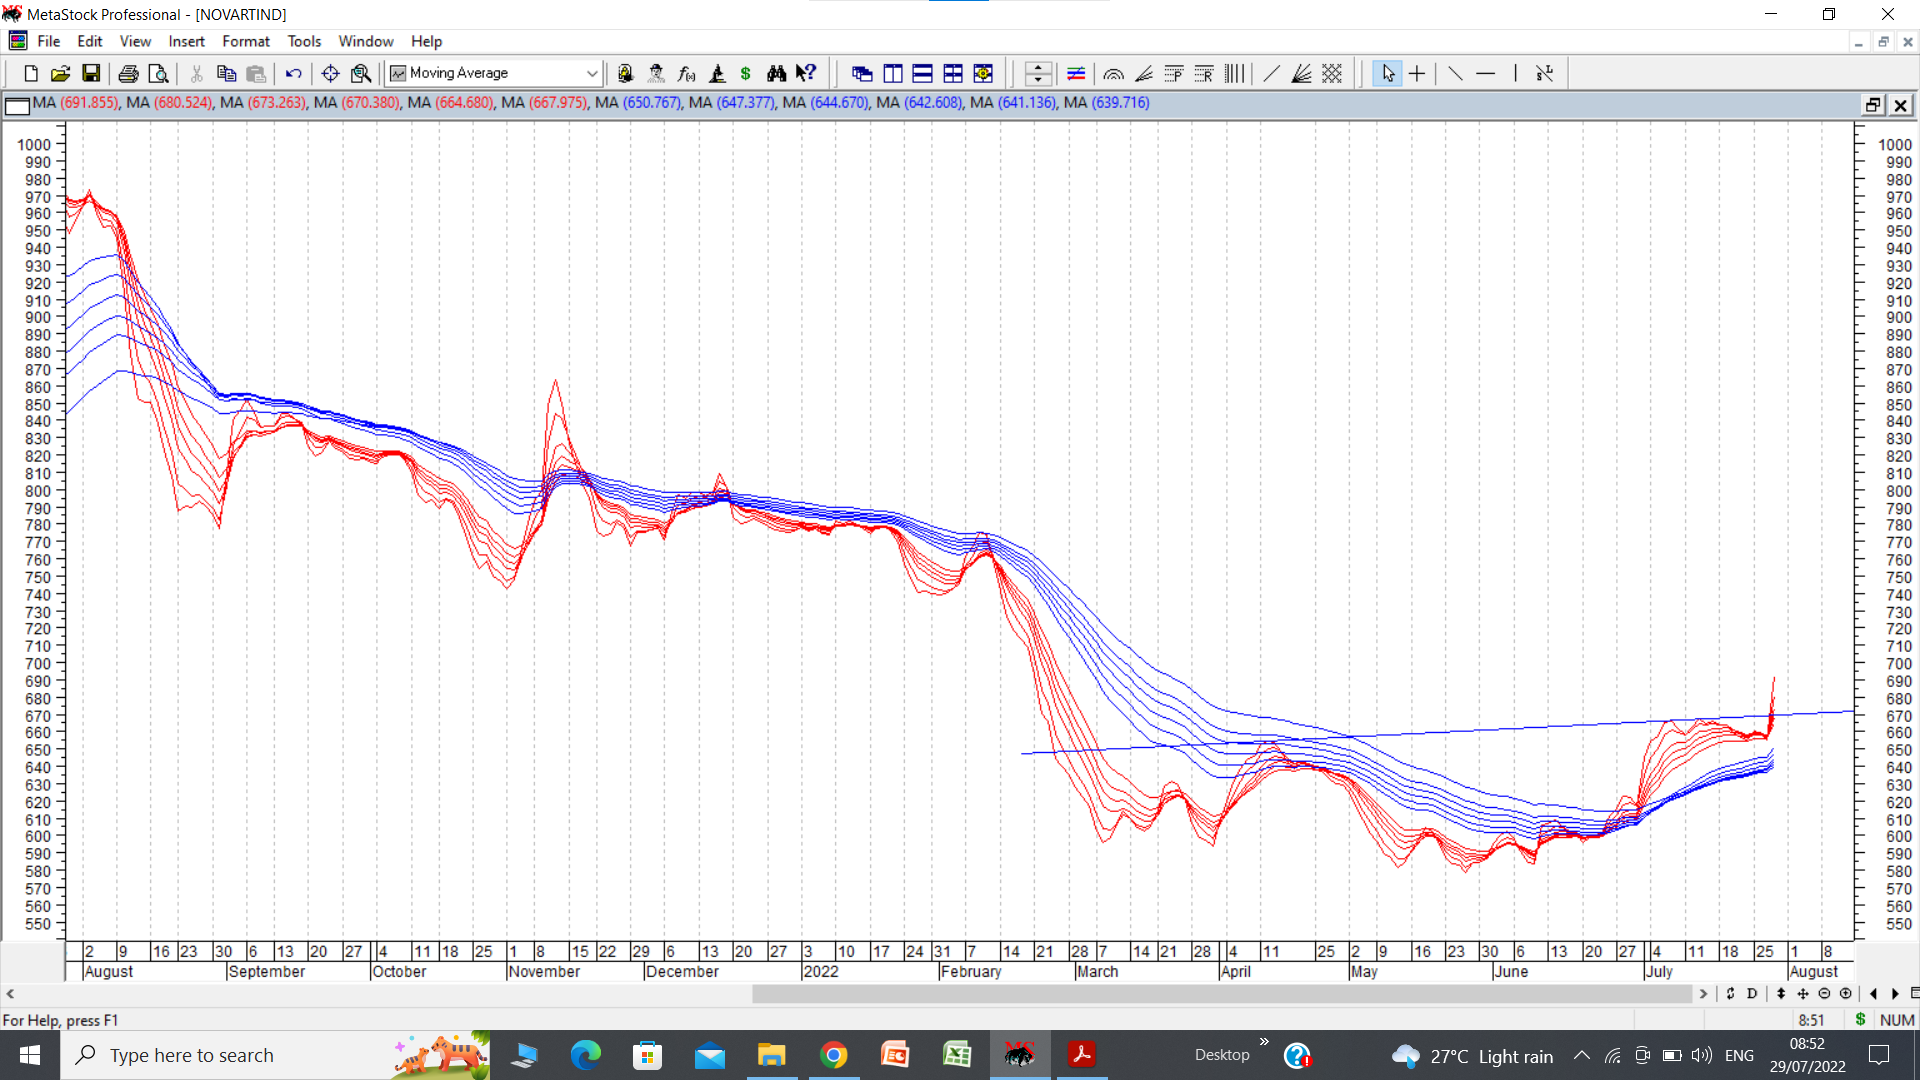
Q1 fy 23 is the first after many quarters in Novartis where profitability has shown significant improvement. We have to be sure that it is not one off and part of a larger trend. Since management does not seem to be doing concalls, there is no way of verifying this, except to wait for next qtr results or track prices and see if they tell us something. As of now, we have an inverted head and shoulders breakout from the bottom with a big gap up. Gap up is from 666 to 712. Usually there is an attempt to fill such a huge gap up atleast partially. So it would be prudent to wait for stock price to cool off before rushing in to take positions. Employee expenses have come down from 28 cr in q1 fy 22 to 20 cr in q4 fy 22 now to 9 cr in q1 fy 23. This benefit looks sustainable. Attached daily GMMA chart of Novartis, showing the inverted head and shoulders breakout I mentioned.