
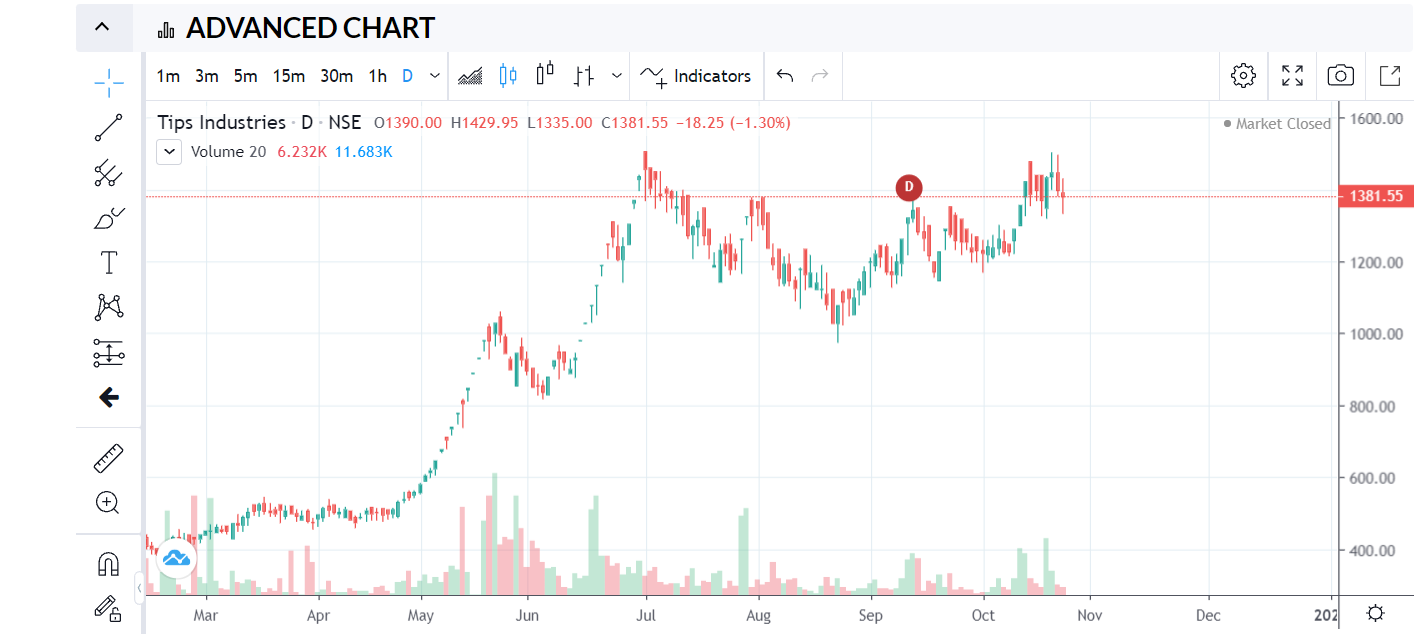
Tips Industries:
Is this a good all time high + reverse head and shoulders pattern?
2 Likes
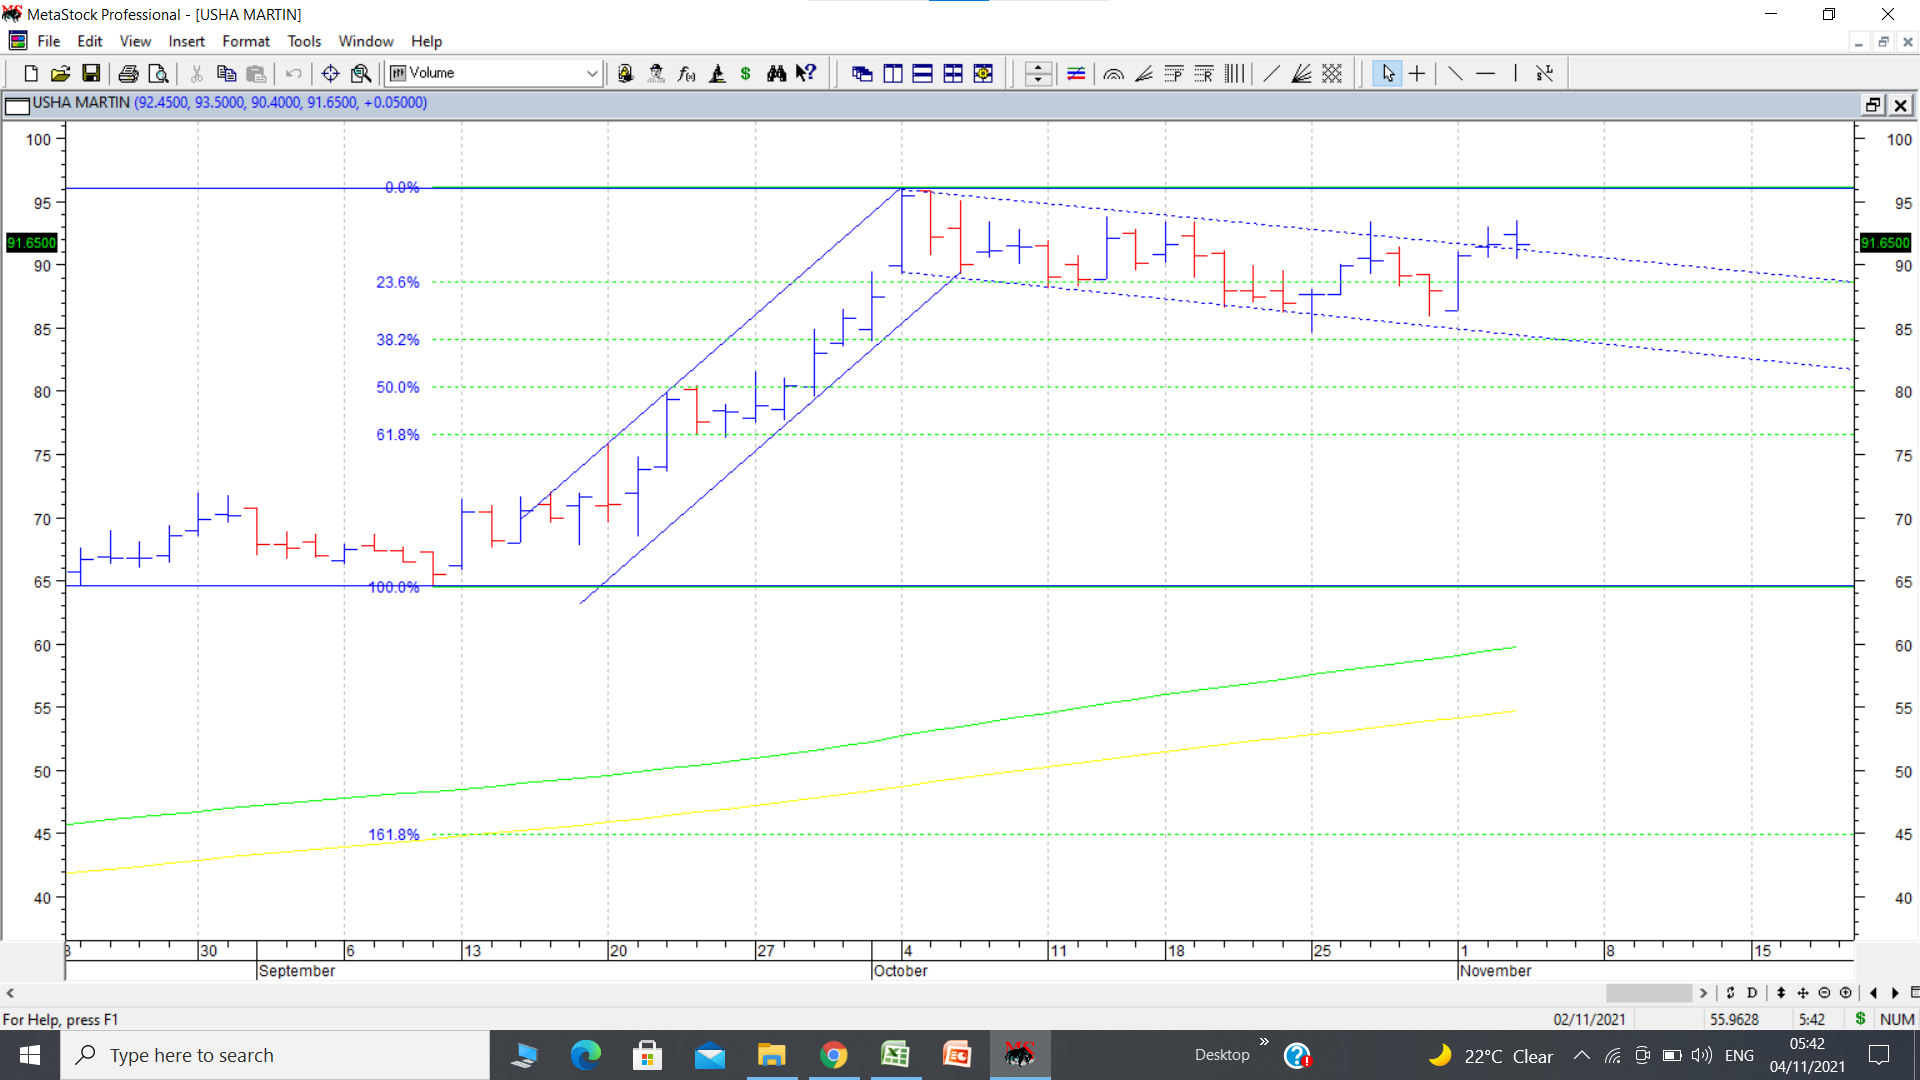
Usha Martin is a company engaged in value added wires and wire rope business. It sold off its steel business to Tata Steel in 2019. Proceeds of nearly 4200 crores were used to cut down debt and currently debt has substantially reduced from above 4000 crores to around 500 crores. What the selling of the steel business has done is to reduce the volatility of earnings. Now the company can be considered as a converter of steel. This could be a business with steady cash flows and high return ratios. Past two quarter results show the steadiness of the business with sales in excess of 600 crores and net profit in excess of 55-60 crores. Market cap is 2800 crores.
Coming to the chart of Usha Martin, it broke out of a 10 year high above 48 and went up quickly to a recent swing high of 96, and then has been consolidating in a broad range of 85-93, in the process forming a flag like pattern. What is more interesting is that all during the small and midcap carnage in last few days and weeks, it has not corrected more than 38.2% of its latest leg of rally from 65 to 95 (fibonacci levels shown in light green dotted lines on chart). This usually indicates strength of trend. It has formed a flag like pattern with flag pole from 65 to 95 and breakout point around 93. If it breaks out with volumes above recent swing high of 96, it can target 125. On the higher side, it has major peaks in the past at 96, 107 and 155.
disc: invested and have added more in the recent consolidation.
29 Likes
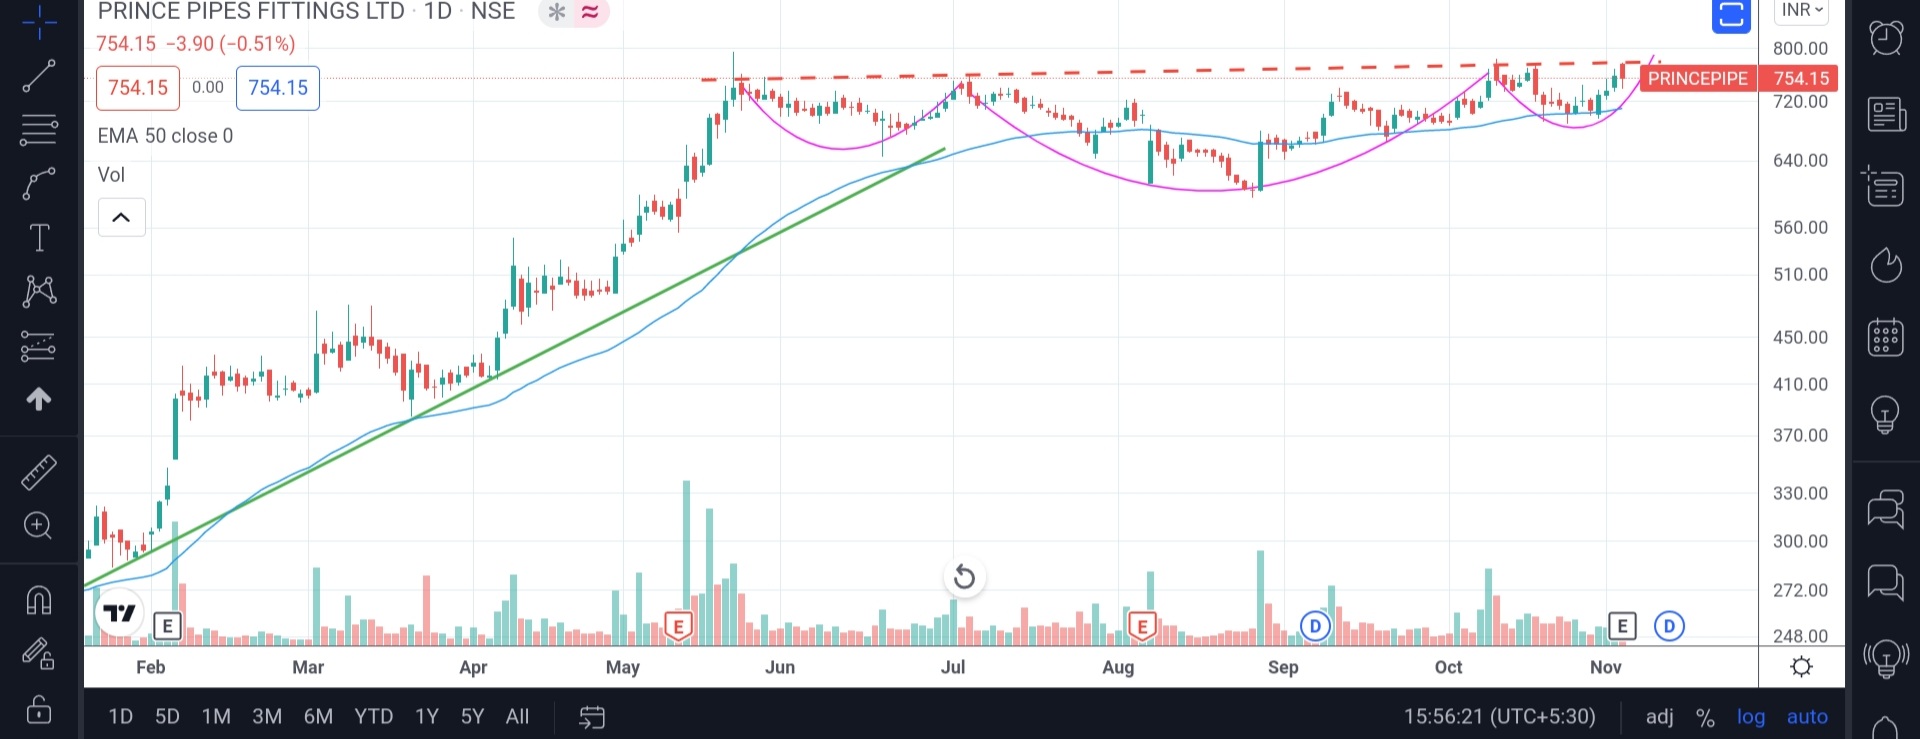
At junction of 52 week and all time high.
Prince pipe has come up with good Q2( volume+value), with PVC prices sustaining high and having sizable inventory + price hikes , next few quarters looks good.
In consolidation from June to Oct, head & shoulder pattern visible, need breakout with volume, height of head comes to 150, can go till 900 if breaks with volume.
Novice, learning and have positions from much lower levels.
7 Likes
A recap on force motors chart posted earlier. Essentially stock price has done nothing since past month. Stock price has been rangebound between 1400-1600. This can be considered a double bottom formation with a possible breakout above 1610 where there is a double top formation. So we can see strong momentum above 1610 if and when stock price moves above that level. In last few weeks as shown in the chart, there was a breakout from an inverted head and shoulders pattern (marked on dotted lines) and then a retest and now again there seems to be some strength in the counter. Monthly sales numbers are not yet out for Oct 2021, but would be an important data point to see how things progress. Another important date is 12th Nov when q2 results should be out. According to some monthly sales data I track, total vehicles sold in q2 fy 21 was 4149, total vehicles sold in q1 fy 22 was 4616 and total vehicles sold in q2 fy 22 was 6047. (total vehicles sold include domestic and exports combined. This does not include engine sales to BMW or to Rolls Royce JV). Overall trend seems to be that of improvement. If inverted head and shoulders pattern plays out, target can be 2200 plus. This company can also be considered a play on the UNLOCK trade, where we see a lot of vehicles sales post Covid. The important variable to monitor could be how it is affected by chip shortage and how bookings for Force Gurkha revamped version pan out. (Disc: I remain invested as disclosed before)
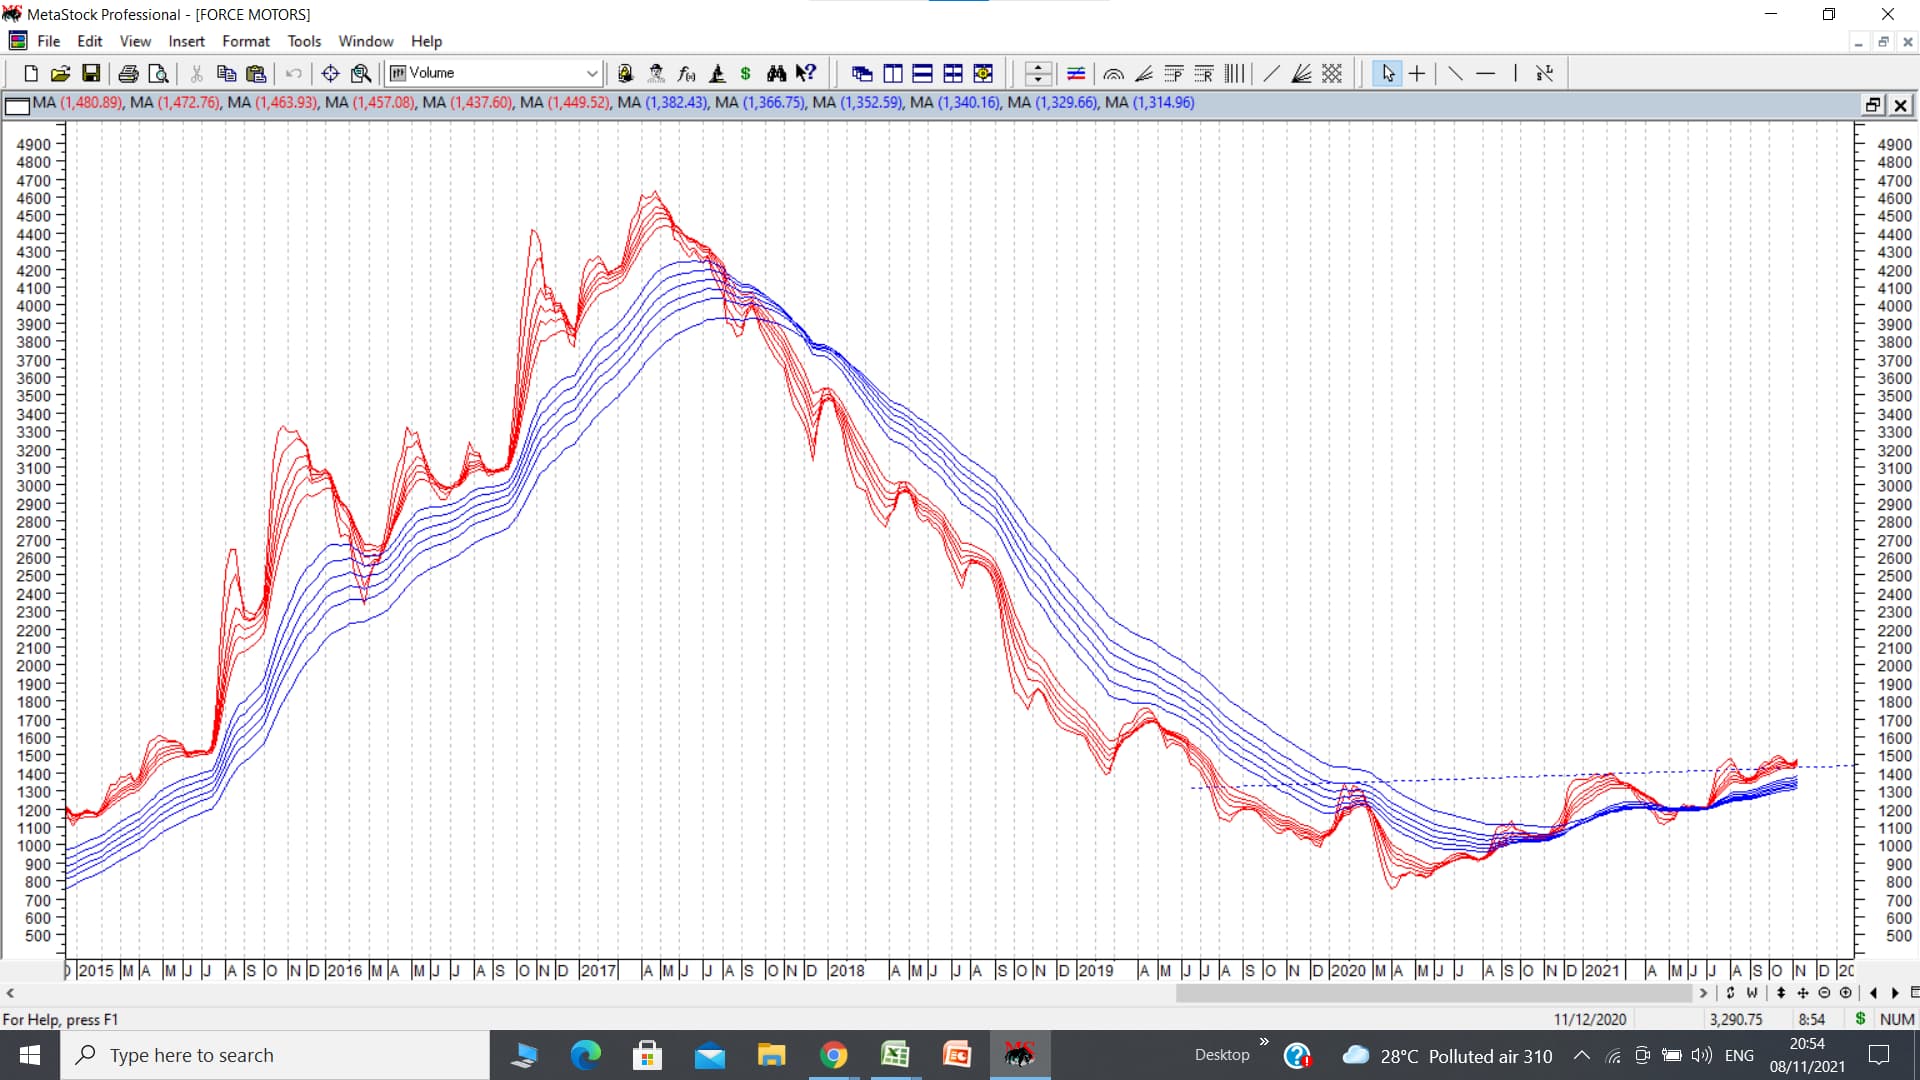
14 Likes
Rushil decor hits 52 week high today. Stock has consolidated for the past 6 months between 240 and 280. Today it crossed its 52 week high with strong volumes.
Rushil is a play on MDF capacity expansion coupled with demand uptick and transformational shift from plywood to MDF.
Reason for it to go and settle around 450-500.
-
MDF capacity increase has hit the topline and bottom line this quarter. Rushil decor has expanded its MDF capacity in the south from 300 CBM/day to 1100 CBM/day. The consolidation between 240-280 seems to tell me that the stock was waiting for the results of the expansion to show in the numbers and since the results are out stock has moved from 275 to 340 in a matter of 3 days.
-
Management in the Q1Fy22 concall indicated that at peak utilization of 80 percent they can do around 450 cr in revenue for MDF per annum. So basically doubling of top line and with gross margins of around 15-16 percent this story seems cheap.
-
Capex could not have hit at a better time. Uptick in the real estate market and WFH has given rise to products people can assemble themselves. This demand as per management is surely not going to die down once everything opens up as demand is very strong because of good sales in the real estate market.
-
Greenpanel a similar player operating from gujarat has indicated a strong demand emanating for the MDF segment. CAGR for MDF has been around 20% as per investor presentation by Rushil.
-
The play here is to transformational shift from plywood to MDF that comes at a 50 percent price. Market is currently 65 percent plywood and 35 percent MDF and management believes the numbers will be reversed in the coming years as is with developed countries. IKEA is a major hub that sells mostly MDF products.
10 Likes
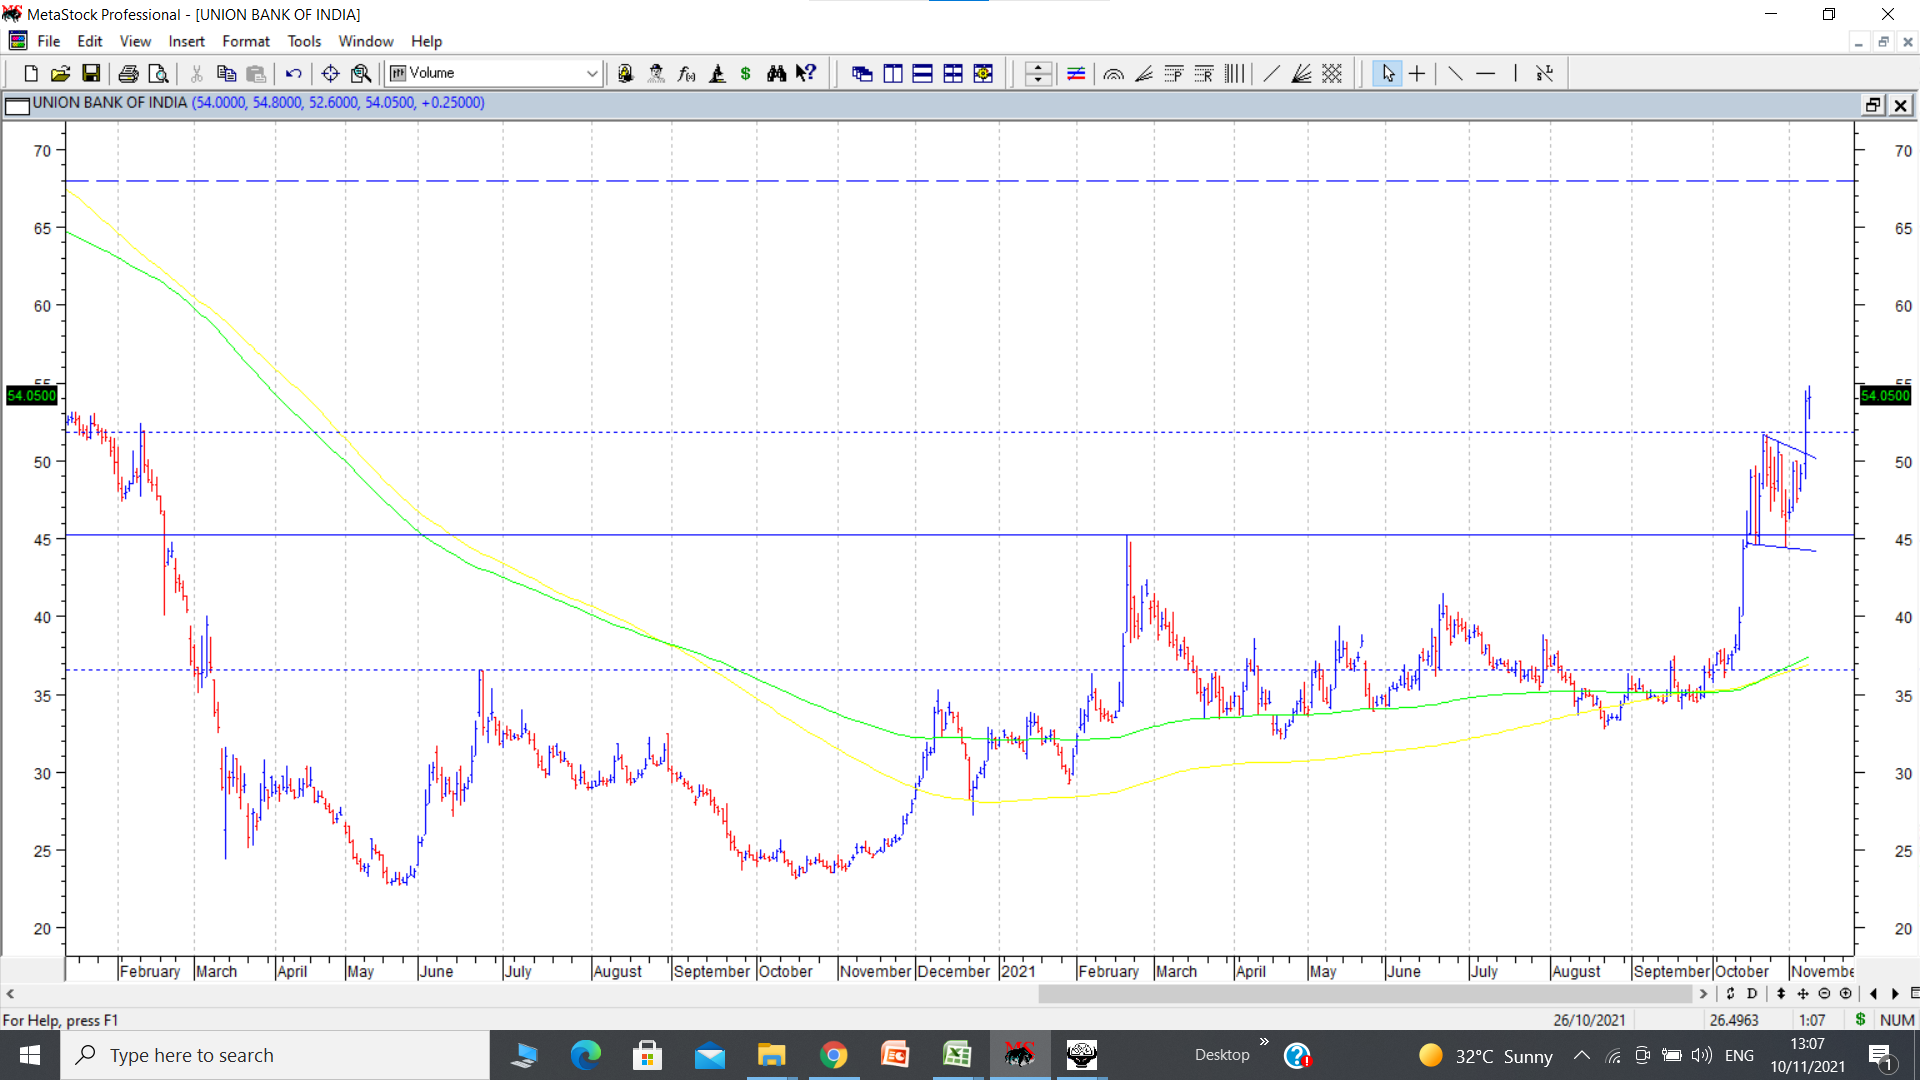
Update on Union Bank of India chart posted earlier. After a breakout from a cup and handle pattern (marked in solid horizontal line), stock price formed a flag pattern just above and around the neckline of the cup and handle. It broke out of the flag 2 days back and posted a high of 54. Now the target of the cup and handle is 68, and target of flag (pole marked in dotted line) is 65. cmp 53. Results posted by the bank have been quite good with improvement on most parameters. disc: invested as disclosed earlier.
12 Likes
SCI chart update. Putting up a chart of SCI with triangular consolidations and breakouts marked on right side of chart. Past two breakouts from triangular consolidations gave quick 40-50% upmoves. In past few days too, a triangular breakout has happened.
Fundamentally the demerger of non core assets has been approved by board. Regulatory approvals will be next triggers. There have been a lot of noises about disinvestment by the govt in SCI. If govt manages to do it before this finanical year, then the kind of bids that it receives would be the key trigger to monitor. Technically the target of close to 200 remains pending since breakout past swing high of 113. disc: holding since first post on SCI made in this very thread.

12 Likes
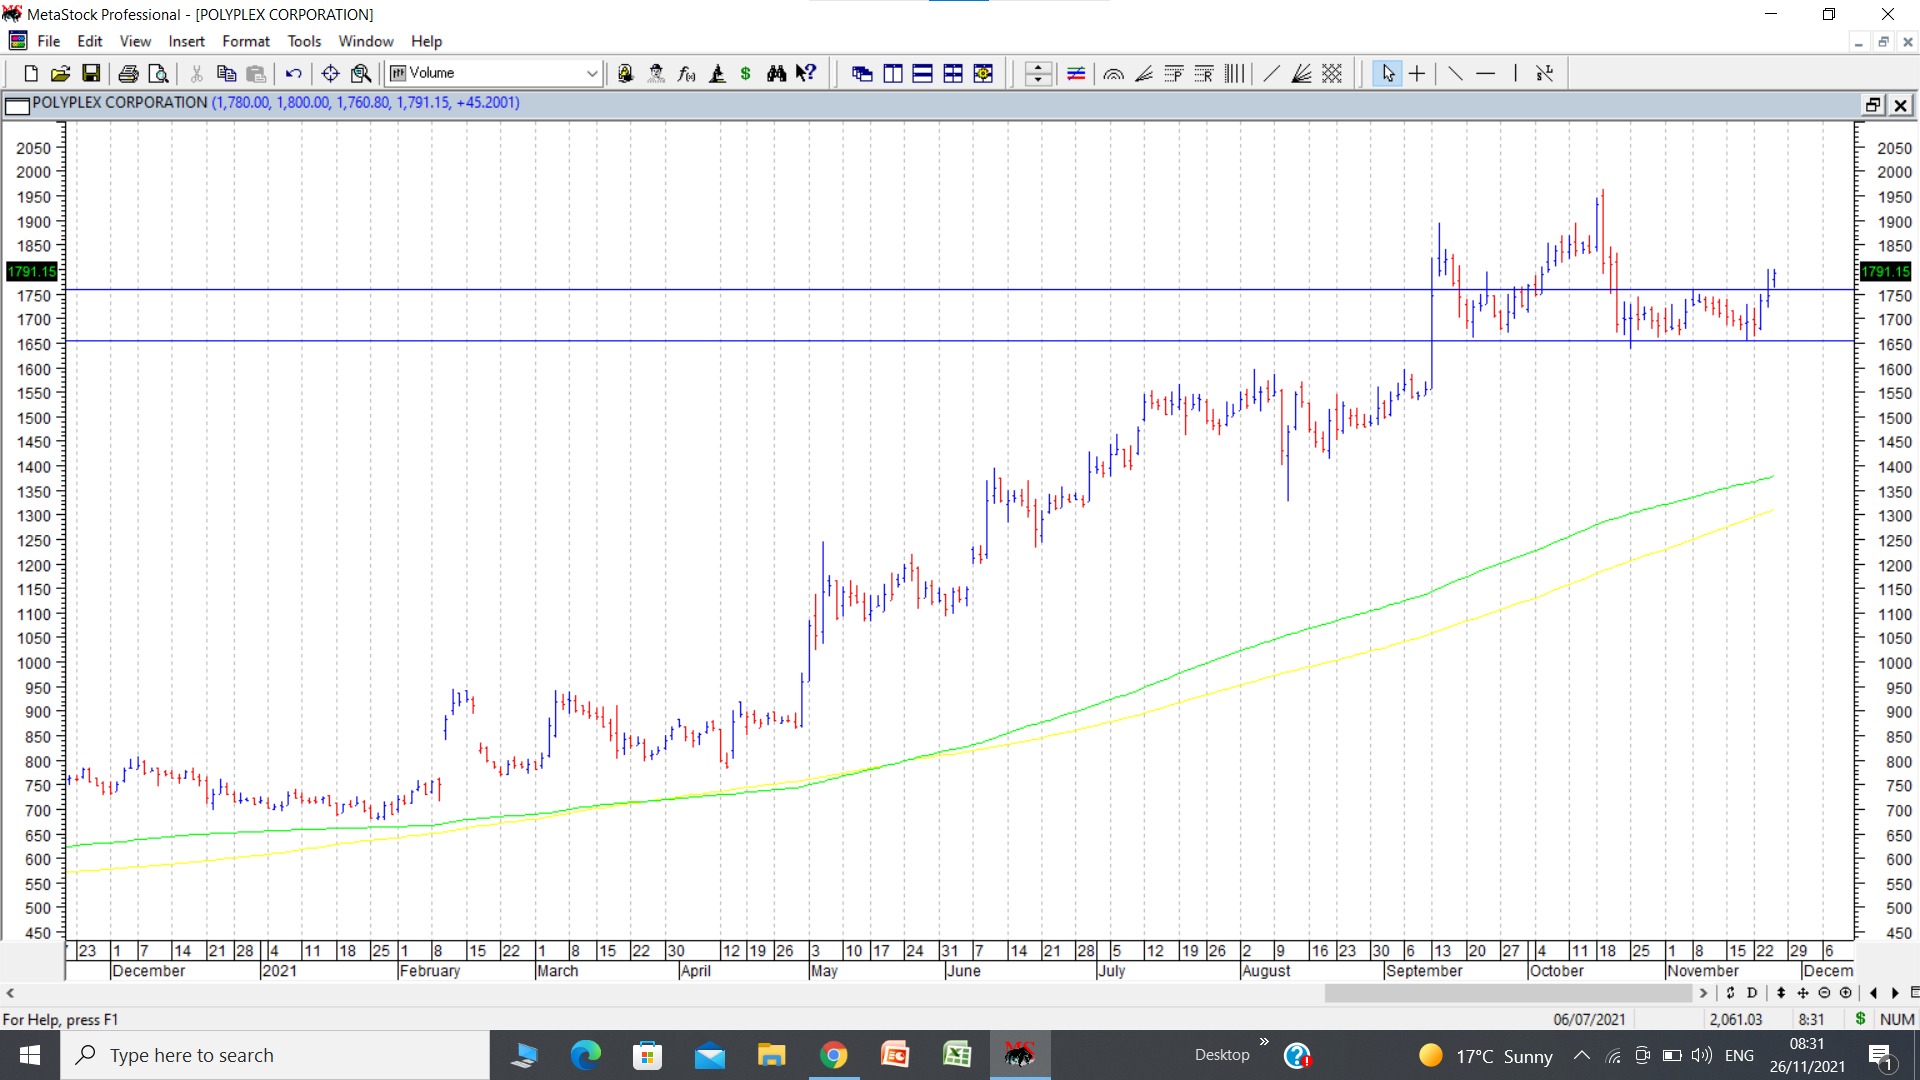
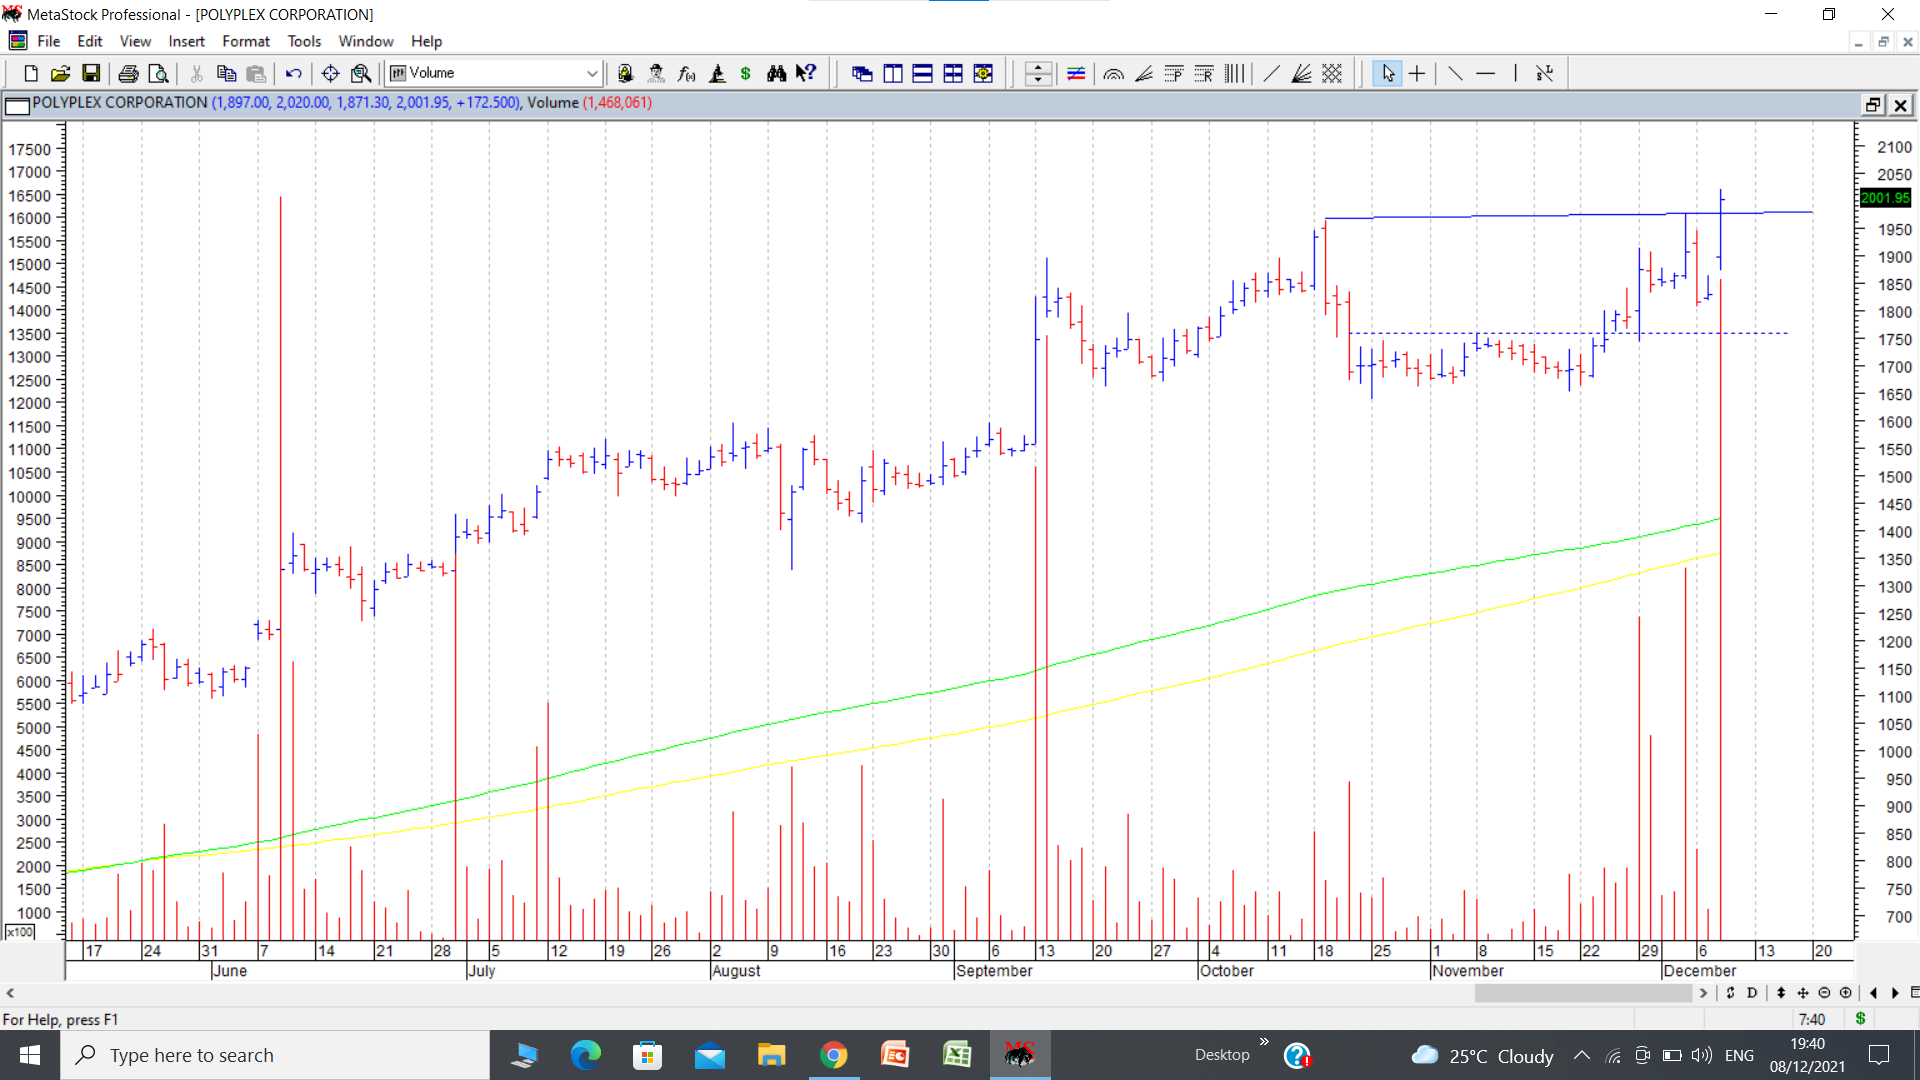
Polyplex has been on a strong uptrend since past many months. It continues to make higher highs and higher lows. There have been many periods of consolidations followed by rallies. I have marked a recent range breakout on the chart put up. It can be likened to Mark Minervini’s “cheat entry”. Basically by this term he means an entry at a minor breakout much below the actual breakout from swing high.
Here stock price was in a tight consolidation range from 1650 to 1760 for many trading sessions. This is inspite of severe meltdown in a lot of small-midcap names. This itself points to a lot of resilience. And since past couple of days it has traded and closed above 1760. disc: invested as a technical bet.
13 Likes
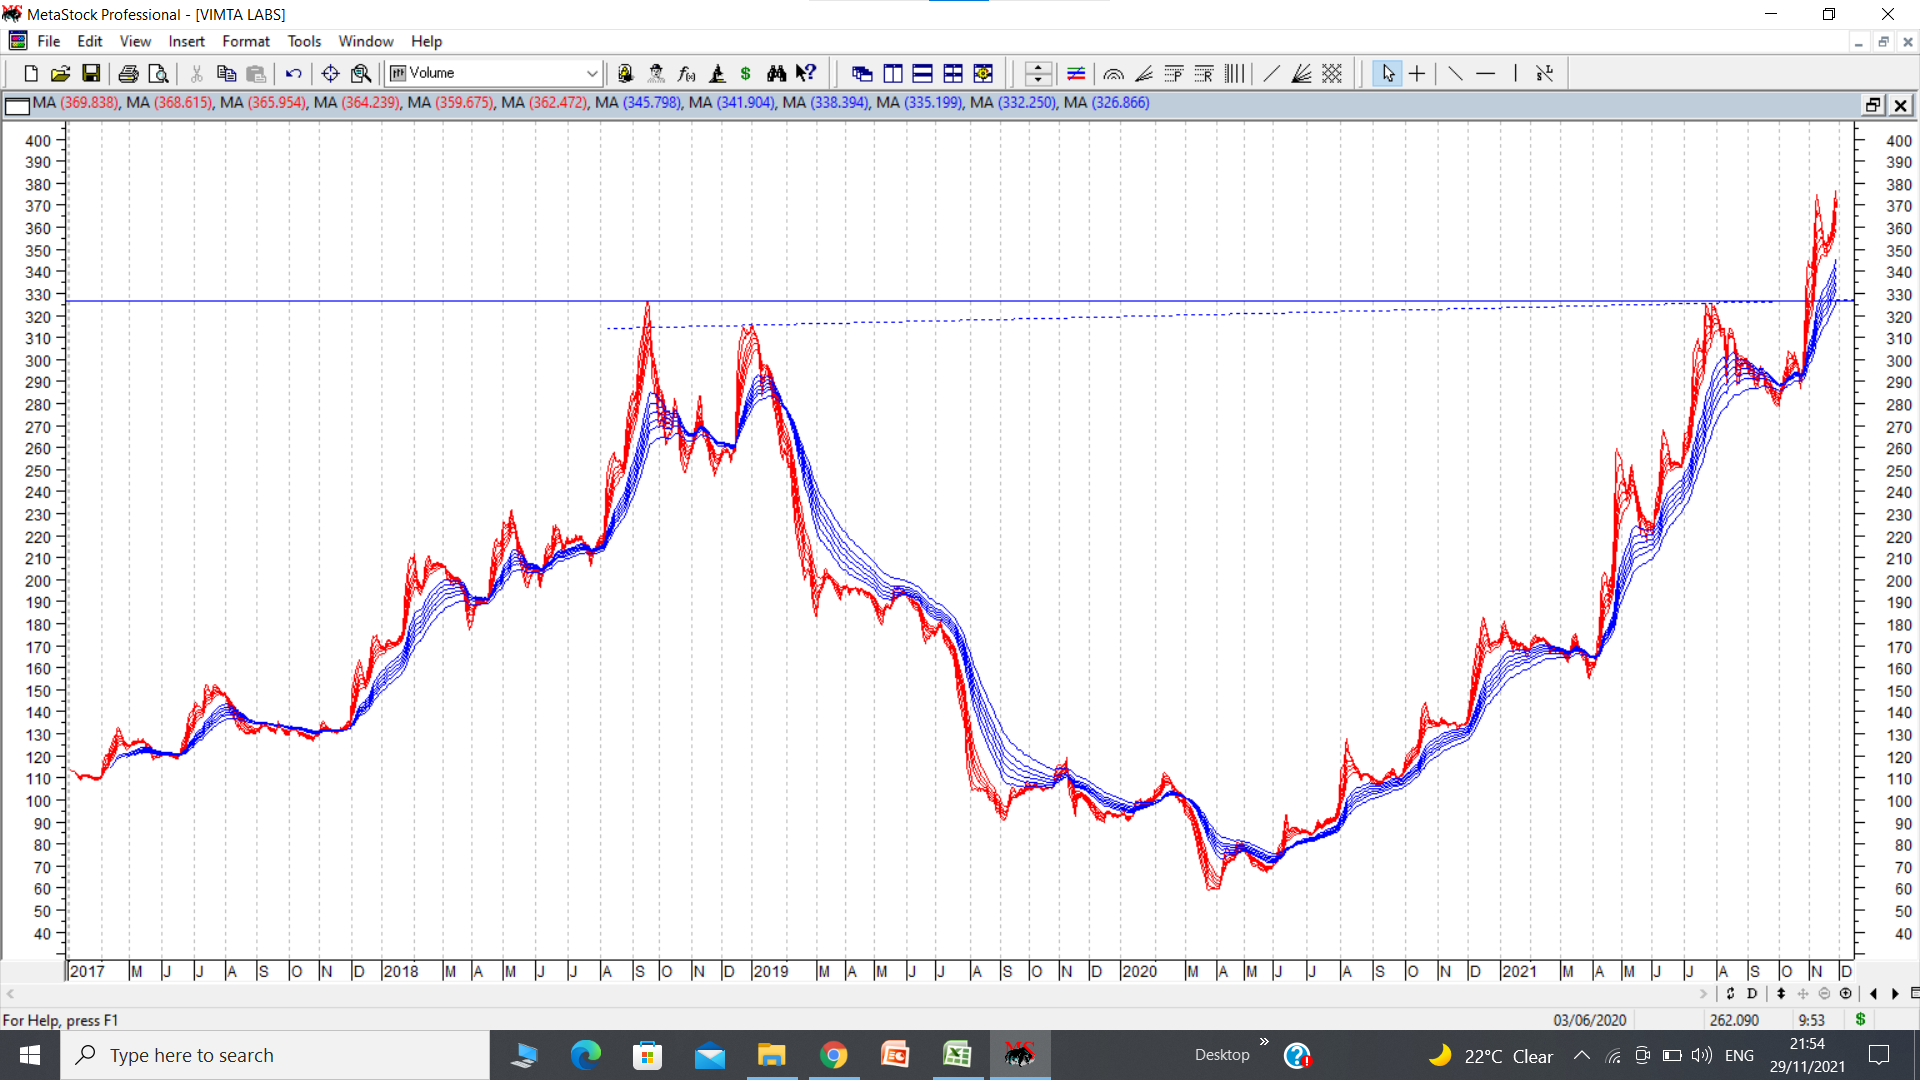
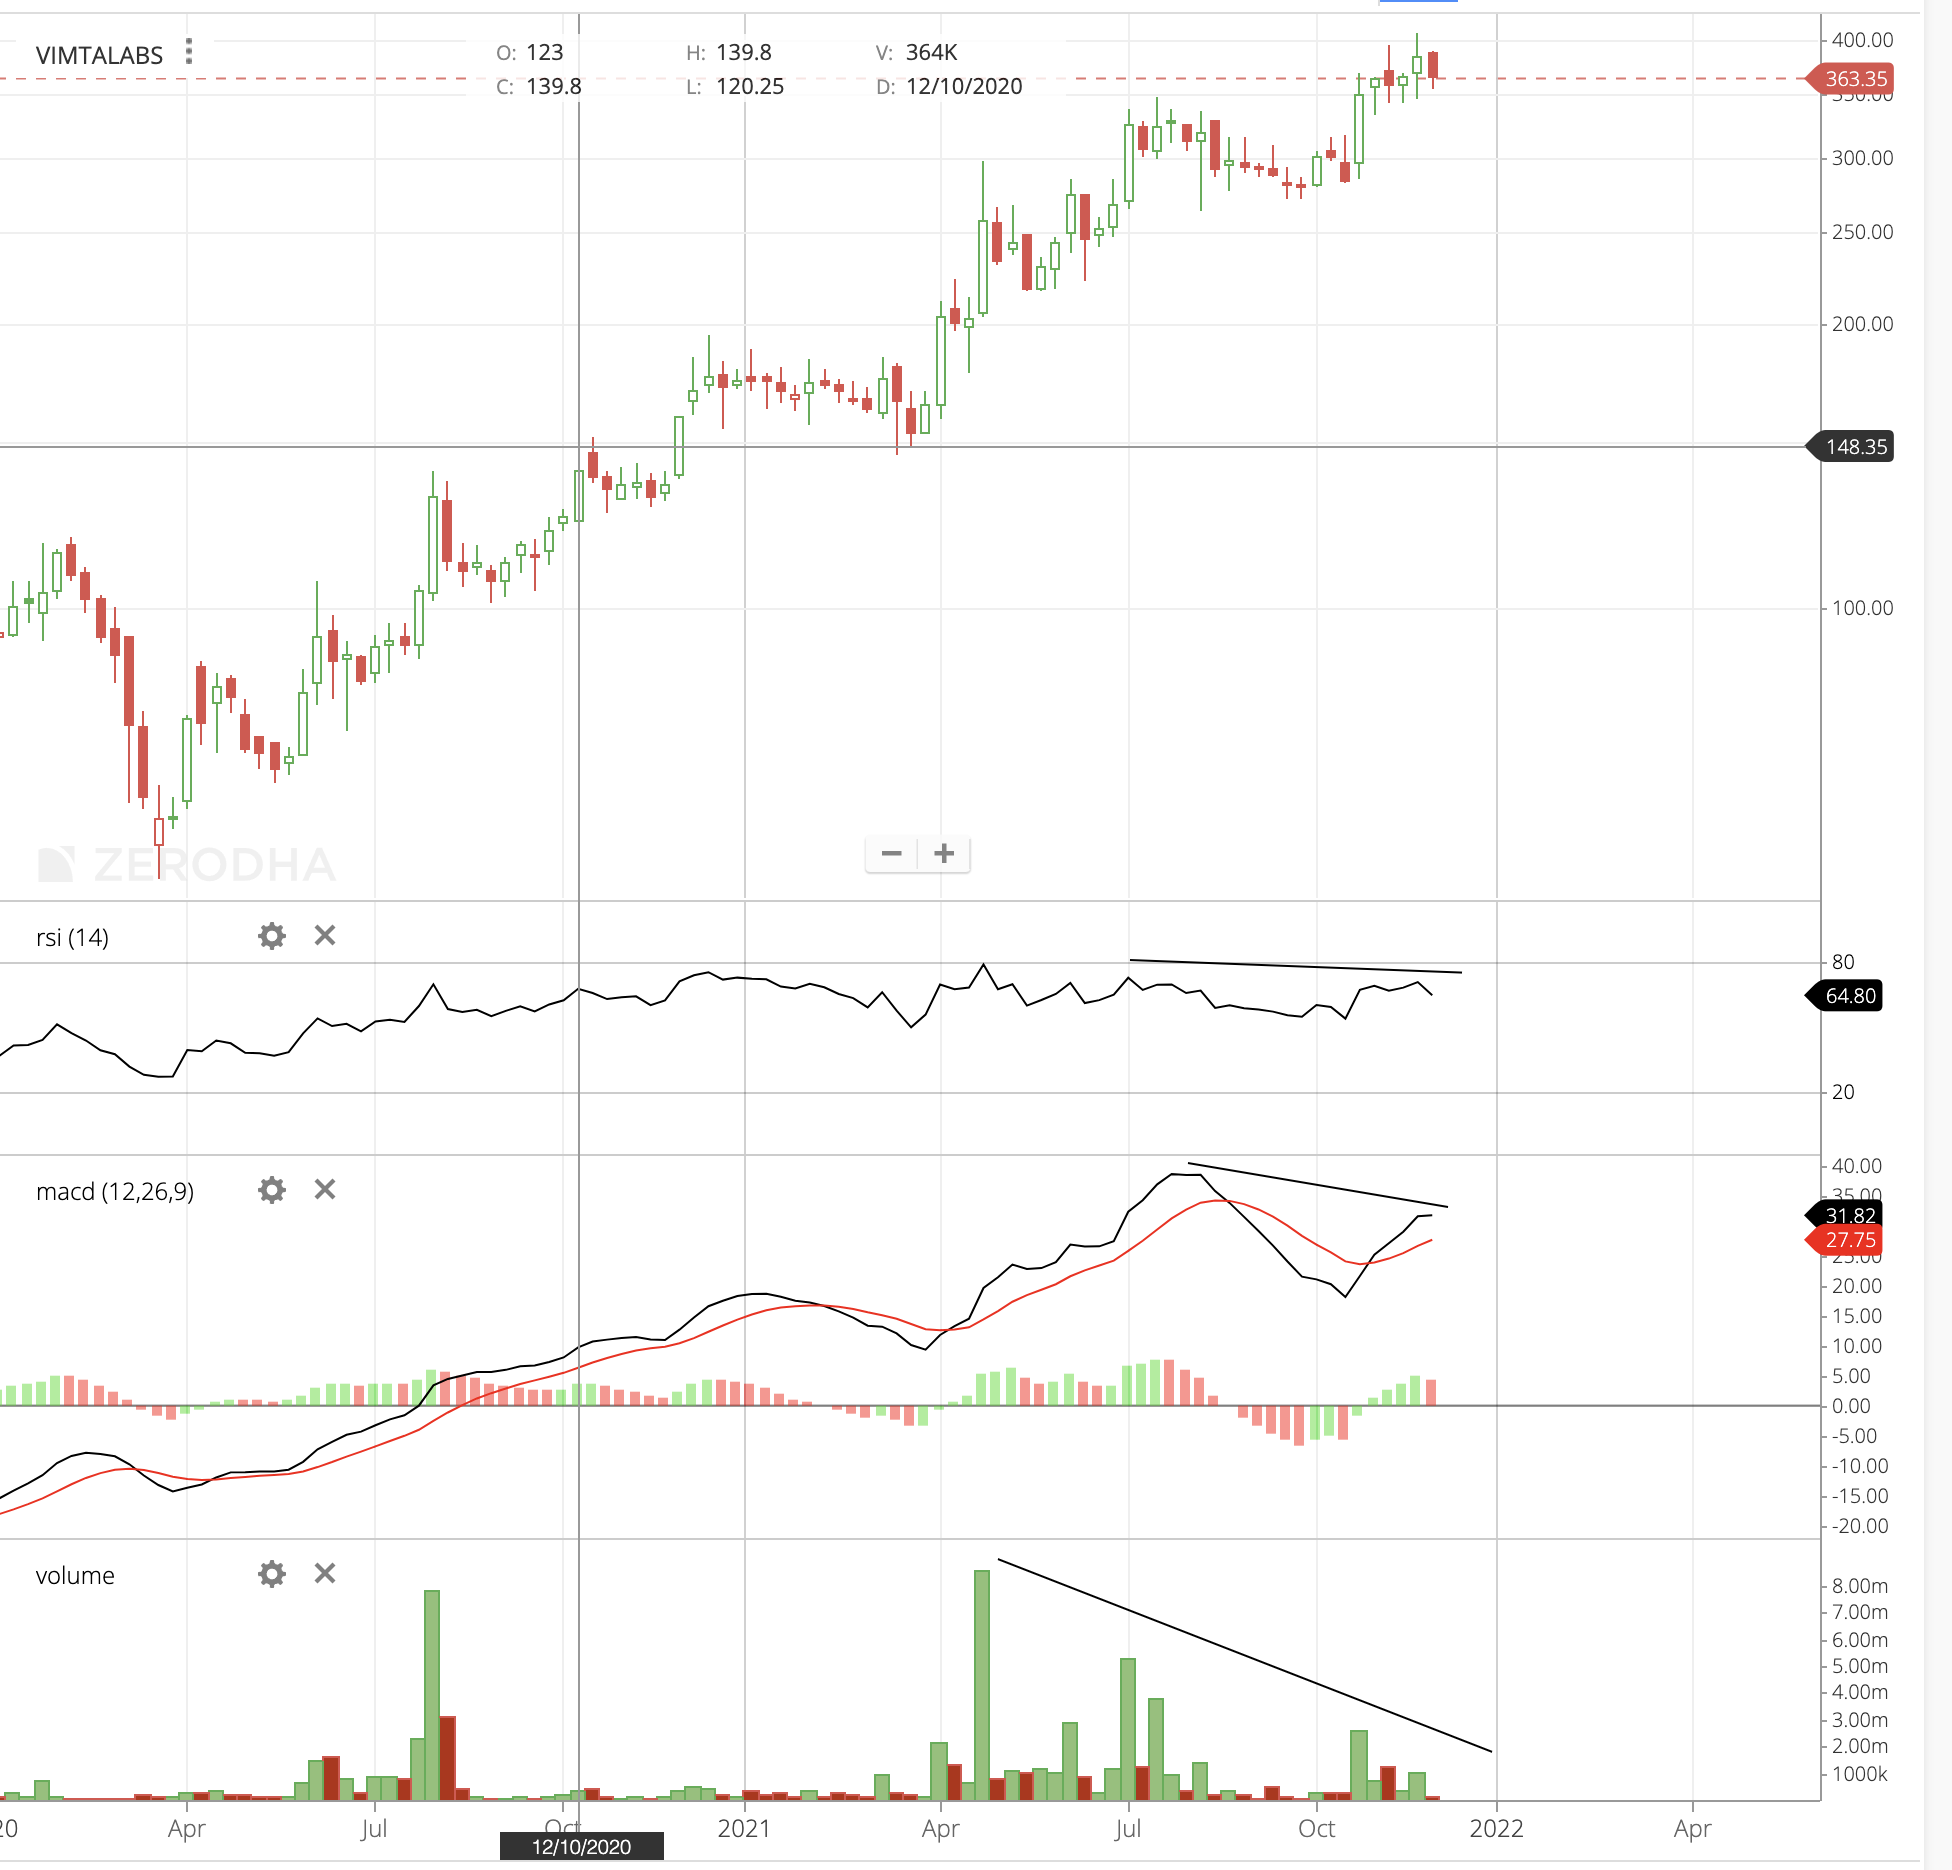
VIMTA labs has an interesting chart pattern. Company is a small cap company with 800 cr market cap. It does pharma and food testing. Company started showing solid growth post Sep 2020 quarter with sales consistently above 58 crores and net profits above 7 crores. Last two quarters sales above 65 crores and net profits above 8 and 9 crores. In concall management seems confident of achieving its aspirational target of sales of 550-600 crores by FY 25. More than double of TTM sales of 250 crores.
Some triggers in near term… 1. Start of food testing lab at JNPT in colloboration with FSSAI for testing all incoming food at the port. Its a contract for 25 years and expected to start contributing from q4 fy 22. FY 23 should see full impact. 2. Company has started clinical type of labs at Kolkata in q1 fy 22 and Delhi in q2 FY 22. Impact of both these should be felt going forward. 3. Company is on verge of having meaningful contribution from electronics and electronics equipment testing division. Overall the business seems to be on a strong wicket.
Chart shows inverted head and shoulders pattern marked in dotted lines and cup and handle marked in solid blue line. Stock price recently crossed its previous all time high of 343, and posted fresh new high above 400 before correcting along with the markets. cmp around 360. If pattern suceeds, target can be 580-600. disc: invested as a techno funda bet.
29 Likes
@hitesh2710 Thanks for highlighting this stock - looks promising on both fundamental and technical parameters. However, there are a few risks that this breakout might fail:
- The reverse H&S has very small shoulders which is usually not characteristic of strong reverse H&S breakouts
- The price is also breaking out of a 14 year upward trendline but has not managed to close conclusively above it. As you can see in the chart of Bharti Airtel below, it took three attempts and 1.5 years to break past conclusively above the 2007 high
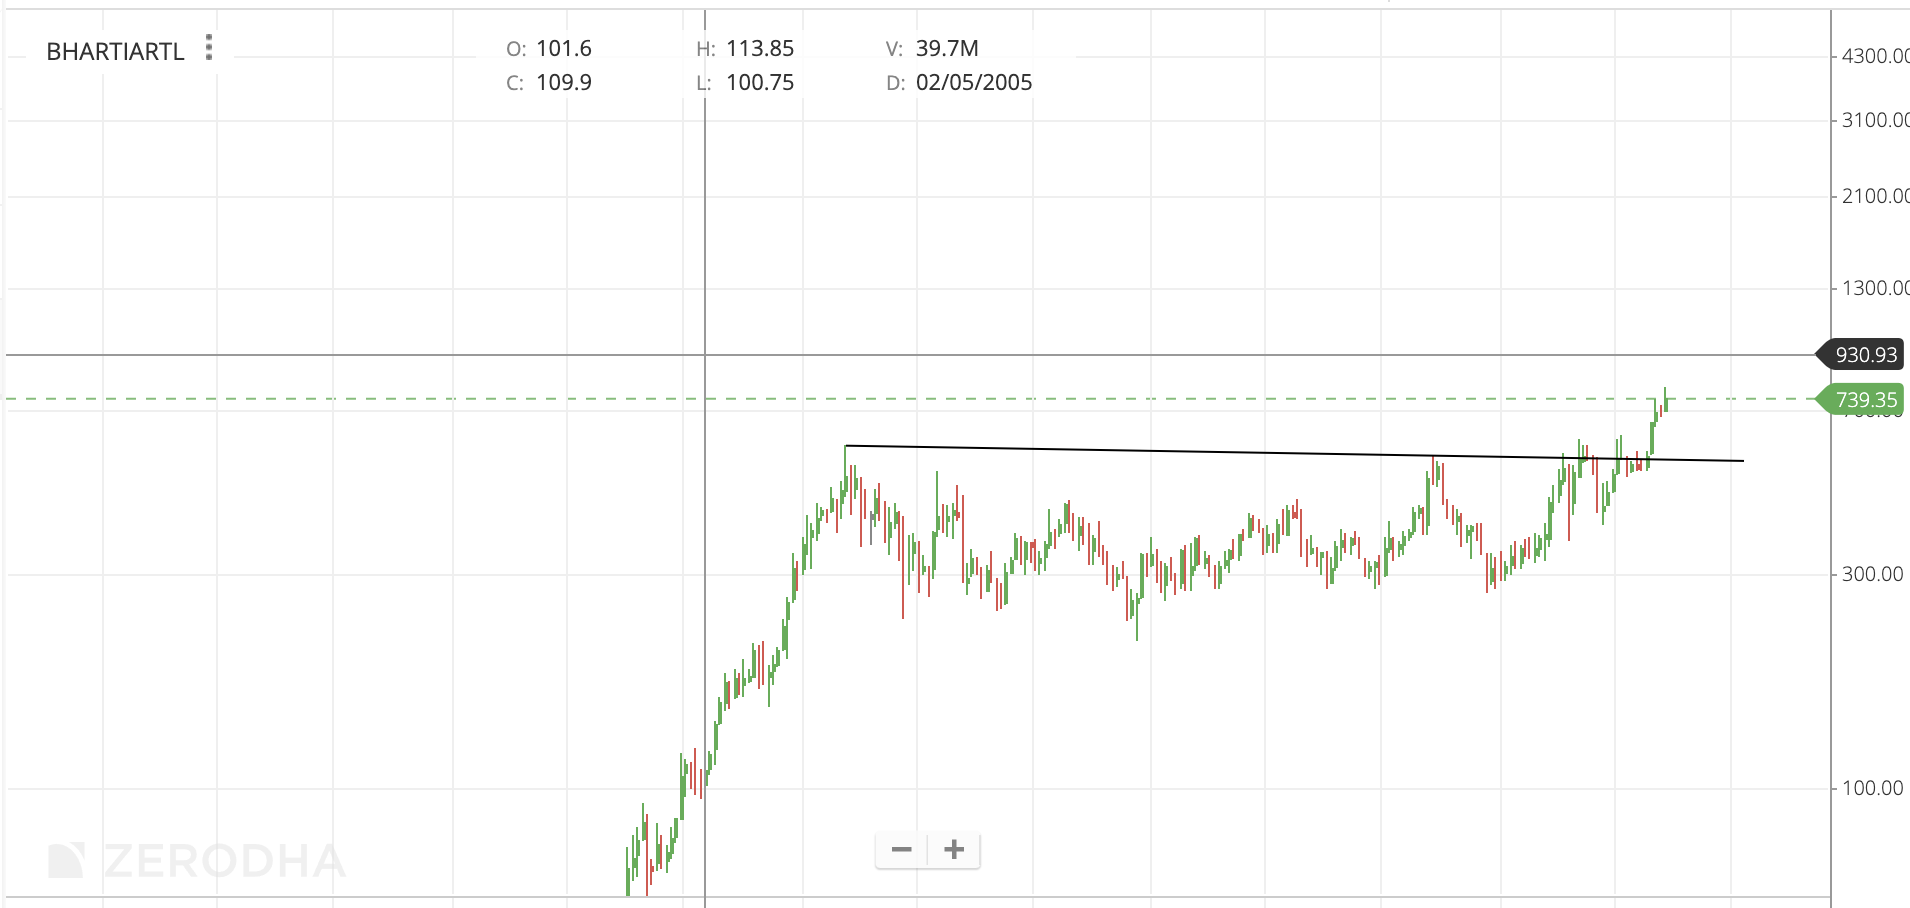
- In the nearer term, RSI, MACD and Volume are all showing negative divergences on the weekly chart
I think the odds of success will increase significantly if the price moves above its recent ATH with good volumes on the weekly
9 Likes
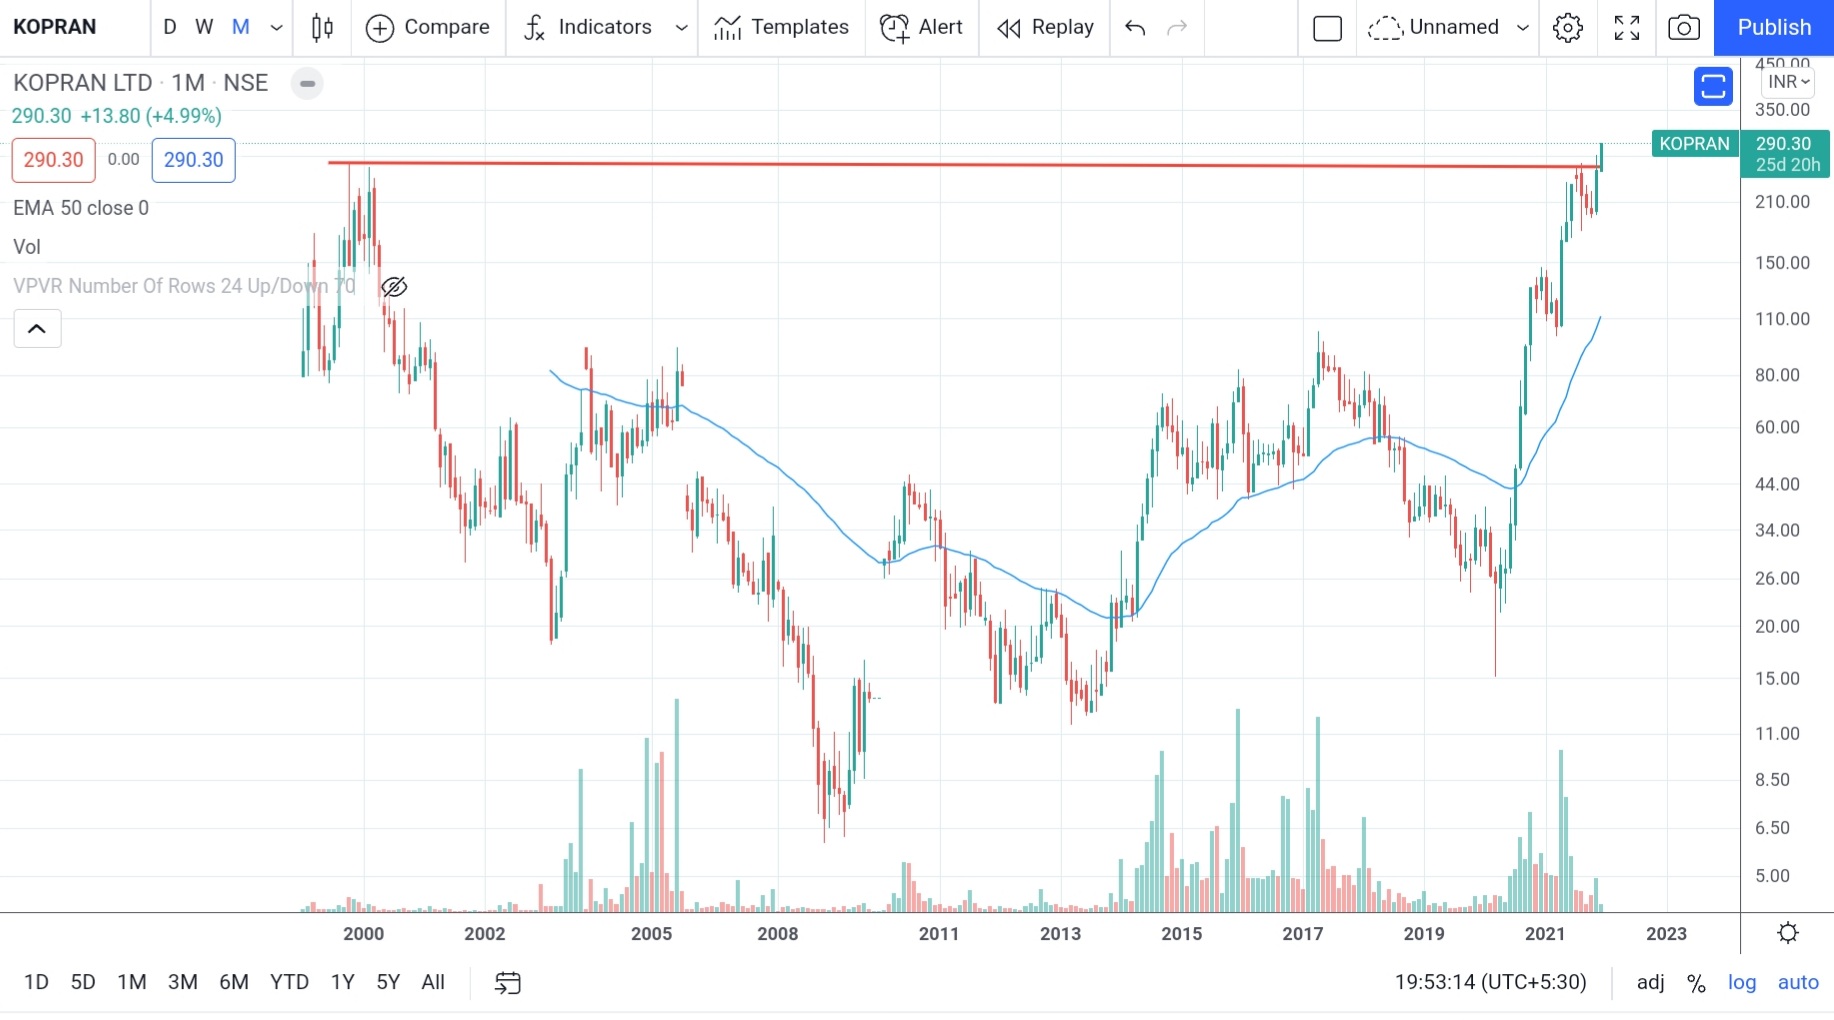
Kopran taking out all time high around 250 ( 20+ years) and been in UC in past few sessions, company has recently completed brownfield expansion and Q2 results have been good( relatively to pharma pack), preferential issue to promoters under consideration as well. Wouldn’t know targets in such cases but should do well if seen fit as a saucer case, experts can comment.
4 Likes
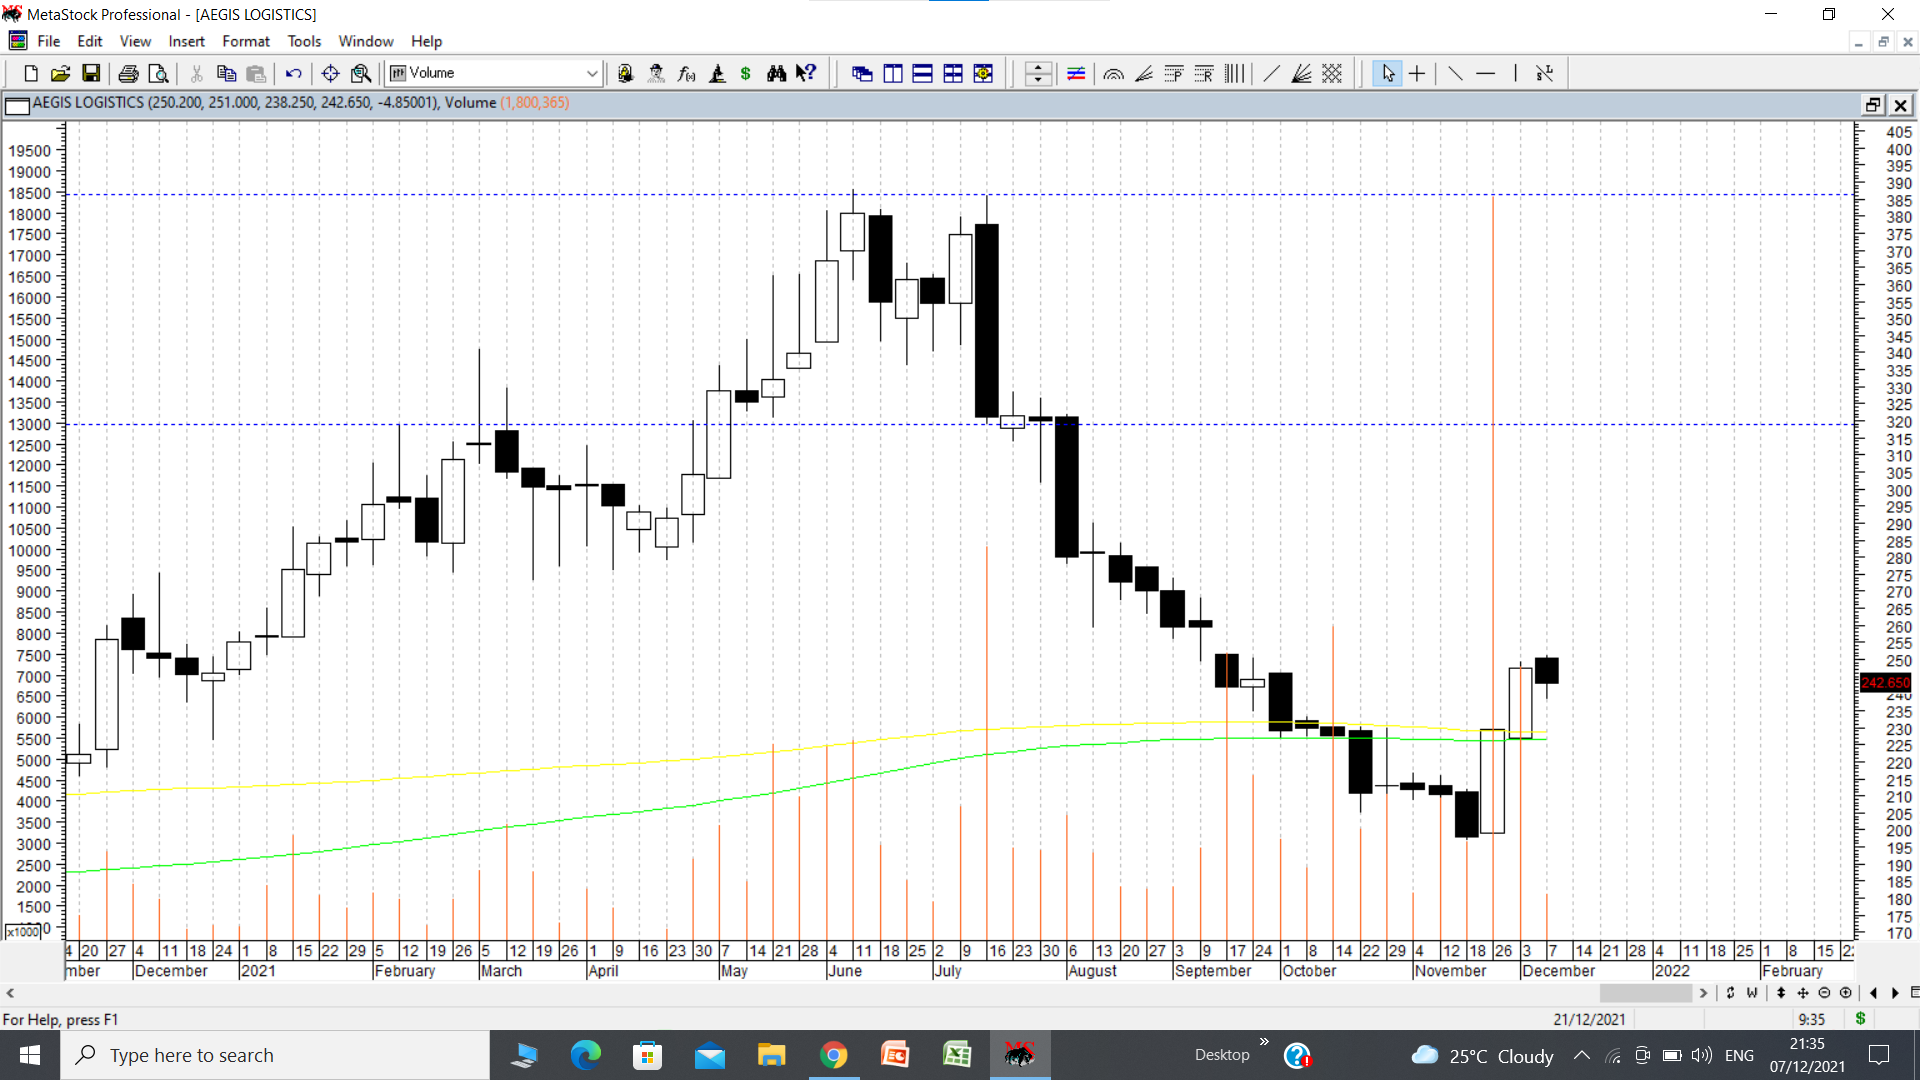
Aegis logistics is a company which has been discussed in a lot of details on VP. The attached chart shows a bar reversal candlestick dated 16/07/2021 where the bearish body of the candle covered bodies of preceding 3 weeks. (bearish candle is when open is high and close is low and body is big and covers bodies of preceding candle/s). There were huge volumes and stock went into a corrective phase and stock price corrected from high of 386 to 197 in a matter of 16 weeks. This was associated with negative news flow related to Volpak deal and untimely death of Anish chandaria, the driving force from promoter family. In the week week ended 26/11/2021, amidst heavy market weakness in small and midcaps, the stock price made a big bullish candlestick and the body of the candle engulfed the bodies of preceding 5 weeks and again volumes were heavier than the candlestick from where the fall began.
So we have a strong bullish candlestick reversal with huge volumes amidst weak markets followed by another reasonably big bullish candlestick. Stock still remains below its 200 dema at 261. 237-238 remains a strong pivot to monitor. disc; invested as a trading bet.
23 Likes
Update on polyplex posted earlier. Today stock price broke out of a small cup and handle and posted fresh all time high with heavy volumes. Note very heavy volumes during up days in last 3 volume uptick days. The low cheat entry discussed earlier at the time of posting polyplex chart is marked in dotted lines. Cup height is from 1650 t0 1960. Breakout point is 1960. Near term technical target is around 2260. Fundamentally spreads in BOPP and BOPET films have improved. And polyplex has made an announcement that it has commenced a new line in Indonesia.
8 Likes
@hitesh2710 Sir isn’t there a mountain of resistance to climb for this stock now? I thought the whole point of this 52 w high / all time high strategy was that there would be no past buyers sitting at a loss who would want to unload the stock creating least resistance for the stock to continue to climb higher… Why pick a fallen stock like this? Is this a value buy or is it really based on technicals? Thanks
Mayur crossing all time high on monthly ( assuming close is good for remainder of month),
If cup and handle is considered, significant upside visible, it’s an auto ancillary and been a market darling in past glory, lot more details in its own thread

8 Likes
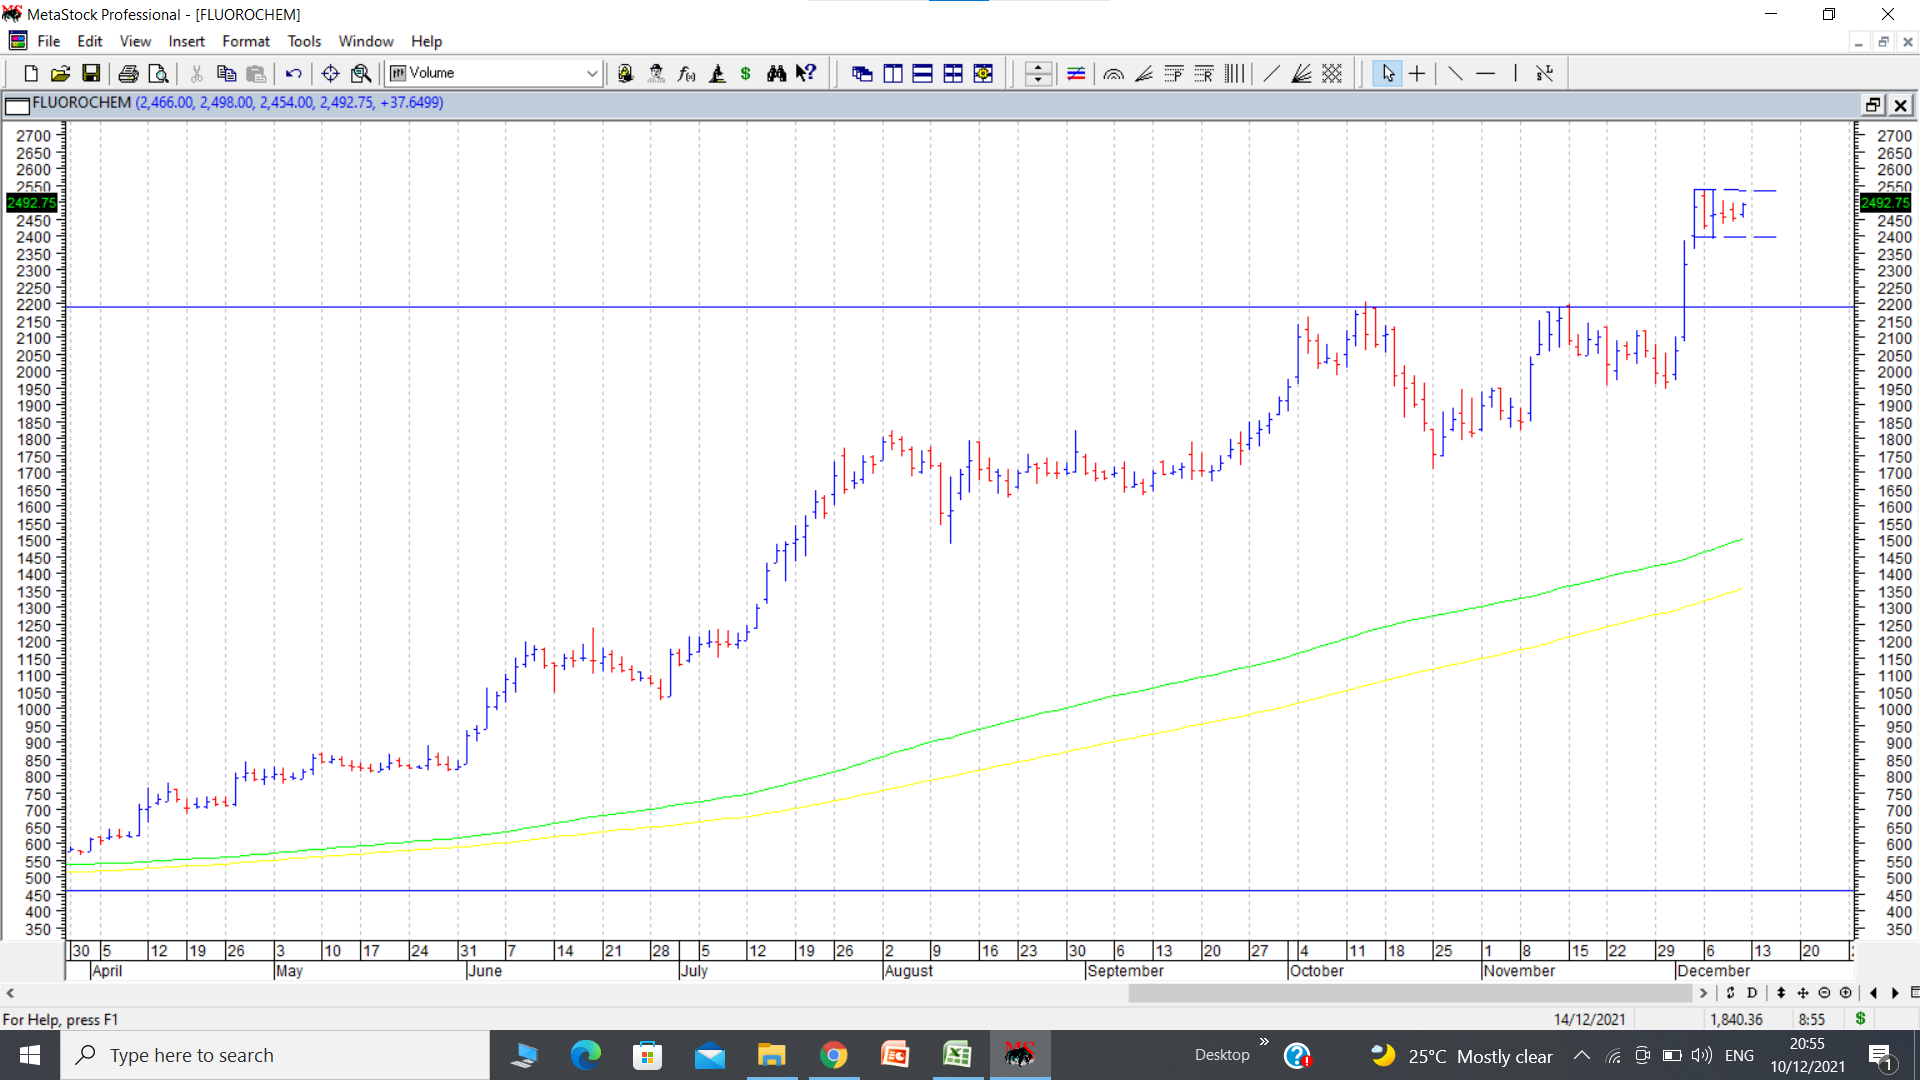
Guj Fluorochem is a company with a strong earnings trajectory. It has been showing good q on q and y on y growth in sales and earnings. Concall commentary is also encouraging. Its a company well discussed on VP thread.
Coming to technical picture, it broke out of a cup and handle pattern above 2193 and went up to 2540. Since past many trading sessions it has been consolidating in a tight range. It also has formed a flag with flagpole between 1945 to 2540, a height of 600 rs. A breakout above 2540 with volumes can provide a breakout from this flag pattern and if successful, targets can be 3100 in near term. disc: invested as a techno funda bet.
12 Likes
Aegis is a contra bet and the technical logic is posted along with the chart. Its a trading bet with clear cut target and well defined risk reward.
Since I post most of my technical stuff on this thread, hence posted it here. Its a different model from the 52 week highs and all time highs philosophy. But this difference is well explained in the write up along with chart.
4 Likes
Tips ATH and 52W high break out - sector in fancy with tailwinds and demerger of music ( high growth and returns) and films in final stages. Pretty good returns in an year with 250 to now 1700,
Cup and handle breakout after consolidation of few months, depth of cup being 600, can reach targets of 2000+.
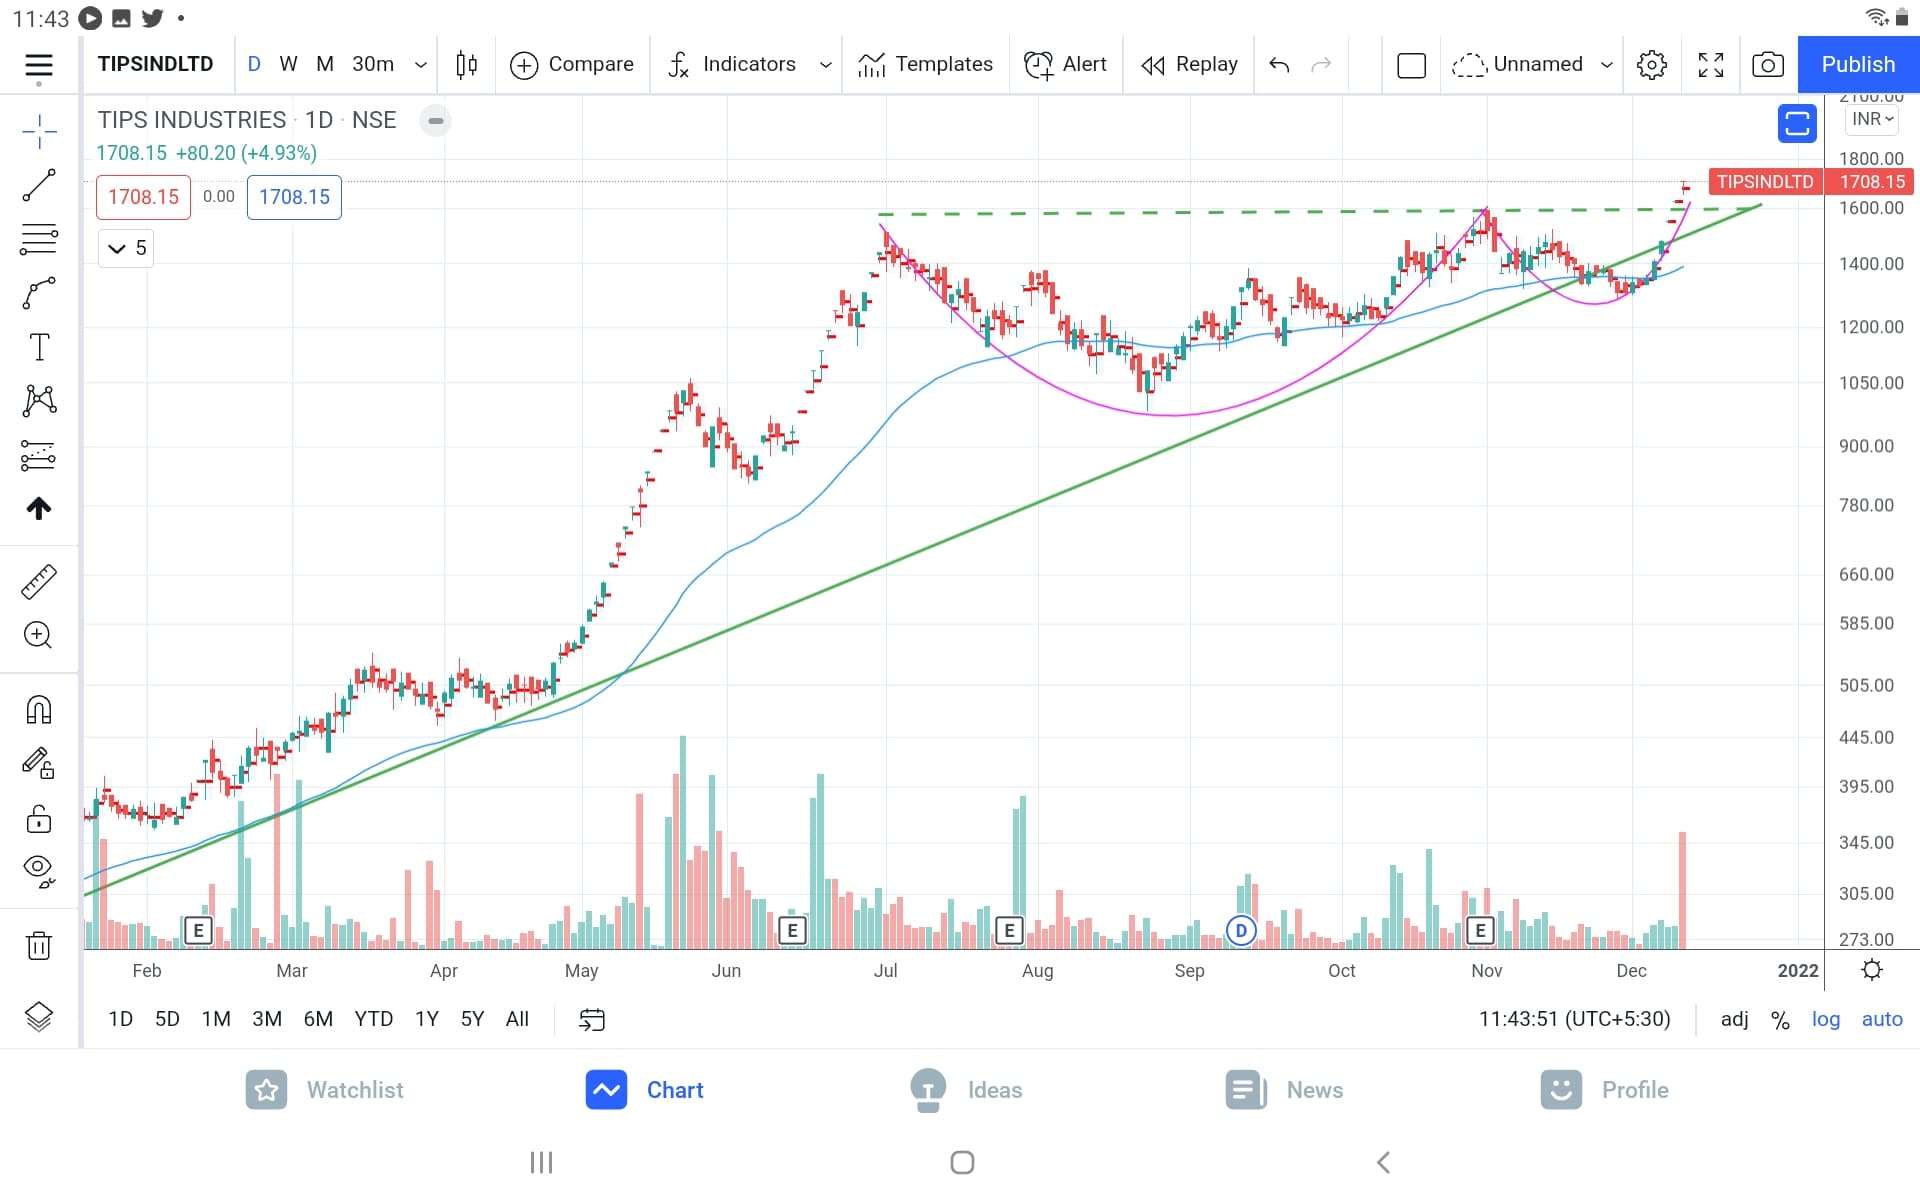
@hitesh2710, fellow VPers - how to interpret last Friday volume spike in red with volume( it was actually opening at UC and closed at UC as well, red bar is probably due to decent volume at upper band and opeing at 1709 closing at 1708, hence shown as red. Would be a good learning to hear your thoughts.
Invested from much lower levels
4 Likes
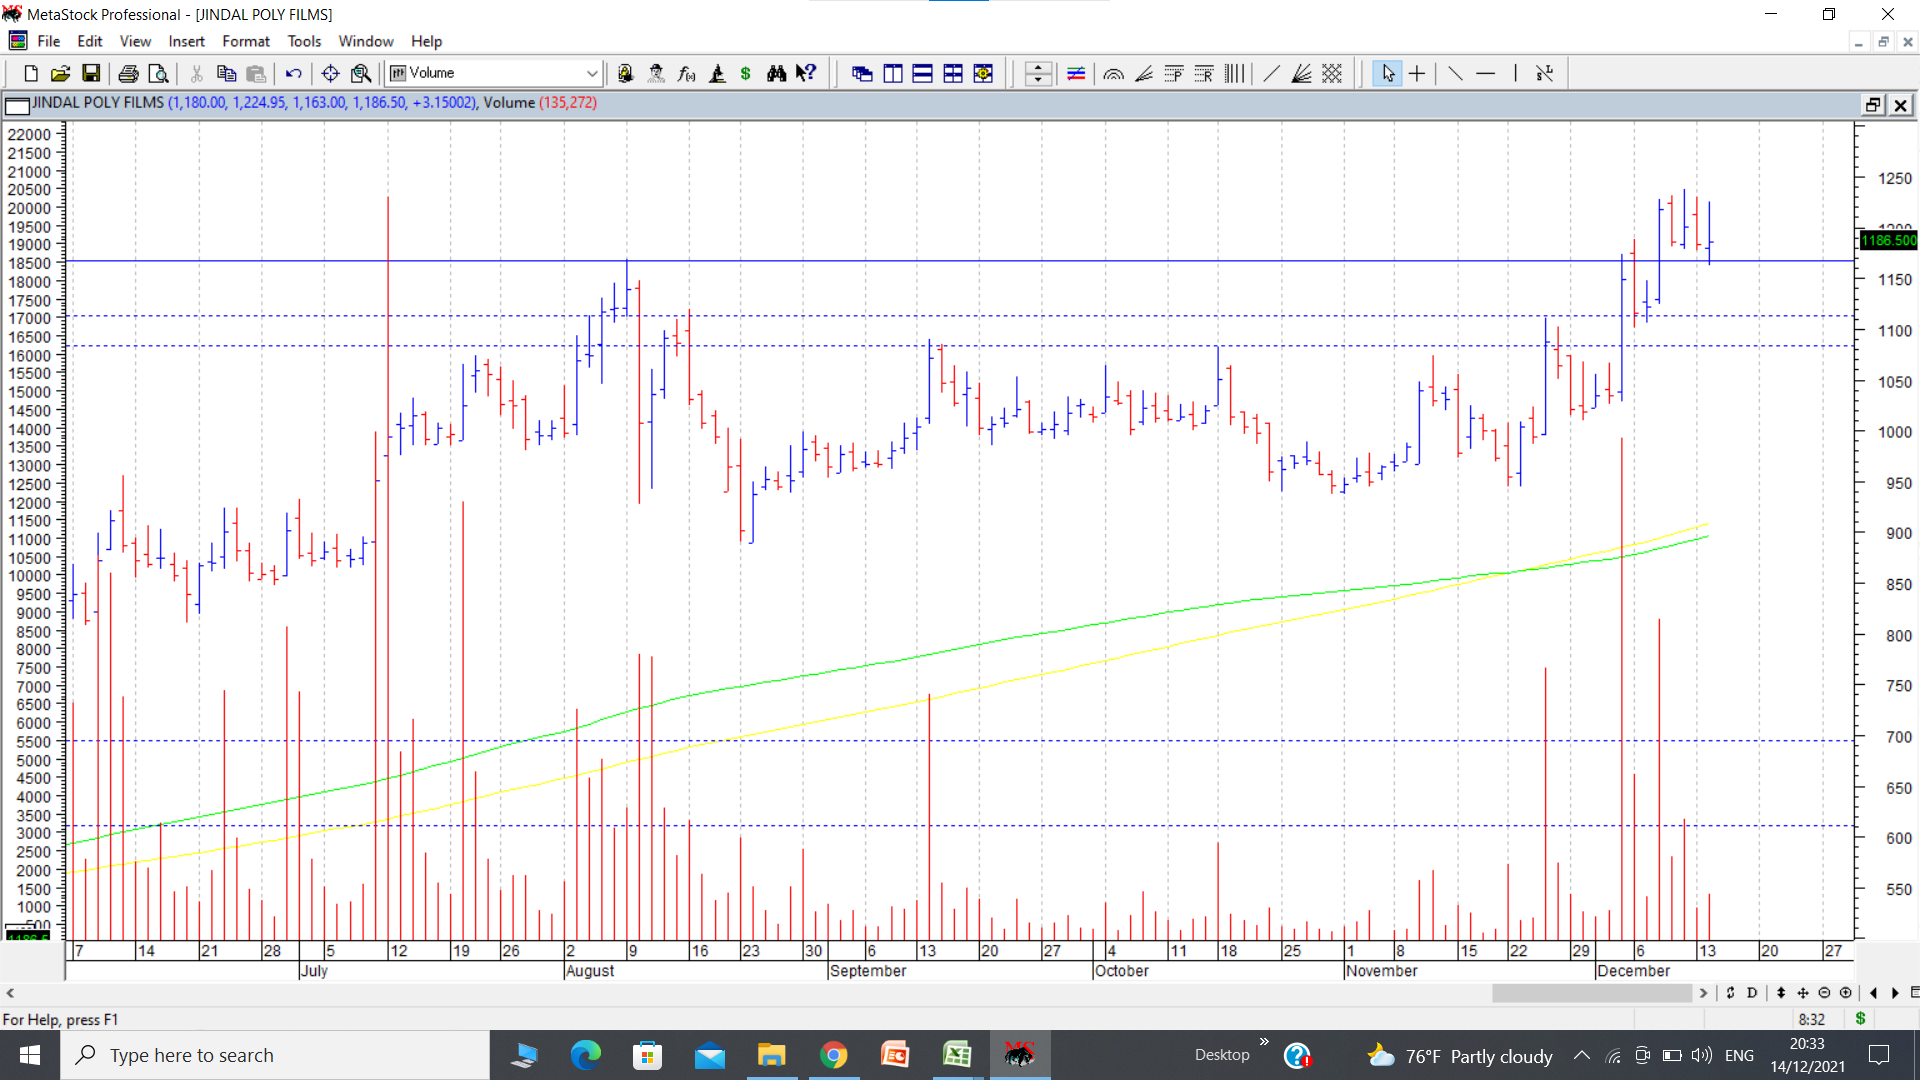
Jindal poly has been showing relative resilience in the markets since past few weeks. Along with other polyfilm companies like polyplex, it too has managed to hit fresh all time highs. In the chart attached, it posted all time high of 1168, gave retracement to around 900, and then again moved up to hit fresh all time highs. Currently consolidating just above and around the previous all time high levels of 1168. Big volumes on 3rd Dec 2021, when previous ATH was taken out. Considering the relative outperformance compared to overall markets and sectoral tailwinds, it seems interesting. disc: invested as a trading bet.
11 Likes
SP Apparels is a textile company in kids wear segment hit its 52w high of 450 yesterday. It is also close to its all time highs of 470 range that it hit in june 2017.
It has continued in its upward journey from 160 to 450 respecting the 50 DMA. Even in the market sell off in the past few days it was resilient around 410 - 390 levels. If 450 gets taken out it will be in a bullish territory.
SPAL is definitely a commodity business with no pricing power. But the bullish commentary from the management lends support to the theory of taking out the ATH.
- 1000 cr+ turnover prediction for FY 22-23.
- China +1 strategy playing out.
- Worker Mobilization issue being a core problem being sorted out.
- Strong demand emanating resulting in the management starting second shift operations from the current quarter.
The entire textile sector that was on a tear was not breaking upwards even after excellent results by almost all the companies in the sector. But a few names like vardhaman tex, PDS, Ambika have started moving up from Monday.
5 Likes