
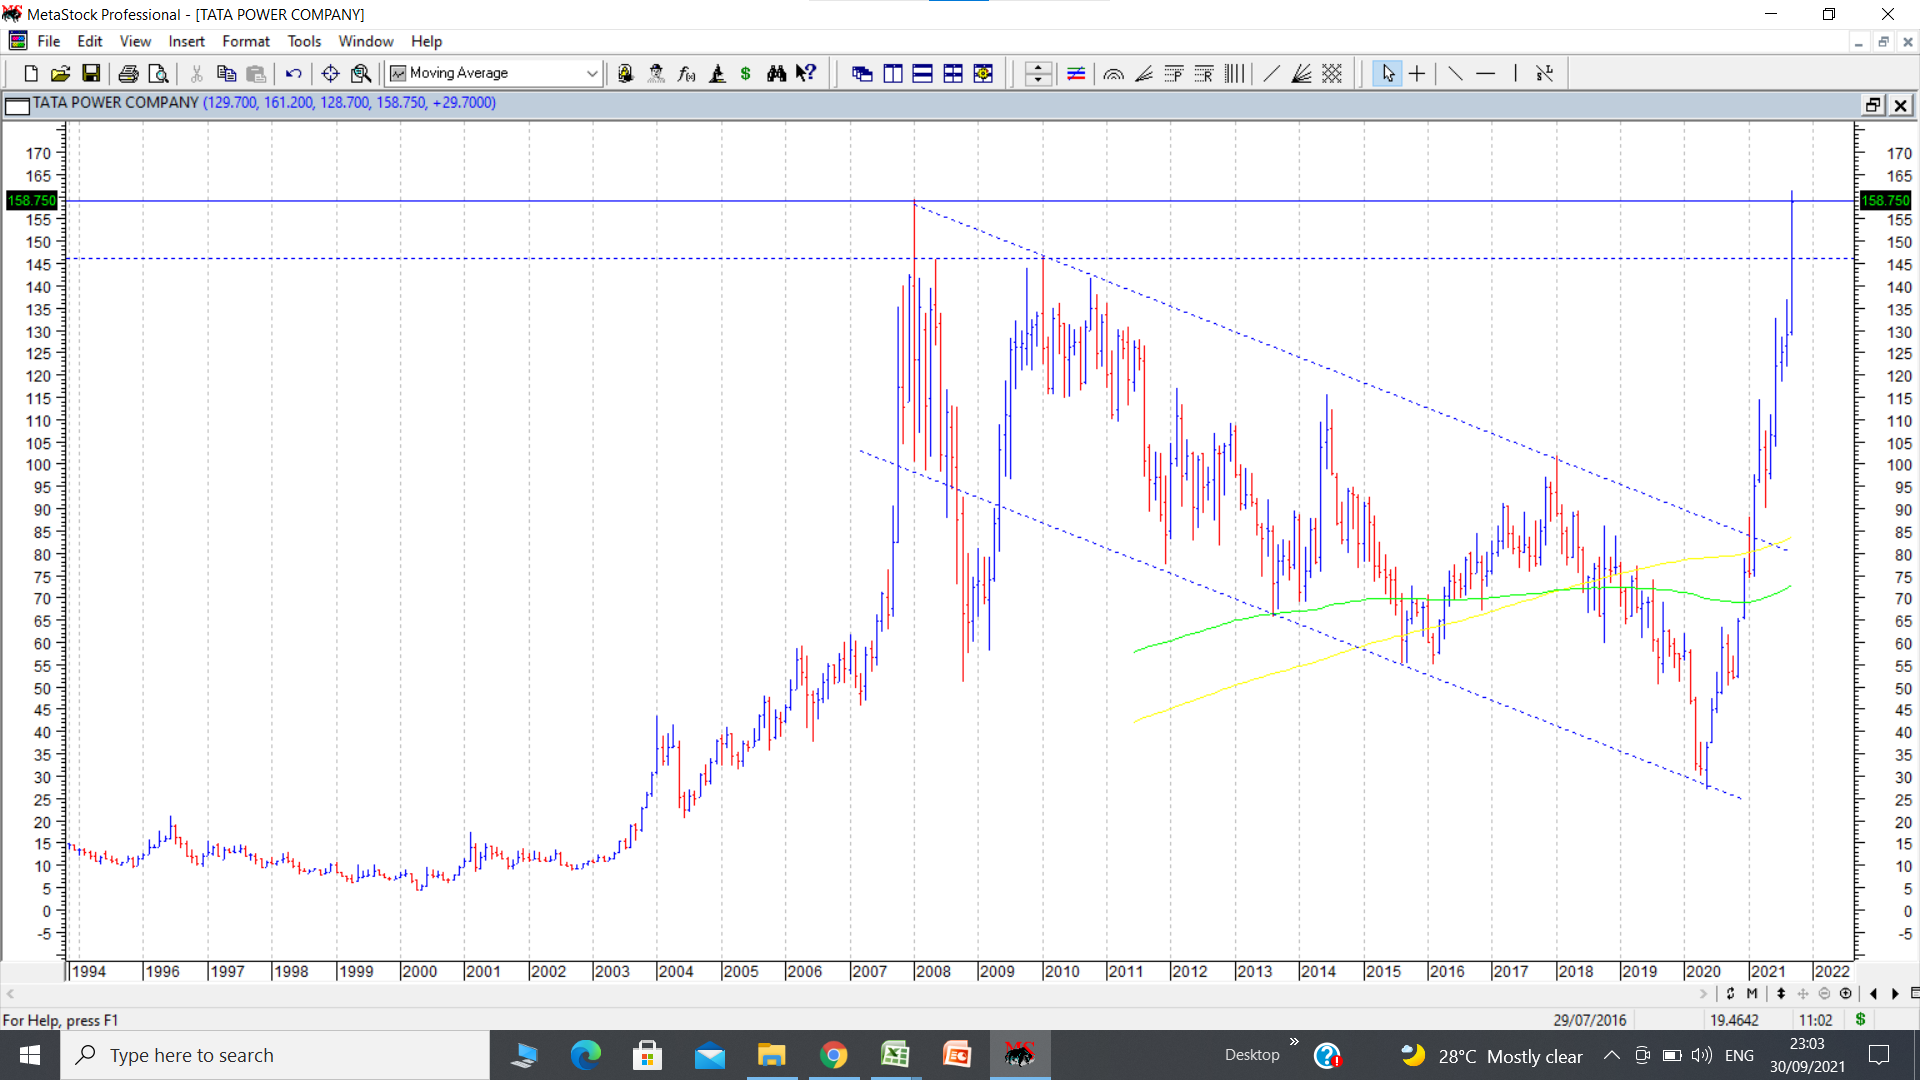
An update on tata power chart put up earlier. The stock price today crossed its previous all time high of 159.25 posted in 2008. The fall from 159 to 27 took nearly 13 years. The rise to take out the high took around 16 months. Much faster retracement of the entire fall. This also indicates the strength of the trend. I expect this company to outperform going forward. disc; invested as disclosed earlier.
33 Likes
Delta Corp weekly showing tremendous volumes indicating institutional interest
I expect some resistance around the level of 280 odd. Maybe it can get into a handle here. Good to keep an eye on for the next breakout post a pause. Next target would be the all time high of 385-400.

Disc;: Invested at 200-210 levels
6 Likes
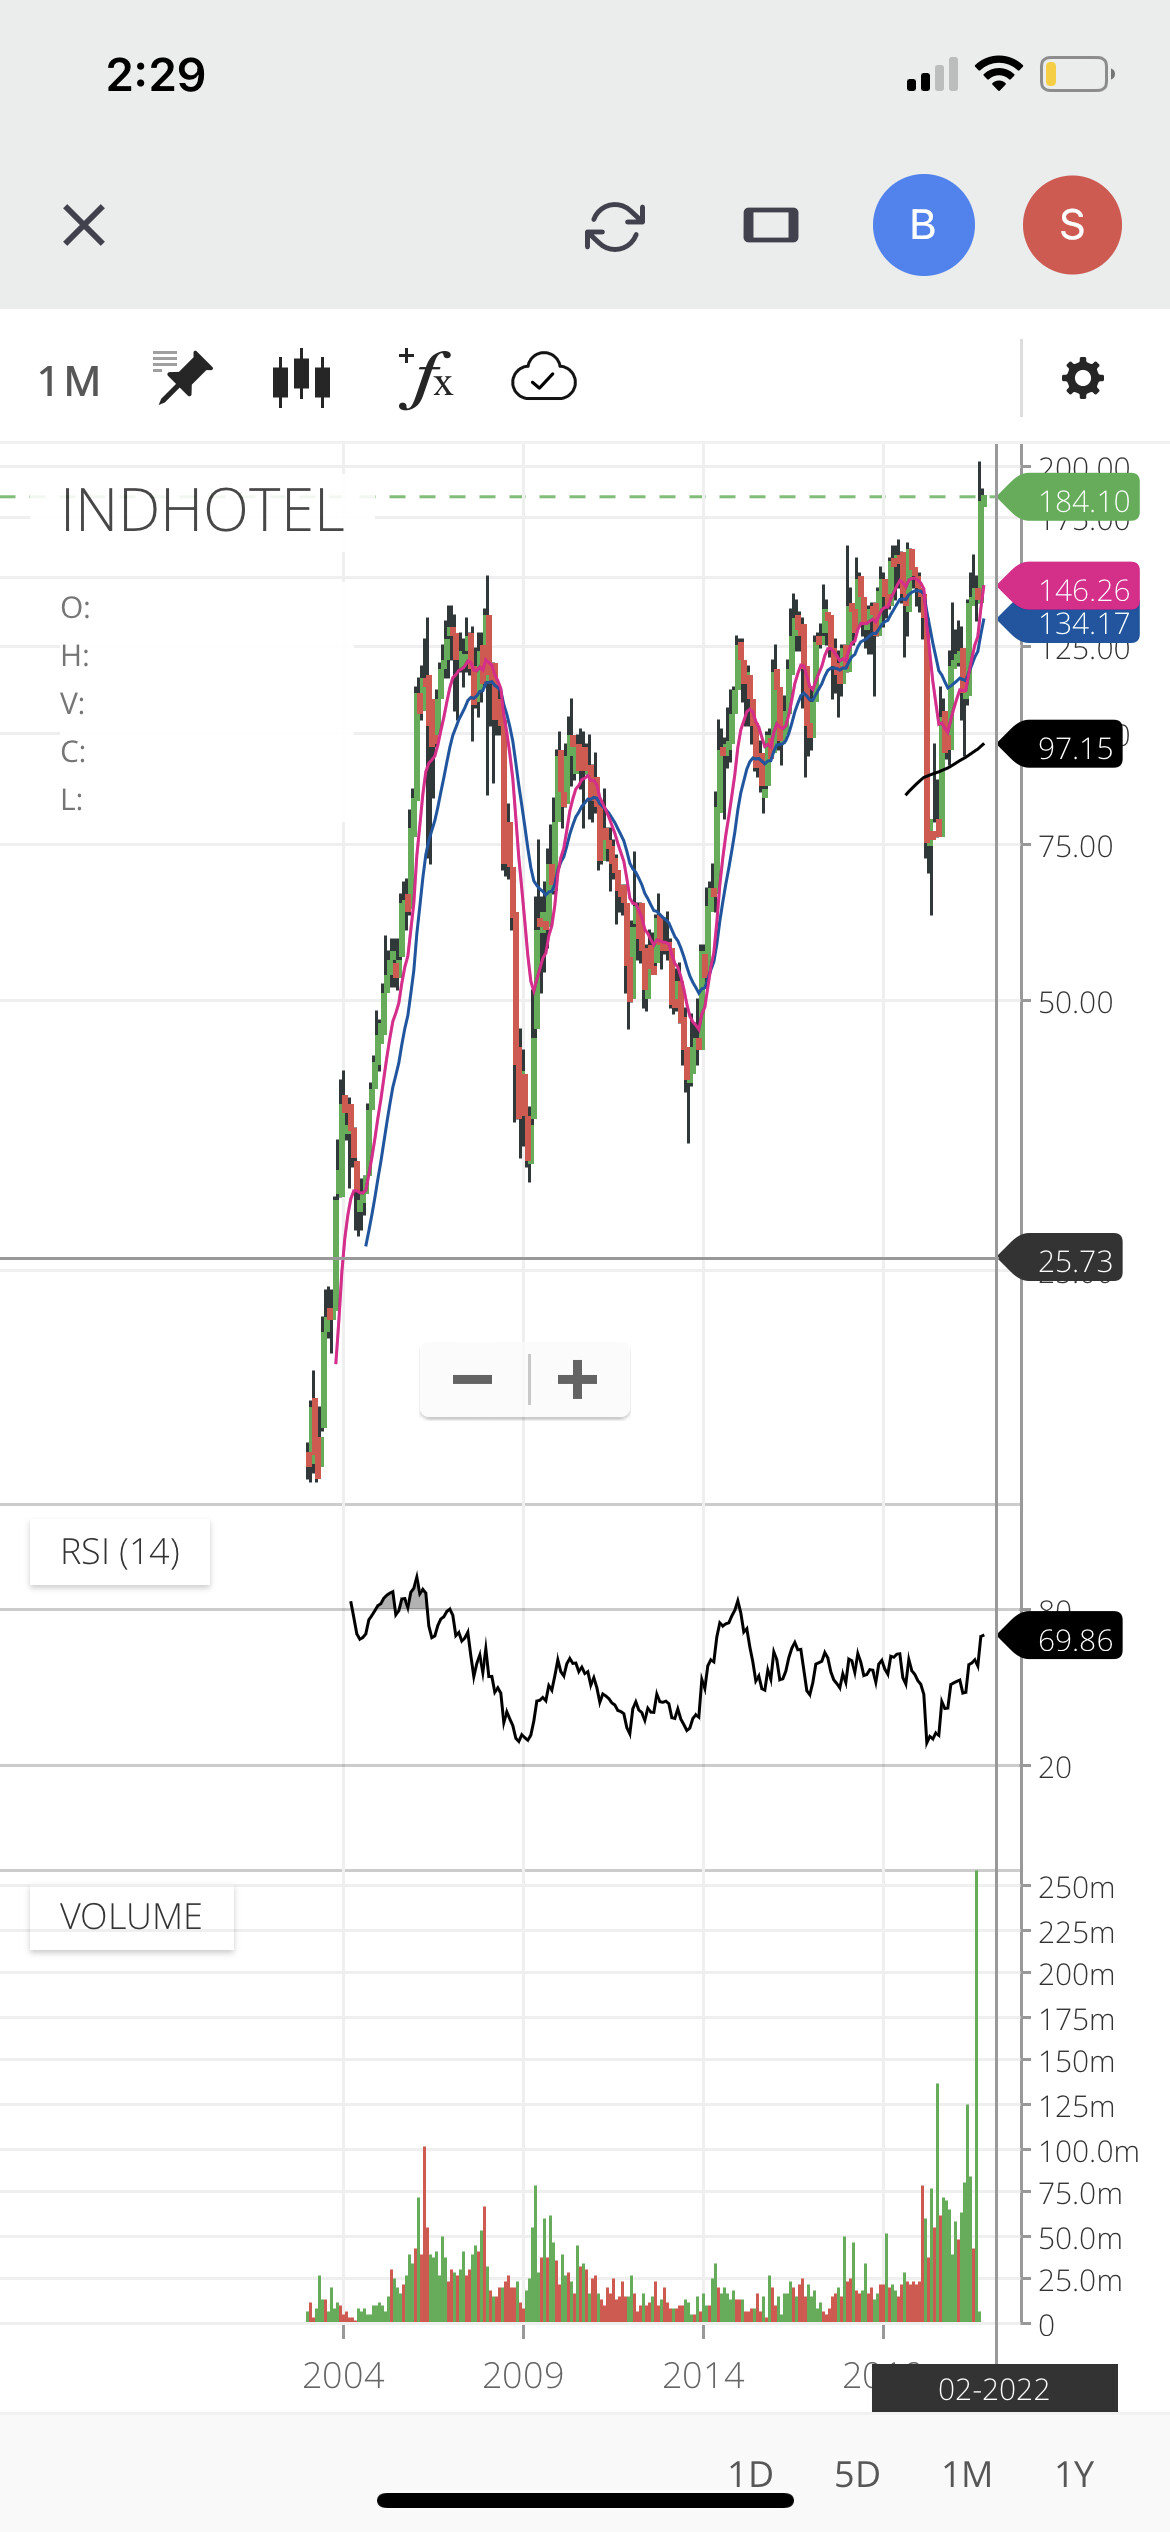
According to some patterns, Indian hotels has initial target of 200 plus. This could be a near term target. But since it has broken out above 165 which is its 13 year high and all time high, I think ultimately it can go much higher. Of course it will have its fair share of rallies and corrections, So idea should be to buy on consolidations or near supports or immediately on breakout post consolidations.
13 Likes
Force Motors is a company involved in small and medium LCV, agricultural vehicles and the about to be launched Force Gurkha. (revamped version looks very good, and competes with Mahindra Thar, though how it fares needs to be seen.) It also manufactures engines for BMW and Mercedes. Few quarters back it had a tie up with Rolls Royce to manufacture non auto engines, though the latter business did not take off as expected due to Covid. The auto sector seems to be the one coming out of Covid woes and some interesting picks seem to be available in the sector. Force Motors chart shows an inverted head and shoulders breakout, and then a retest and now again showing some strength. cmp 1480. Weekly chart shows the beginning of a rounding bottom pattern. If pattern plays out target can be 2240. (as per GMMA charts). disc: invested as a techno funda bet.

25 Likes
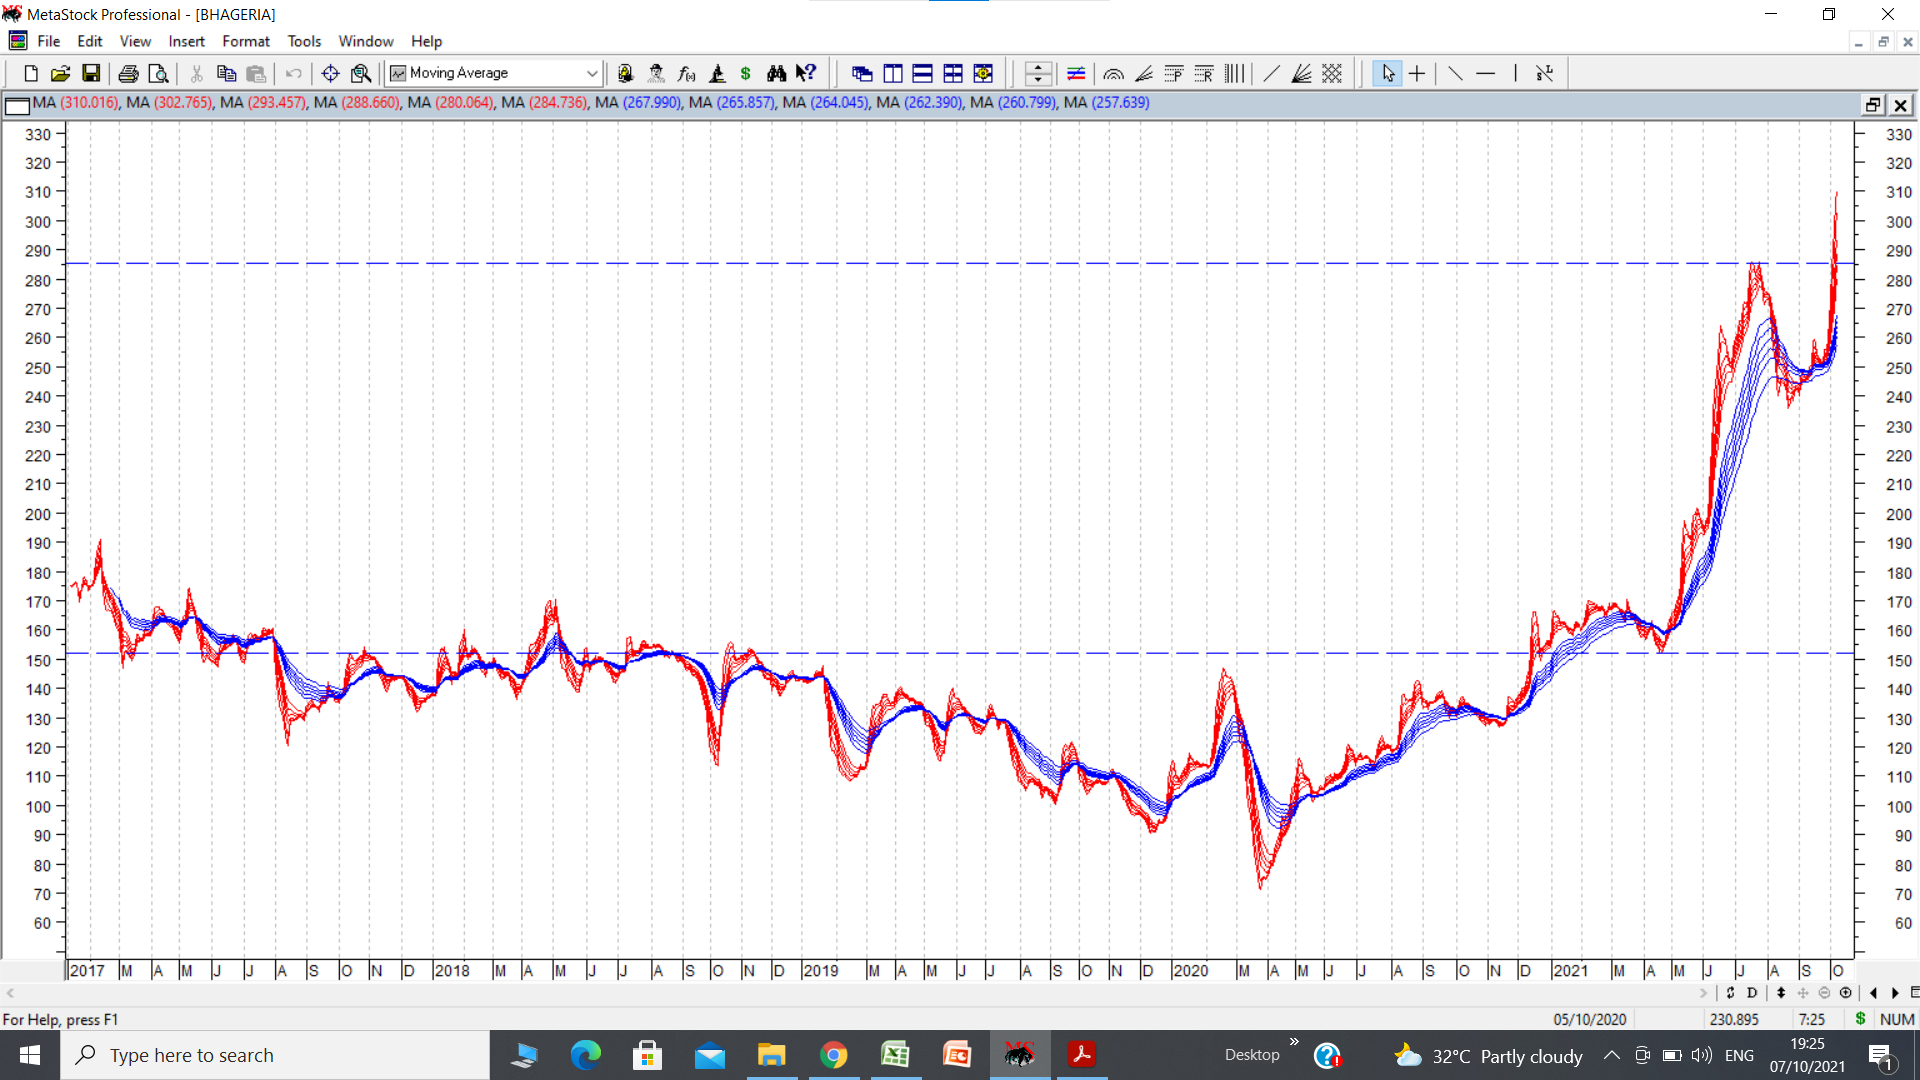
Bhageria Inds is a company which is one of the top 3 in manufacturing H acid and gamma acid. It is backward integrated into manufacturing sulphuric acid. It has ventured into manufacturing J acid and Tobias Acid which are import substitute products. Total incurred and planned capex i 130 crores. It has a solar project business that has an annuity EBIDTA of 23 crores . Company has no long term debt. On charts, crossed its previous all time high of 227 posted in 2016, during its rally to a new all time high in June 2021. Since then it retested the breakout zone in August and has gone above recent high of 296 and is around 310-320. It has been showing good resilience during the market volatility we have been witnessing recently. In the GMMA chart, there is a clear vertical rally visible from 150 to 285 which was followed by a retracement of less than 50% and then stock price has moved up. The distance between dotted lines is 135 Rs. Adding that to breakout point of 285, we get a working target of 420. disc: invested as a techno funda bet.
23 Likes
Update on KRBL. In continuation of chart posted earlier, stock price has crossed the important zone of 300-310 and now seems to have broken out of a double bottom pattern (marked by dotted lines) on weekly GMMA charts. cmp 312. Target can be 400 based on the pattern. (disc; invested as disclosed earlier.)

21 Likes
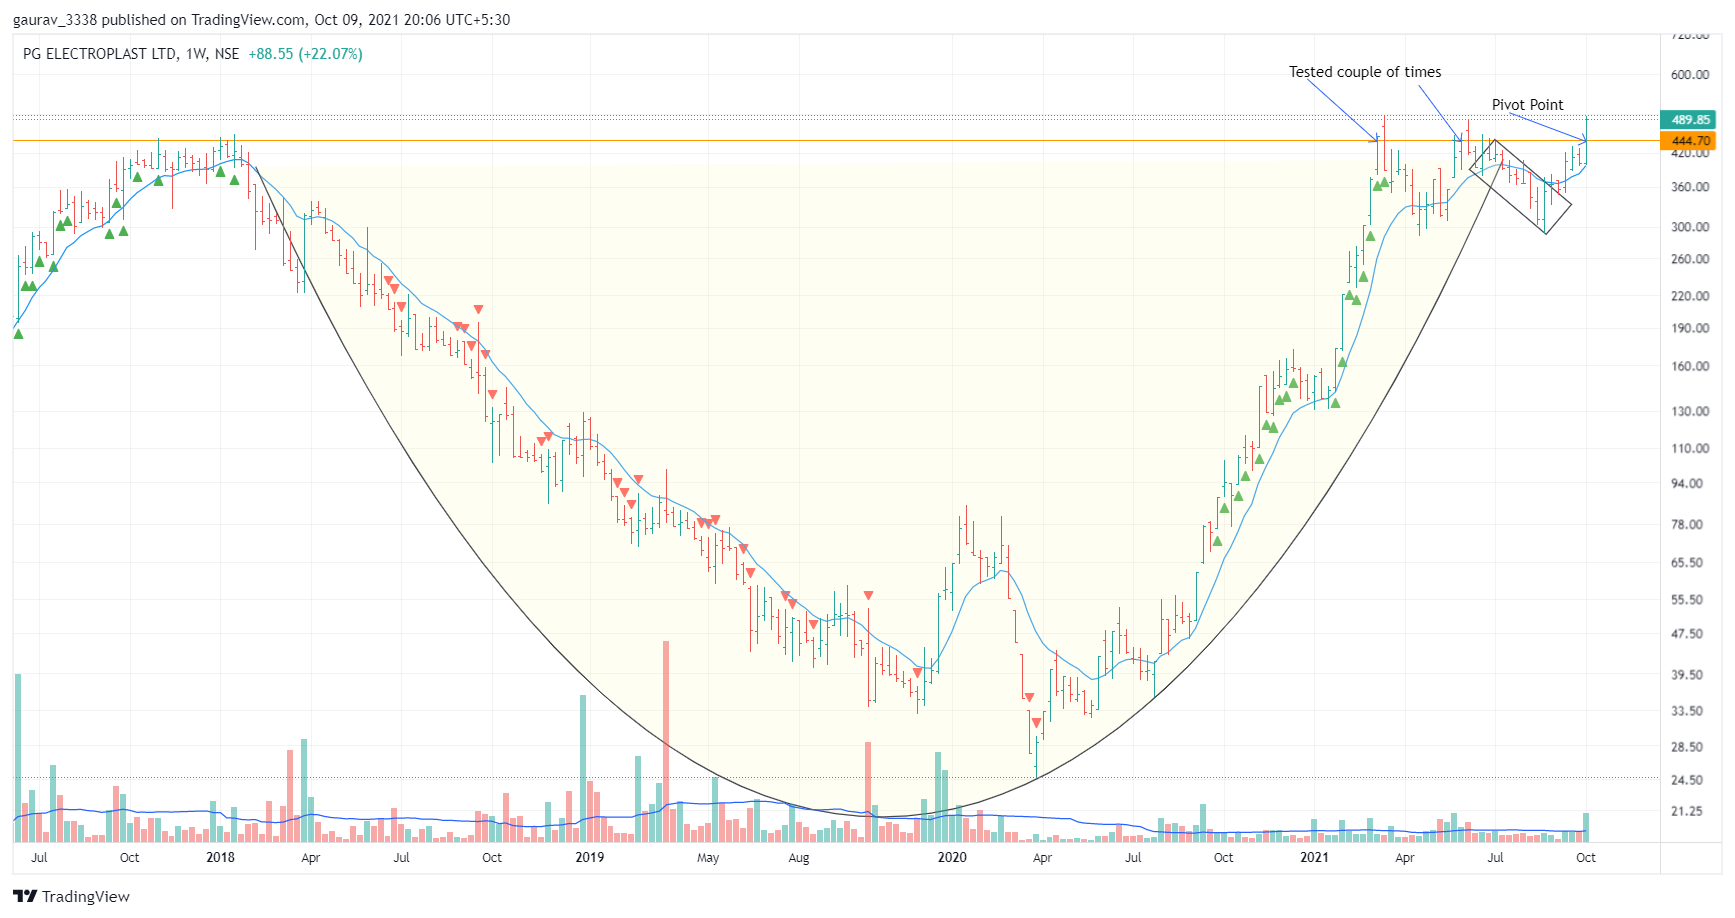
PG Electroplast is a contract manufacturer for consumer durables and electronic companies in India. one of the leading players in India in Electronics Manufacturing Services.
Downstream industries cater to - Consumer Electronics, Domestic Appliances, Automotive Industry, Lighting Systems, Mobile Phones and Sanitary fittings.
Clientele list -Bluestar, Kohler, Honeywell, Havel’s, Voltas, Whirlpool, Crompton, Intex and many more
Net Debt to equity ratio improved to 0.89x in FY2021 as compared to 0.97x in FY2020
The company has grown at a CAGR of 17.61% over the period of (FY 19-21) and expected to grow with same rate or more due to below triggers
Future Growth
- Continuance of the work from home (WFH) culture
- Consumer durables under penetration <10 per cent -massive headroom for growth
- Upcoming Diwali Season
- PLI approval for committed Capex of Rs 300 crores over the next five years for manufacturing air conditioner components. Selection result around 17th November
- Huge capex done from past 5 Years around – 220CR
Risk –
- China power issue hence halt in production. Around 80% supply comes from China
- Shortage of semiconductor
Technically – Multiyear breakout above average volume. Initial 2% allocated around 480. Will add more at next base formation
15 Likes
A recap on SCI chart posted earlier in this thread. As mentioned there was a small weekly flag pattern out of which the stock price had broken. Today the stock price managed to cross the previous swing high of 135 and closed at 139. Now potential flag and double bottom targets of 170-180 could come into play. Besides there seems to be some noise coming through on the divestment front. So looks like the fat is in the fire.
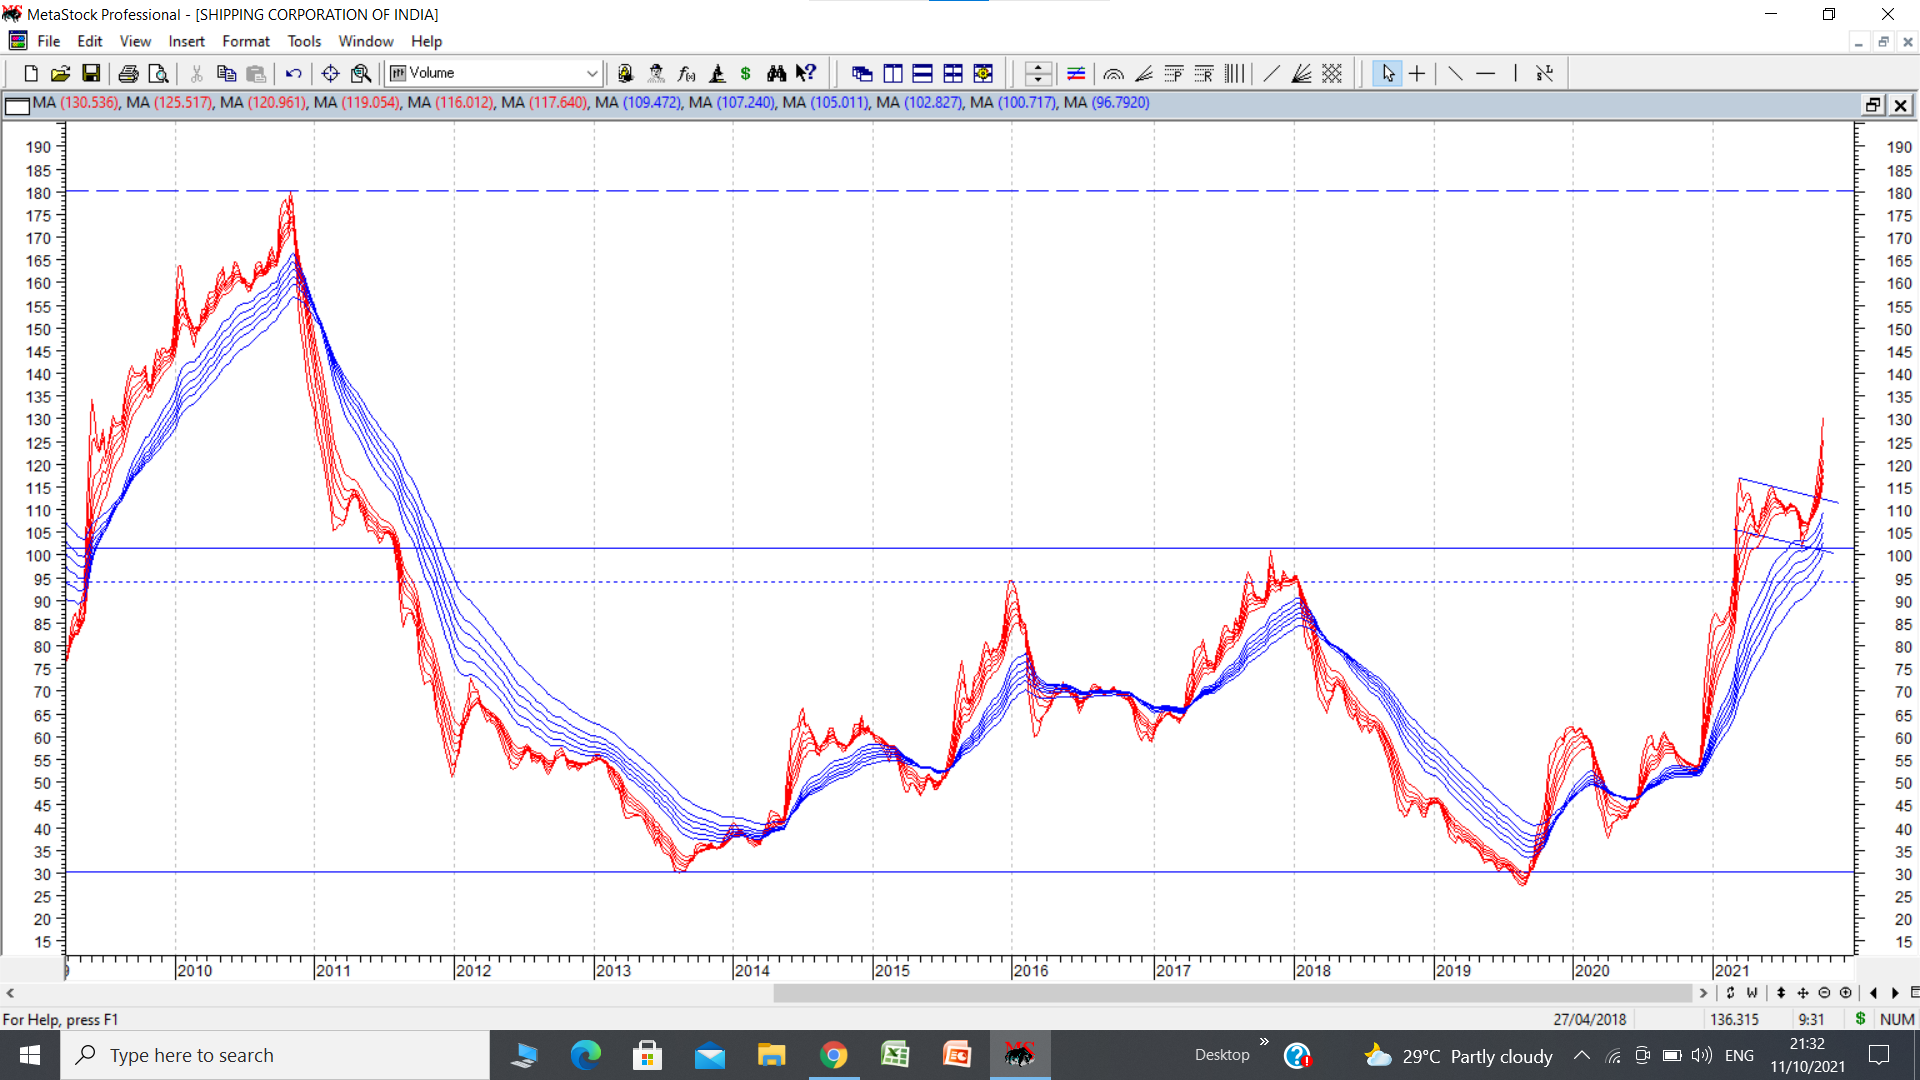
14 Likes
Looking at the charts of various PSU banks, it seems they are readying up for some kind of a rally. Most second and third tier (non SBI) PSU banks seem to have bullish structures. If these structures/patterns play out, there could be decent upsides and one can play these as a basket. Putting up chart of Indian Bank. A cup and handle breakout on weekly GMMA chart, then a retest and now seems to be going up post retest. A dotted line represents a medium term trend line which also seems to be breached. Pattern target for cup and handle is 225. cmp 145. disc: invested.
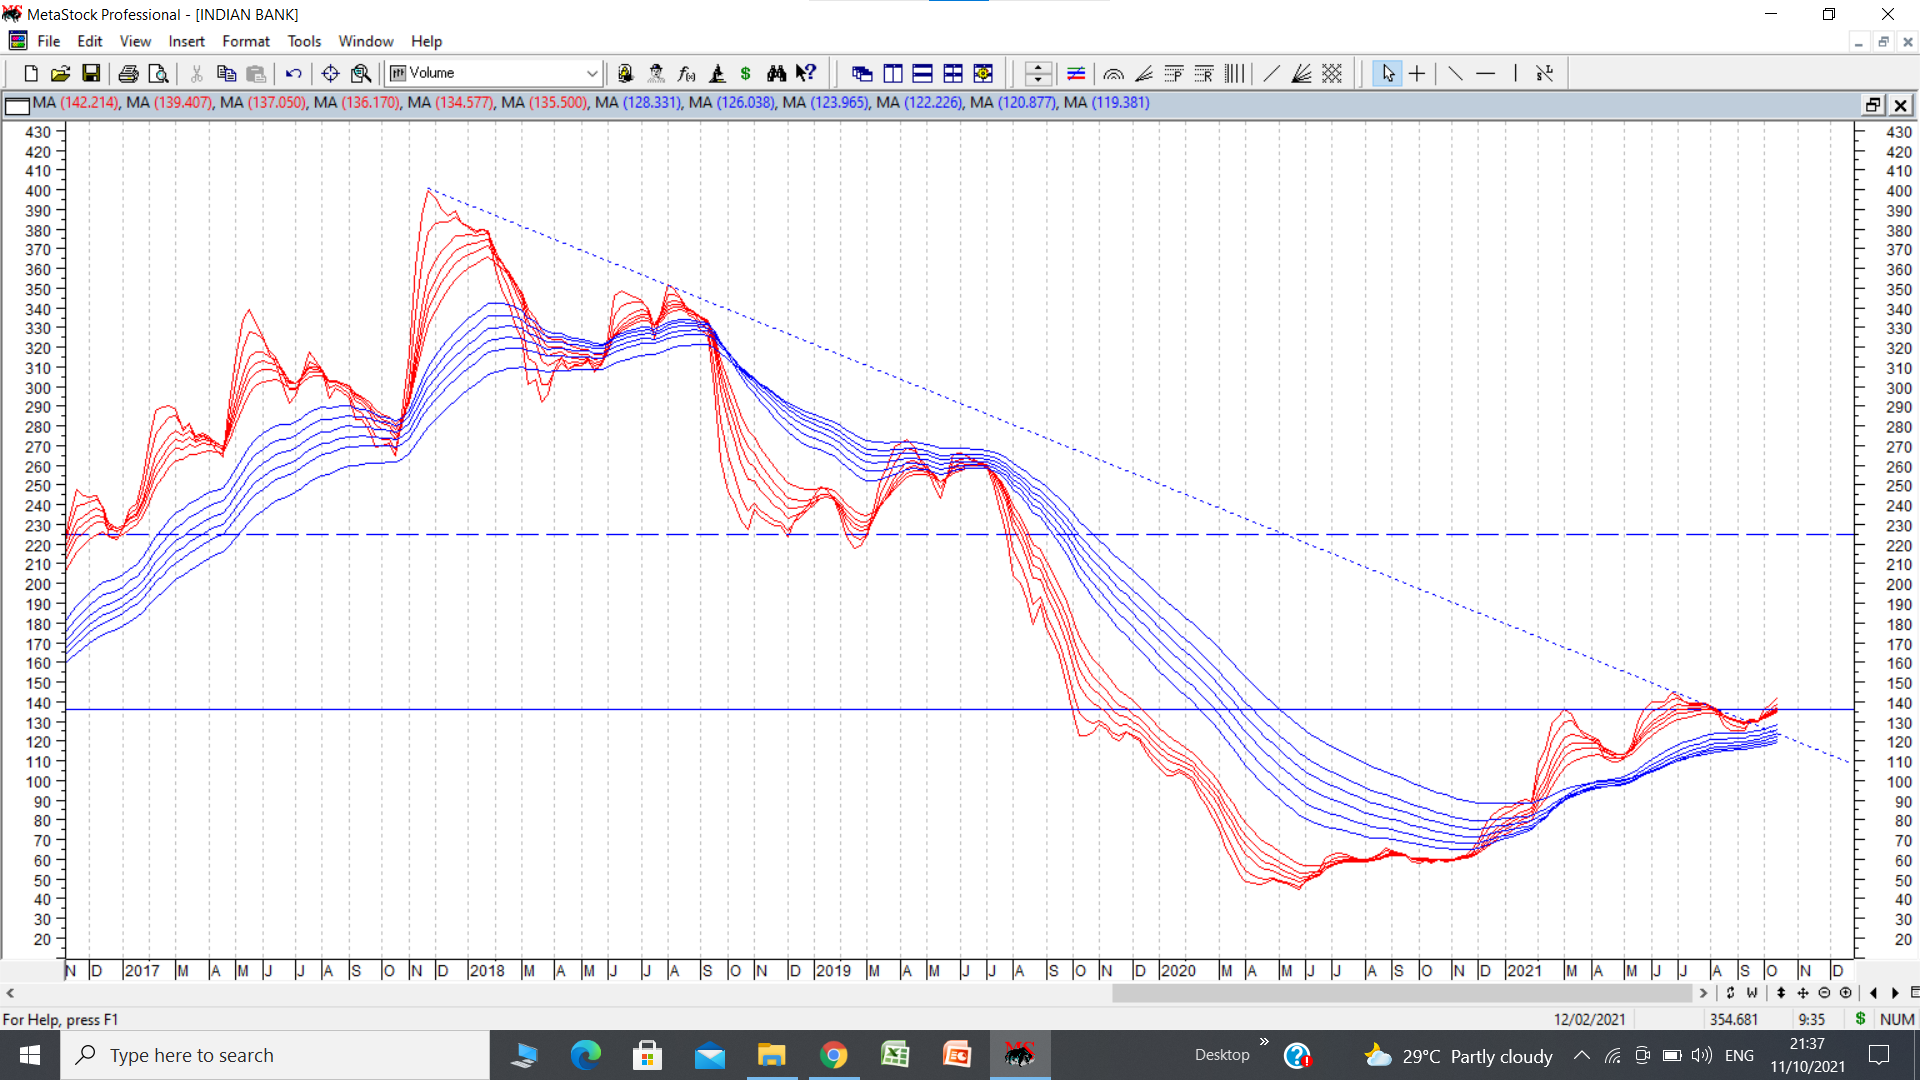
14 Likes
Union bank of India daily bar chart shows an interesting pattern. Stock price broke out of a double bottom pattern formed between 23 and 37. It went up and hit a swing high of 45 and then underwent correction. This correction took the form of a triangular consolidation (or a Wolfe Wave, which is drawn in the chart. Benefit of WW is it gives target line. ) This whole consolidation took place around the 200 dema marked in green. Today an attempt was made to breakout from this triangle. We need to see some follow through strength here to be conclusive. cmp 38. If pattern plays out, target both by WW and double bottom can be around 51. disc; invested.
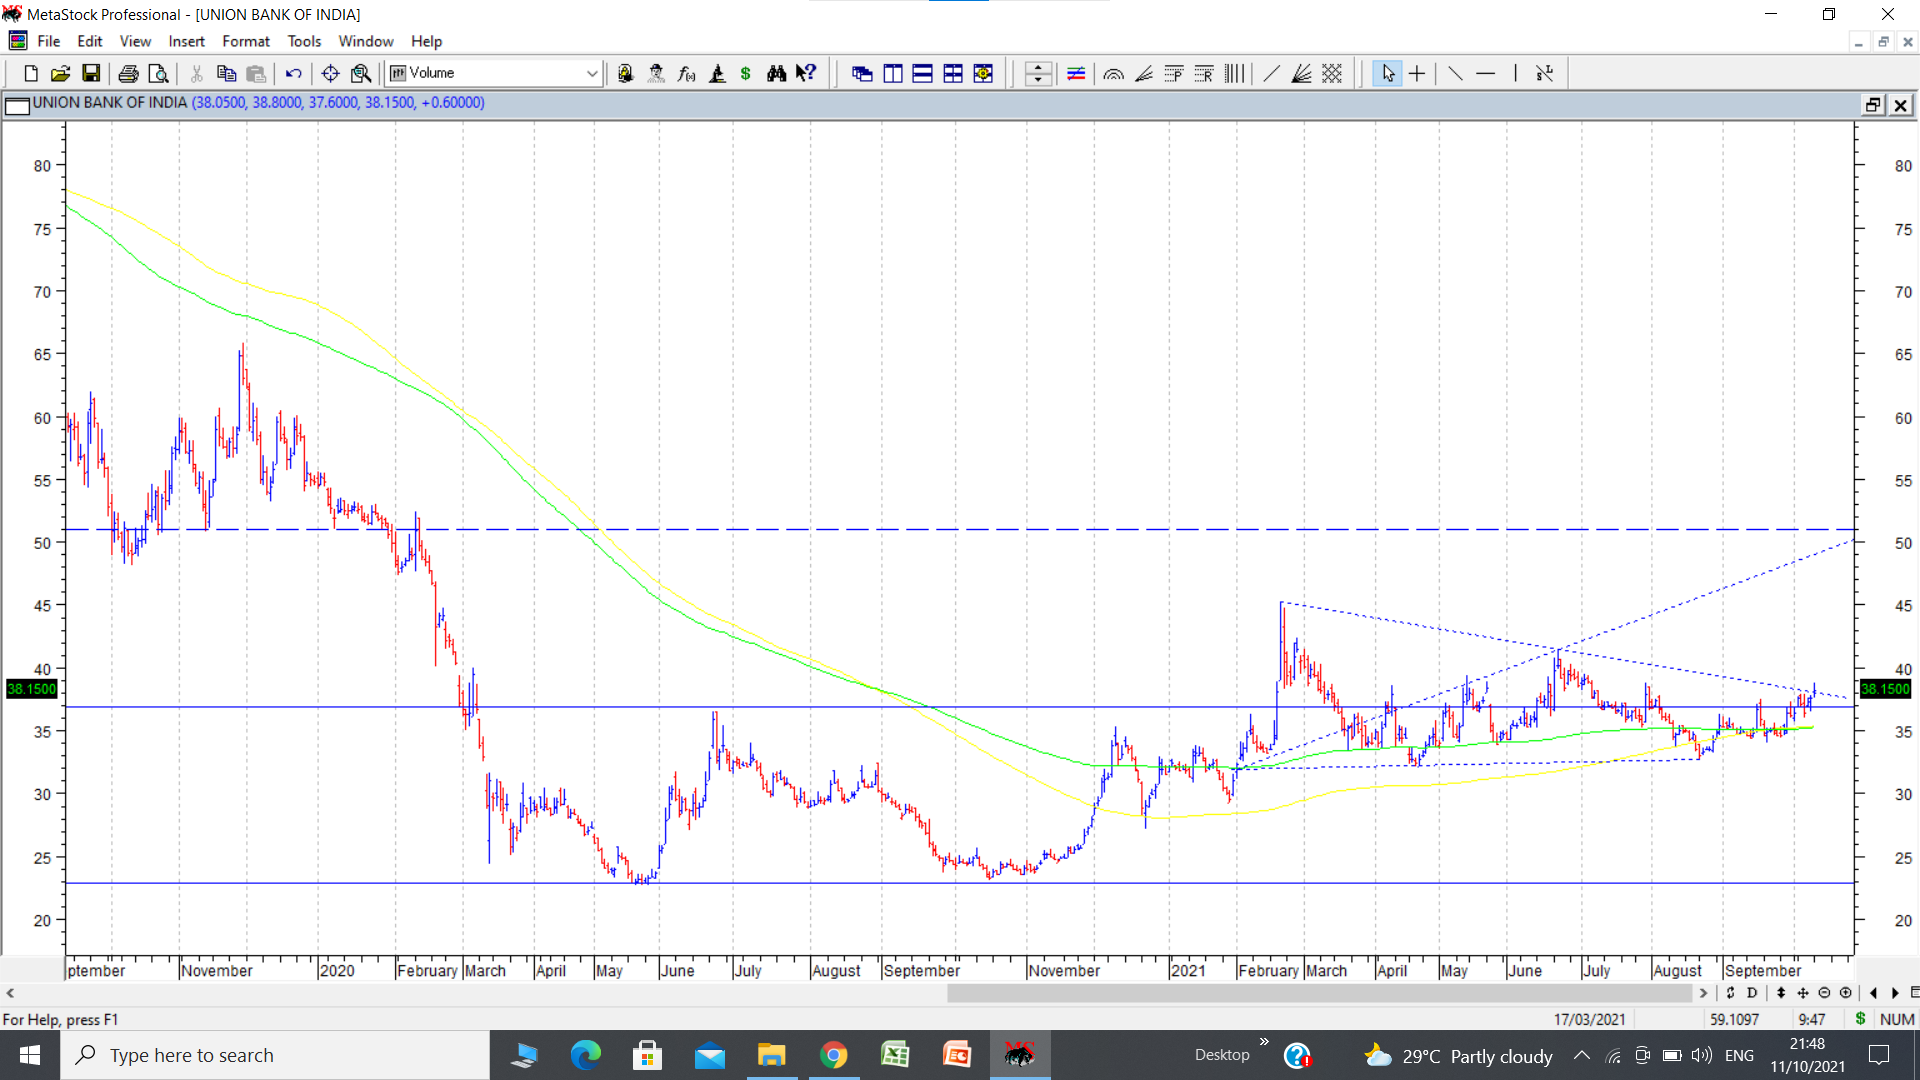
17 Likes
PRICOL Ltd is an auto ancillary company that is re inventing itself. All the details are available in company presentation and concalls. It manufactures TFT clusters and other dashboard stuff which is now almost a need for all new fancy cars. Plus it manufactures fuel pumps. Management commentary has been extremely bullish for medium to long term. On charts stock price has broken out of an inverted head and shoulders pattern. cmp 109. Targets can be 170-180. There is a nice rounding pattern which lends more credence to bullish stance. disc: invested as a techno funda bet.

22 Likes
KRBL broke out of a short term flag pattern yesterday on daily charts. Earlier on 12 Oct 2021, retest of breakout zone done by posting a low of 295. Flag pattern breakout if successful can provide target of 390-400.

14 Likes
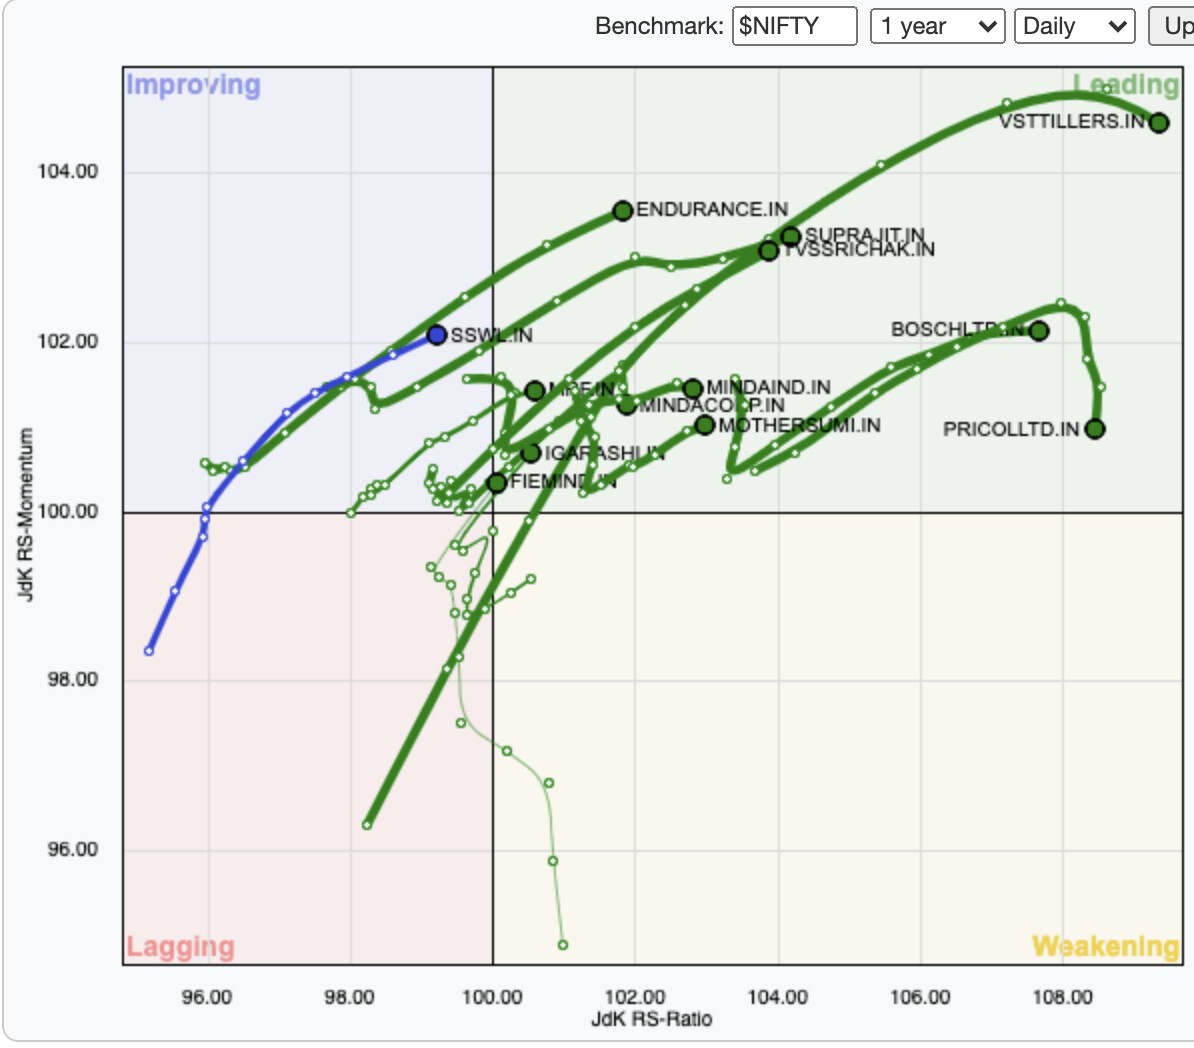
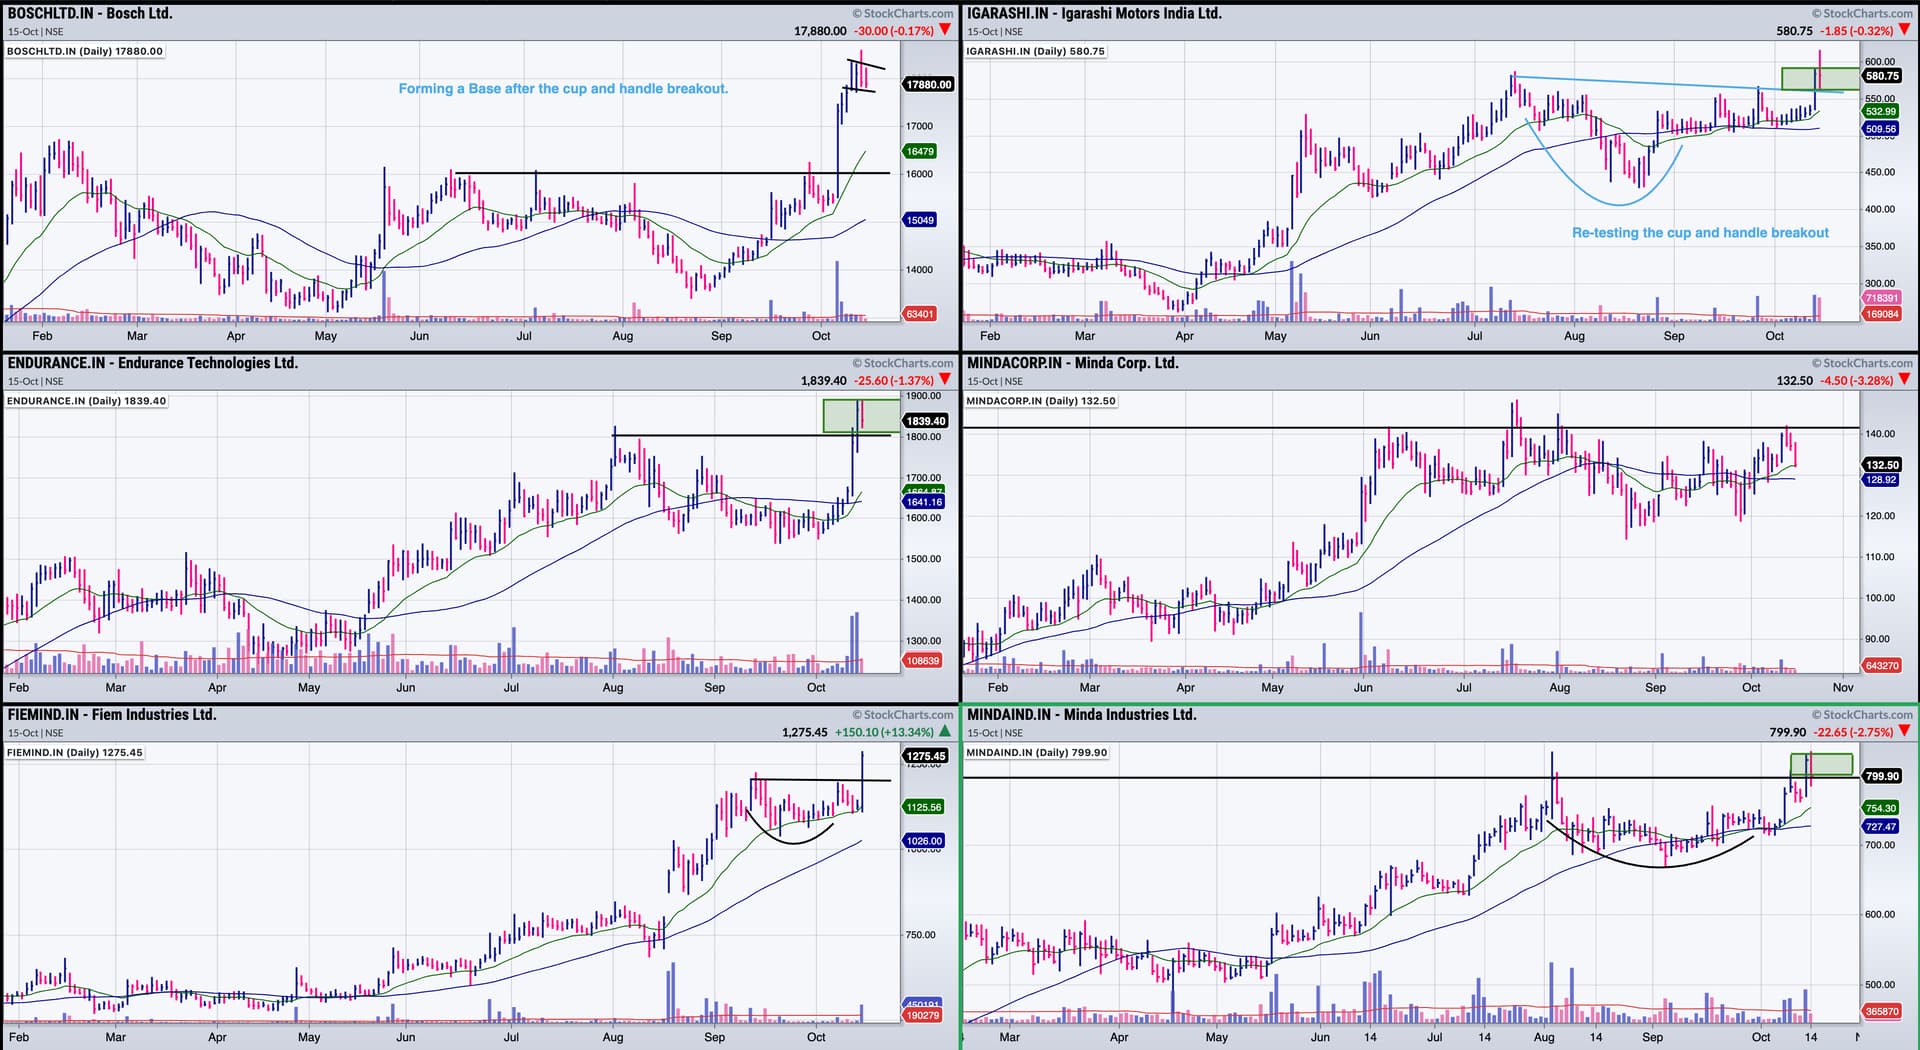
Auto ancillary sector is trying to breakout from the long consolidation,Many stocks are breaking out from the cup and handle/bottom reversal. Festival season may give boost to the sales.So I have added them to my watchlist.
In RPG charts(Relative strength) , sector is outperforming the Nifty and gaining momentum.
Adding below the charts which are self-explanatory.

Green means the stocks are outperforming the Nifty with good momentum.

26 Likes
Bhageria Inds is a company involved in manufacturing of dyes, dye intermediates and solar power. It is one of the top three manufacturers of H acid and Gamma acid in India and is backward integrated into sulphuric acid. It is a debt free company with net cash of 27 crores as on March 21. It has a solar business generating 30 MW solar power that generates annual 23 crores EBIDTA every year. It has incurred capex of 34 crores to manufacture J acid and Tobias acid ( import substitute products) . It also has enhanced power capacities to 8000 KW in existing facility at a capex of 15 crores. Company is also exploring a capex of 35 crores to manufacture new products - pigment intermediates . Total capex incurred and planned combined is 130 crores. Exports contributed 31% in q1 fy 22 revenues. Company has posted EPS in range of 14 -16 in past 3 years. Promoters stake is 70.91% .
Coming to its charts, the most interesting element here is the much faster retracement of the previous fall. Stock price started its prolonged fall from 215 in Oct 2016 and bottomed out at 65 in March 2020. This took around 43 months. Post this bottom, it rallied and crossed its all time high of 215 in June 2021, and this retracement to the earlier fall happened in 14 months, which is very fast retracement of previous fall and indicates strength of the trend. Since then it posted its fresh all time high of 297 in July 2021 and underwent a short term retracement and posted a swing low of 233 in August 21 and then rallied to cross swing high of 297 in Oct 21. It posted a new high of 329 and is currently at 290 levels.
Once all the capex kicks in company can deliver good performance. Recently the prices of dye intermediates have had a strong run up and Bhageria being backward integrated can deliver good results. Plus the capex should start contributing soon.
Technically it seems strong with a good chart structure. disc: invested as a techno funda bet.

22 Likes
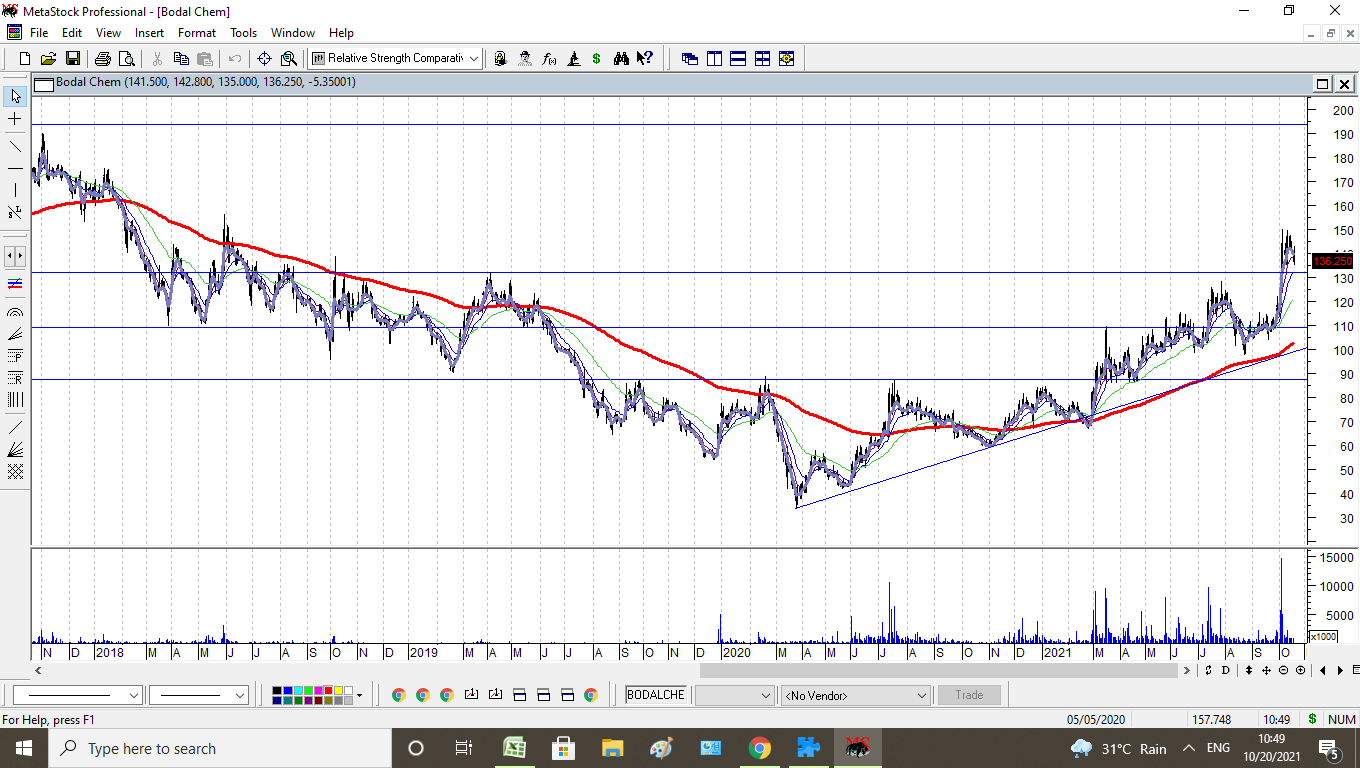
Sir
If dyes and dye intermediaries interest you, what will be your views on Bodal Chemicals
Breakout above 130 levels, immediate target in my humble opinion is 190
1 Like
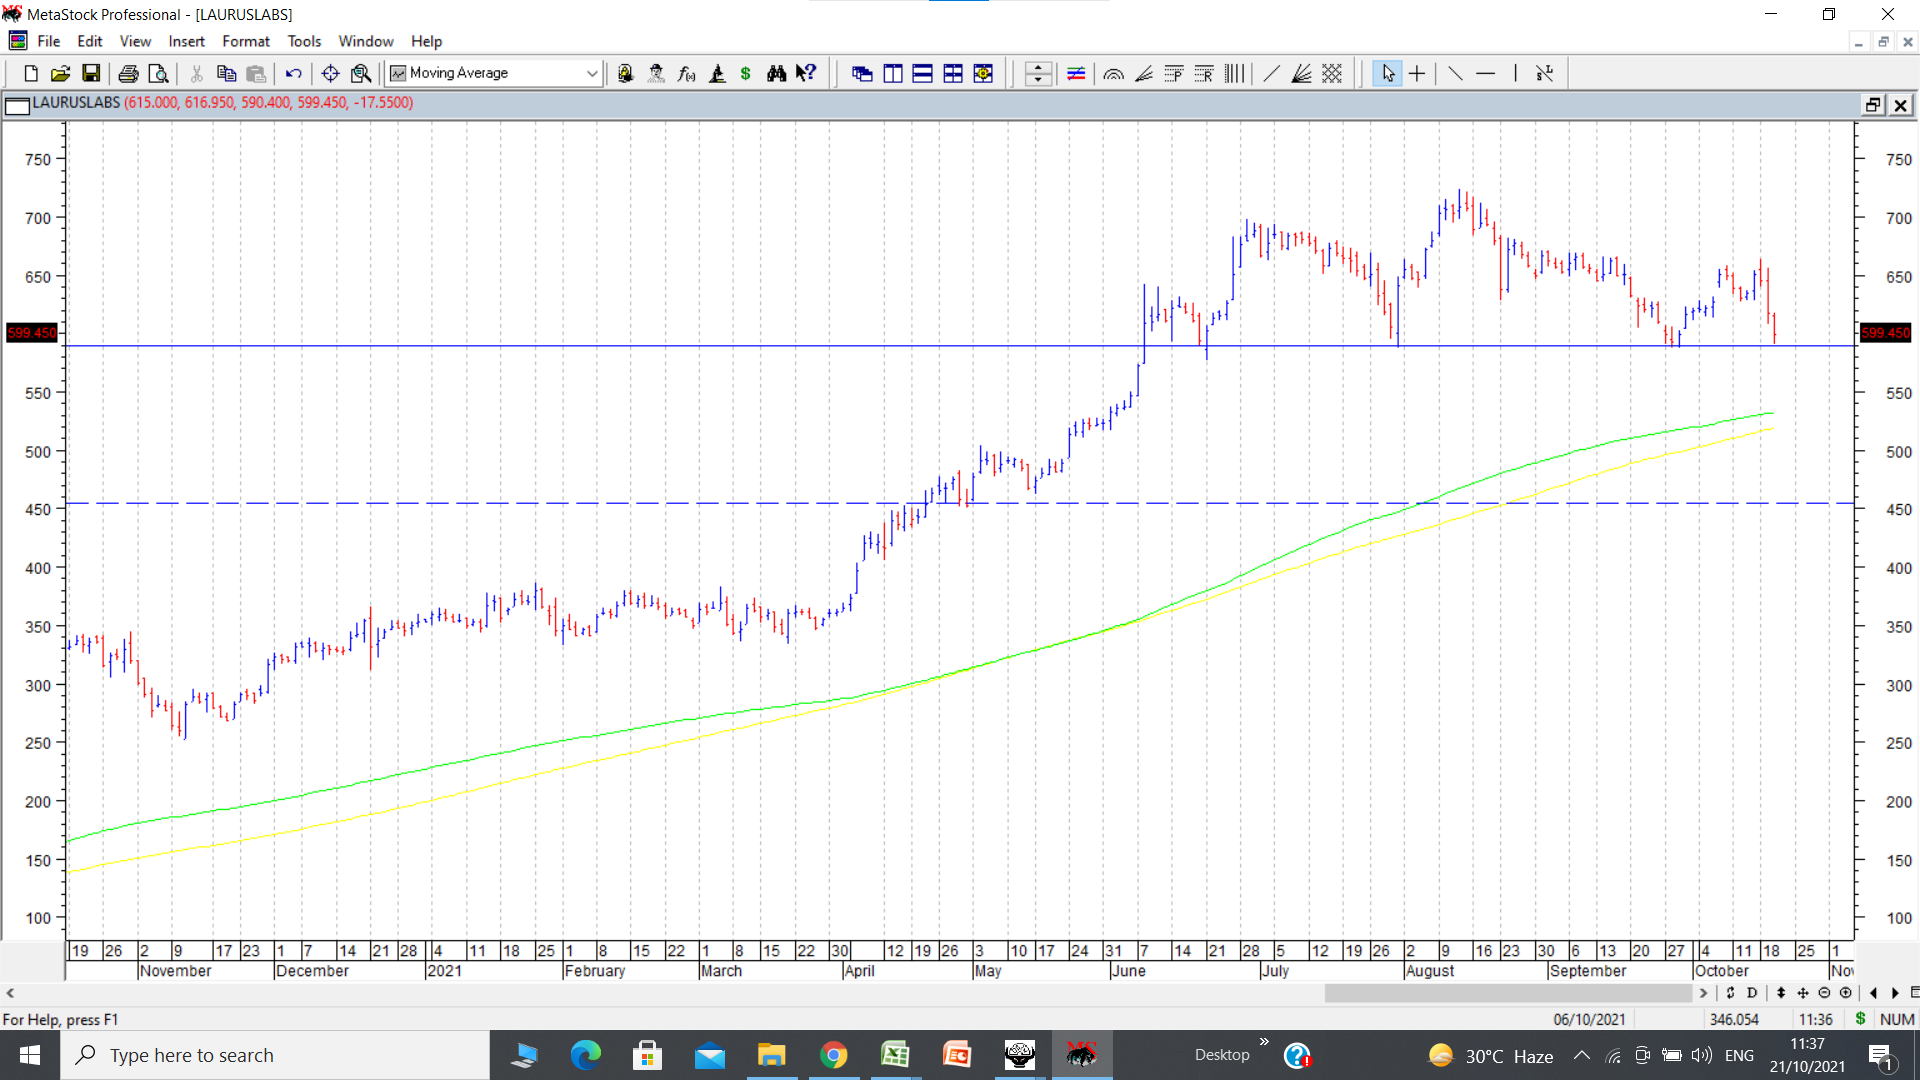
Laurus has formed a potential bearish head and shoulders pattern below 589. If it continues to stay below 589 and there is follow through selling, pattern can get confirmed. If pattern plays out, target can be 455-460. disc: no positions, sold few weeks back.
35 Likes
Pokarna has had a stellar run over past few weeks. This has been in expectations of very good times for the company in the light of new capacity addition and strong demand environment from US. The only fly in the ointment can be the logistics issues involved with very high freight costs and shortage of containers.
On charts, after strong run up, the stock formed a doji with a long tail yesterday. (this happening after a strong rally usually indicates a halt to the rally) Today it was follwed by a big bearish candlestick. This indicates a probable short term top and we need to see how things follow up. Besides above observations, there was strong negative divergence on weekly chart of pokarna. Crucial levels are 513 region which was the breakout region and 480-85 where trendline support comes in. disc: exited, no holding currently but it remains in watchlist.
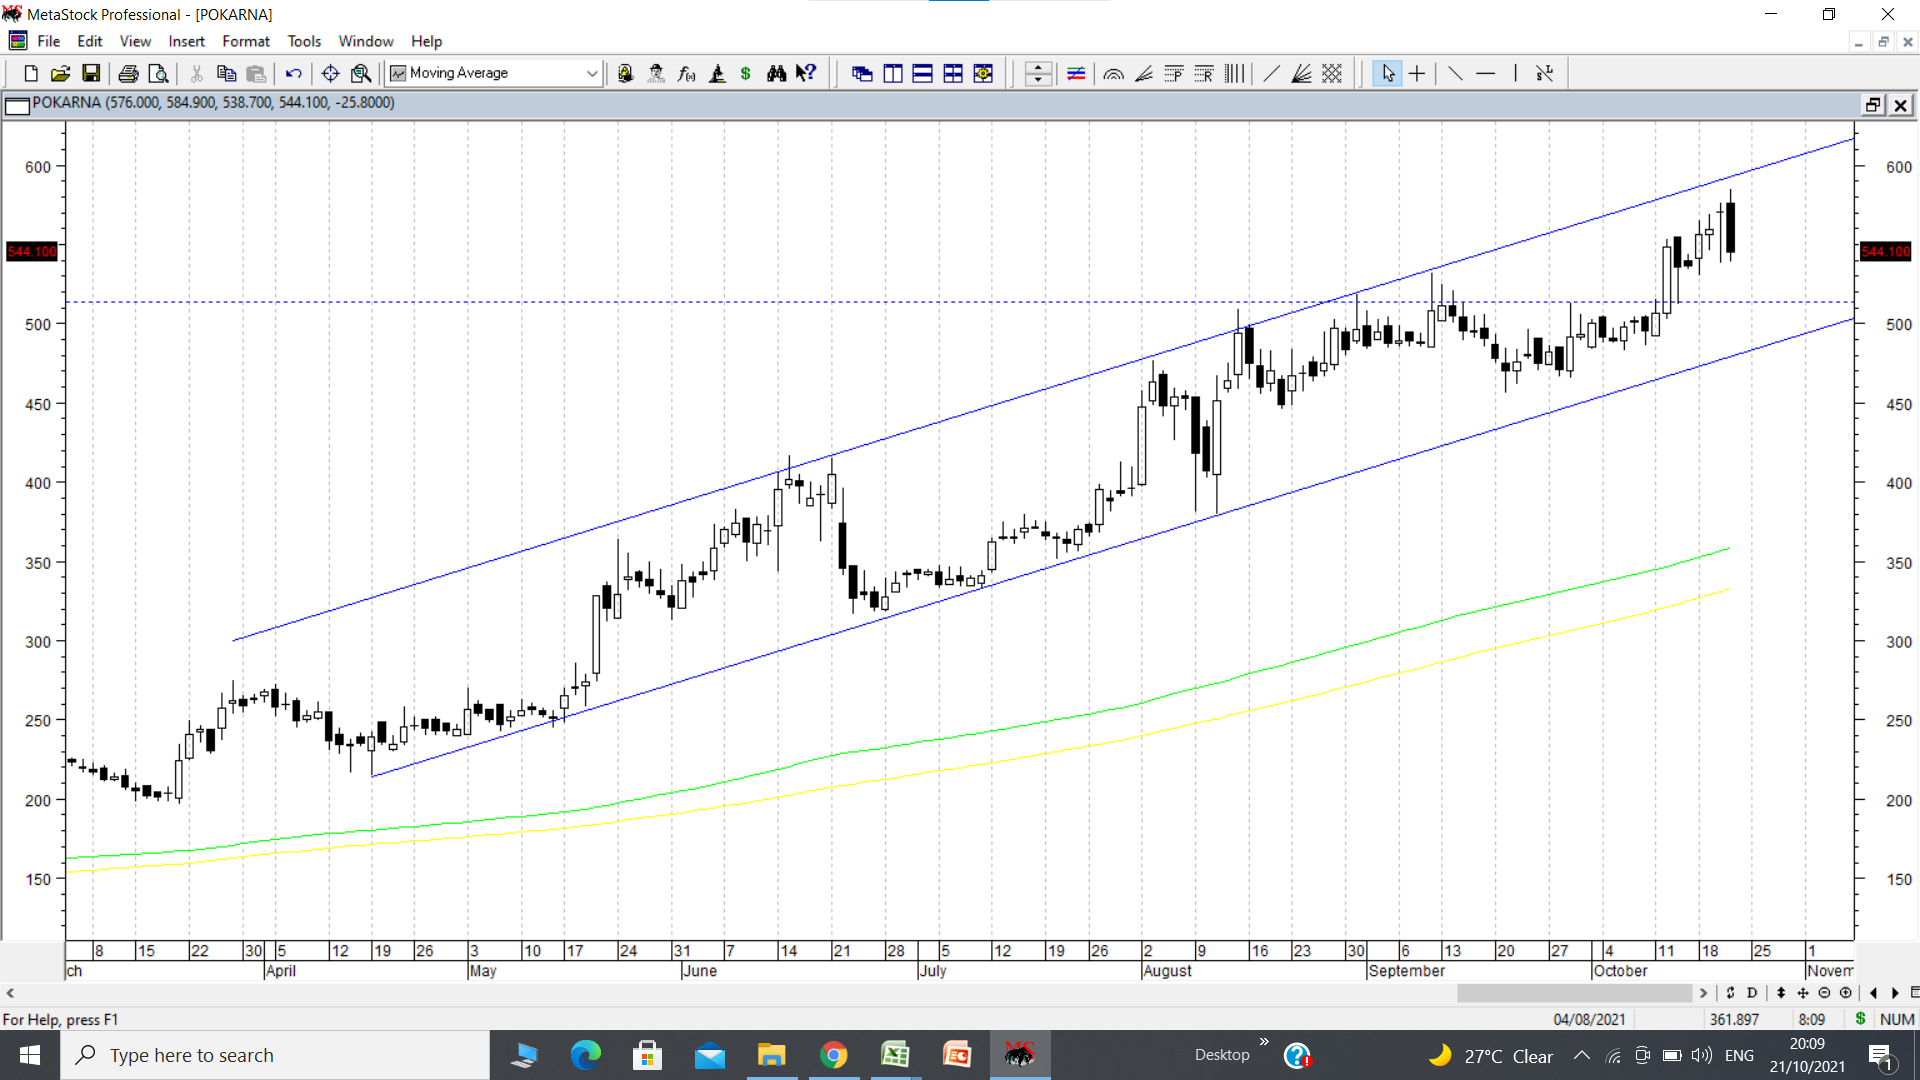
17 Likes
Neuland had broken down from a head and shoulders bearish pattern after it had a frothy run from 1000 to 2800. Since then it has struggled to show any form of rally and in fact has struggled to go convincingly above its 200 dema. In last few days it has formed a rectangular consolidation (shown in dotted lines ) which looks like a flag during a downmove. A breakdown below 1450-1500 can lead breakdown from the aforementioned flag and lead to further downsides. If however the stock price consolidates and moves above the boundaries of the flag, this pattern gets negated and upmove can resume to some extent. For that it will need to move beyond 1900 with volumes. disc: no positions. only for academic purpose to see how this plays out.

34 Likes
@hitesh2710 Appreciate you taking out time to post your insights, indeed very valuable.
If I’m not mistaken, Kotak Bank seems to have made a C&H pattern on weekly chart & has just about broken about. Views & especially counter views are most welcome.

6 Likes