52 week highs and all time highs strategy

I think KPIT is showing rounding bottom pattern and is near it’s 52week high.

1 Like

Axis Bank has also broken out of it’s multiyear high of 820-830. Yes the volumes are missing but if it sustains the current levels, we can see some nice gains in the short term. Even the RSI is above 60 showing good momentum and 20EMA is above 50EMA.

2 Likes

Refer Image for commentary:

3 Likes

REC Ltd has been a dog of a stock. Its a company owned by PFC, which in turn is owned by the Govt of India. The hallmark of this company has been the very high dividend yield since past many years, more particularly so in last three years. Dividend yield has consistently been above 7% and currently based on past year’s dividend track record is at close to 10% yield. Along with the Sep quarter results, company has declared an interim dividend of Rs 5 per share and the ex dividend date is 9 Nov 2022. cmp 104. Based on earnings of last 12 months its available at less than 3 PE.

Coming to historical PE of the company, barring 2019, where it reached PE of 7, it has always remained at very low valuations. Last 3 years numbers have been consistently good, considering the valuations.

The scenario with current market is about slight change in perception towards govt companies. A lot of PSU banks have rallied hard, defence sector PSU companies have done well, and some others like BHEL seem to be showing promise in terms of price strength. In short, PSU companies seem to be enjoying market fancy albeit in varying degrees based on sectors and individual company.

Companies like REC and PFC have been long ignored if one looks at valuations and dividend yield. Its difficult to figure out what could change in terms of business prospects, but some change in market perception towards these kind of ultra cheap names could provide decent returns with limited downside.

Putting up chart of REC. Stock price on weekly chart shows a rally from Covid lows of 60 to high of 126 in late 2021. In fact level of 126 has been a strong resistance since 2018.

After the swing high of 126, stock price went down and took support close to 61.8% (at 91) retracement level of previous rally from 60 to 126. On short term daily chart it formed a double bottom at 91 and confirmed the pattern by breaking out above 96. Another major double bottom breakout can happen if stock price crosses 109-110, with range of double bottom being from 91 to 109 and if this pattern plays out by breaking above 110, target can be closer to 130, which takes it above strong resistance of 126. Falling channel marked between solid red lines shows last leg of fall and since then level of 91 and 95 (in dotted green lines) shows a double bottom in short term chart. It also shows a higher bottom at 91 as compared to previous bottoms at 60 and 68. The structure in weekly chart shows a higher bottom, higher top pattern till now and a break above 126 would signify a significant change in trend.

In the immediate near term, stock will go ex dividend by 5 Rs and we need to see how stock price reacts on going ex dividend.

disc: token position based on chart structure. A break above 126 if and when it happens could be a time to seriously consider higher allocation.

23 Likes

NHPC had been covered previously on this thread as a stock which broke out above previous major resistance at 37 and then all time high at 42. Stock price hit a fresh all time high of close to 47 and reacted and went down to retest previous major resistance at 41-42. On daily charts it has formed a morning star pattern on candlesticks if one sees the last 3 daily candlesticks. disc: invested as disclosed before.

14 Likes

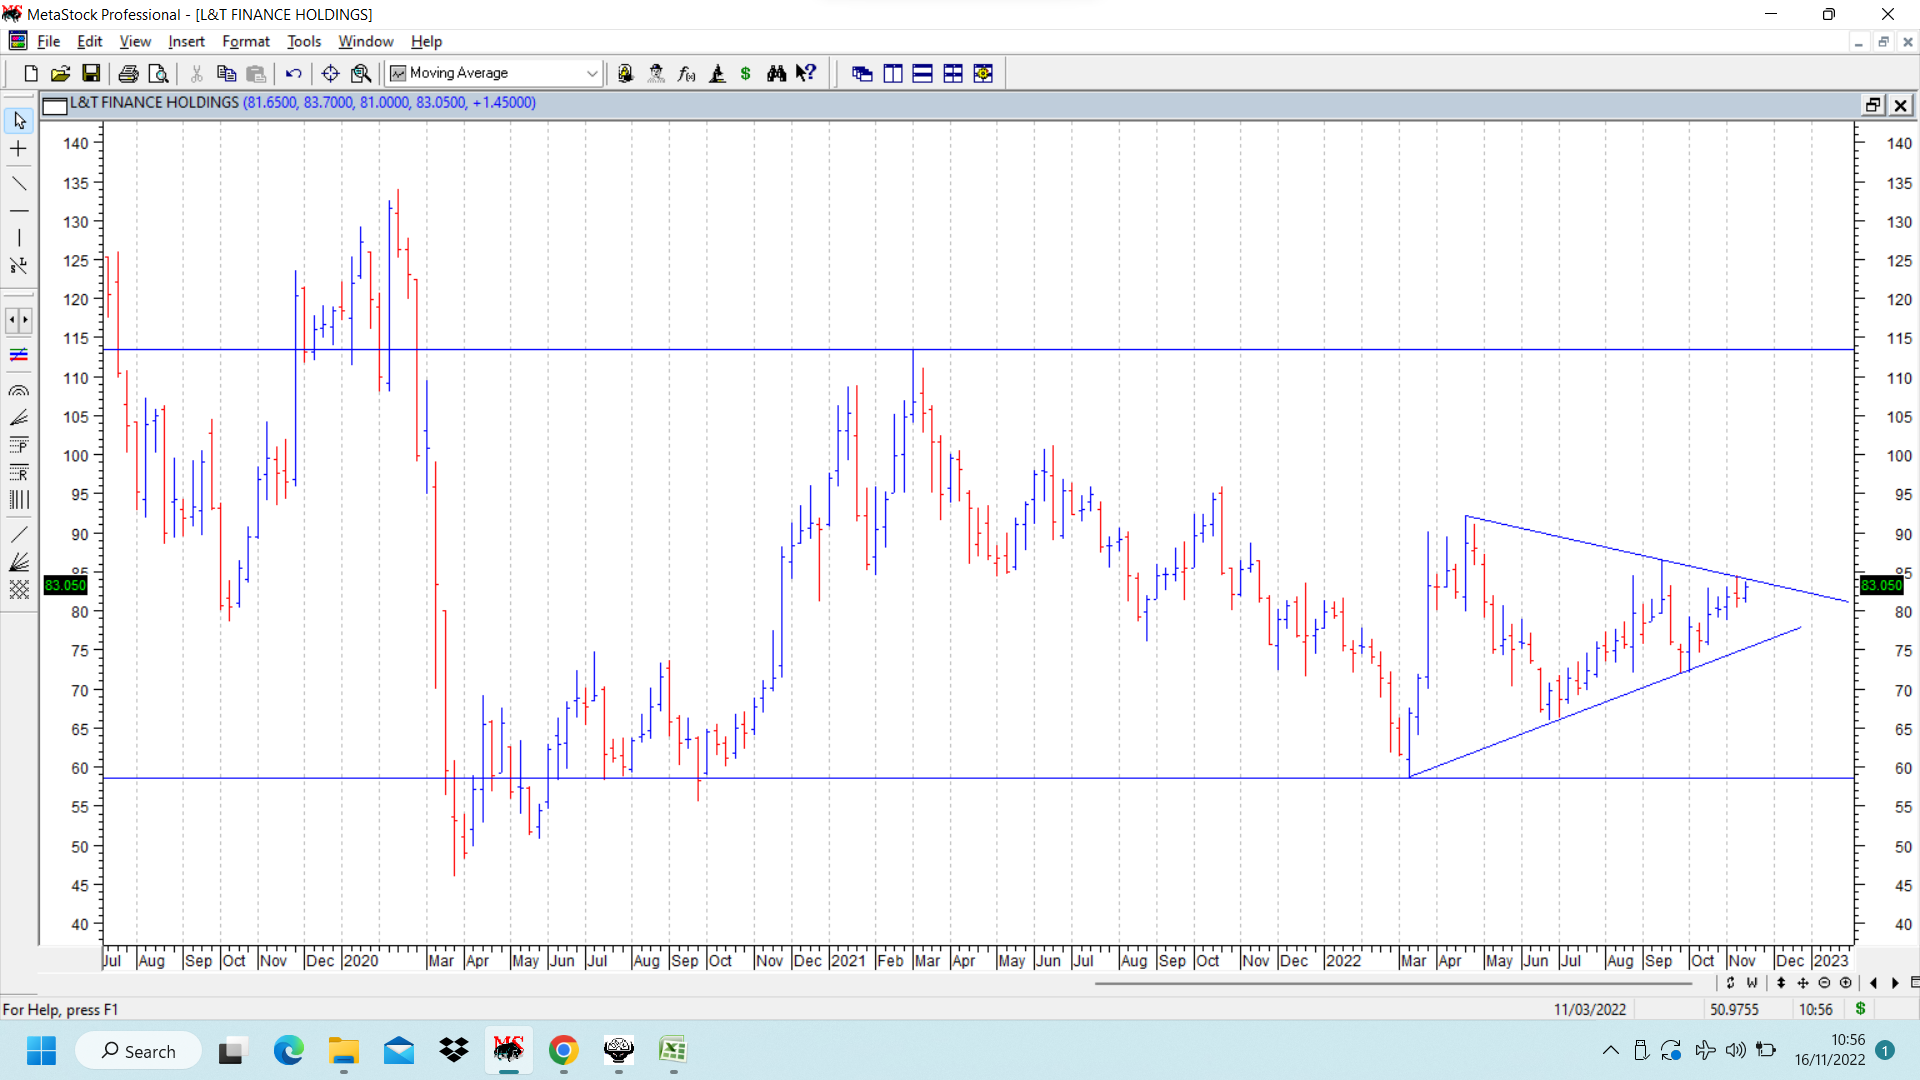
L&T finance holding chart put up below. It has formed a double bottom at 58-59. Confirmation of the double bottom breakout would happen on break out above 113. CMP 83. If that breakout happens in the future, target can be 167. At present consolidating within a symmetrical triangle as marked on chart. A breakout from that will happen on breakout and close above 84-85.

Fundamentally it has posted decent results for q2 FY 23, and management has articulated its Vision (Lakshya 26 ) 2026, wherein they aim for retail loan book of 80%, and class leading ROA and asset quality. As of now they seem to be making progress on that path. Currently available at close to book value. If going ahead, they can start going closer towards their stated targets for 2026, this can be rerated from 1 times book to higher multples.

Another important event in q3 fy 23 would be receiving the funds from divestment of MF business to the tune of 425 million USD and in a rising interest rate scenario would be good for the company.

disc; invested based on techno funda picture. (not a buy/sell recommendation. )

19 Likes

IIFL Finance chart attached below. It has recently broken out above the trend line and is currently trading at its 52 week high (CMP~462Rs.) 520 is the next resistance. If it touches 520, then comes down to retest the upper trend line and then breaks out above 520, next target can be 750.

Fundamentally, its numbers have been improving since last few quarters. GNPA 2.42%, ROE 20, ROA 2.74%, with revenue and profits at all time high. Current P/B = 2.1 with median P/B = 1.7.
Fundamental risk - Margins are at all time peak, how much higher they can go remains to see.

Different views are welcome!

4 Likes

Hi, the chart in tradingview.com doesn’t match with yours. Currently IIFL finance is making all time high not 52 week high.

1 Like

There was a demerger. Yours is correct

Disc: invested and biased

1 Like

Sharda crop chart was earlier discussed because of its bearish head and shoulders breakdown (marked in dotted navy blue lines at 550-560) . Since then it has had a sharp fall and now come to crucial support levels 370-380, which was previously a major resistance in 3 instances as shown on the attached daily chart. The fall seems to be arrested as of now, and stock price is trying to consolidate in a triangular pattern. If and when it breaks out of the consolidation, above 395-400, it can provide a tradeable bounce. The resistances on the way up (if a counter trend bounce does come about) are marked on chart by putting up Fibonacci retracement levels of the fall (shown in dotted sky blue). disc: under watchlist. No positions.

10 Likes

Neuland chart was covered on Oct 1 2022 and above observations were quoted. Since then stock price managed to cross the crucial resistance of 1470 (after some brief consolidation around that level ) and it gave a sharp rally to post swing high of 2002. Major resistance was seen at levels of 1860 where previously there was strong resistance. Currently stock price is undergoing consolidation and we need to see how it behaves post this consolidation. Its important to keep watching daily charts to see any signs of a major trend change on daily time frame. On weekly its already in an uptrend and is consolidating.

Shown in attached chart is support zone (in dotted green lines) mentioned in previous post which was in region of 970-1300 and that did provide support for consolidation. And upper boundary of consolidation is marked in solid navy blue line at 1470. Above that, major resistance is shown in dotted red line at 1860. Till now everything has played out according to technicals.

For me it was a way to look at how to play for bounces in stocks which have corrected sharply. These bounces may be dead cat counter trend bounces, or the real deal meaning, a major trend change. Key learning here was not to waste time by getting in at or near bottom and face the frustrating time of consolidation. Ideal time is to get in at the time of breakout from consolidation ranges… Most important factor to watch is the volumes at the time of breakout. This kind of learnings will provide an important weapon in the arsenal of technical analysis because everyone nowadays is going in for breakouts, so playing pullbacks could be the less crowded trade.

15 Likes


It is not a stock as such but the whole Bank nifty. One can see how Banking Stocks are at ATHs. Following are the charts of the same. Some are near their highs, while some are creating new highs every week.

AXIS BANK
It broke out of a the channel and is now retesting the previous level. One can see the bounceback from 20EMA which confirms sustenance.

HDFC BANK
After the news of merger, it made a temporary high but got sold into really quickly. Now it has gained back the momentum. It may take a while to cross the upper resistance but eventually it will ride the 50EMA to new highs.

KOTAK BANK
Same is the case with Kotak. It has been consolidating for long. It broke out last year but did not sustain since volumes were very low. A breakout with decent volumes can sustain the breakout.

SBI BANK
Don’t know how long will the rally continue in Public Banks. This stock has already risen a lot so mentioning it only for reference purposes.

Did not mention ICICI because it has already run up a lot and will obviously gain if Bank nifty moves higher.

2 Likes

NCC daily chart shows a breakout from a cup and handle (slightly unusual shape) above 76 and then consolidating in a triangular pattern with shrinking volumes. Today it has attempted a breakout from this short term consolidation with much higher volumes as compared to past few days… If pattern plays out, target can be 96-97 (shown in dotted blue horizontal line) . Important to note that on the left side of chart, between two horizontal dotted red lines, there was prolonged consolidation before the stock fell down. This region of 70-86 should be watched out for resistance. disc: invested as a trading bet.

9 Likes

Redington India - Daily
Today, Redington breached it’s all time high to record a new high with decent volumes. However, it closed with a long upper wick (with length of wick more than thrice of that of the body) forming a shooting star pattern. It is an indicator of uptrend reversal.
Confirmation - Next candle’s high should be below the high of shooting start and also it should close below the close of shooting star. Then the trend reversal could be possible.
Fundamentals - Redington recorded their highest ever revenue last quarter. They have been recording higher revenues every single year. With increasing contribution from high margin segments (cloud & services) it is well poised for a strong growth. Also, third quarter has been traditionally their best quarter. Should the price sustain above 172 levels until the third quarter results, results could be a great trigger for a nice breakout above ATH.

5 Likes

@Garuna

The 52 week high strategy is mainly for those wanting to invest for the medium to long term. For those who want to invest for short term, the lower time frame charts like 3,6 months chart also will do well. It doesn’t matter how much time period you are considering. Basic idea is that the stock has to cross a crucial set of resistances on the way up. These have in the past been supply zones for the stock’s upward journey and once these are cleared the further road ahead till the next road block is usually easy.

The whole idea of this thread is to grasp the idea of strong breakouts. One can modify investment styles based on this basic premise.

10 Likes

BHEL chart was discussed in Sep 2022 under the above post. Since then stock price has shown good move from levels of 60 to currently above 80. Now once the major resistance of 80 (4 year high) is cleared, there could be some consolidation in price. The previous resistance zone of 77-80 should be watched for support on declines and then on signs of reversal from consolidation, one can consider buying.

In the attached chart the previous resistance zone is marked by two horizontal blue lines.

11 Likes


This is the chart of Larsen and Toubro. Last year it made a high above 2000 but couldn’t sustain it and corrected. Now it has formed a Inverse Head-n-Shoulder pattern and is comfortably trading over the 2000 level. according to the charts the target price should be 2500 for next 1 year but being conservative one can expect 2200 levels shortly. It is currently trading at 2060 levels. Considering the upcoming budget and healthy tax collections run rate going forward, we can see increased capital spending by the government, which has always been positive for LnT. Also their Middle East business looks very promising.

4 Likes

Techno electric has made a new 52 week high today. Fundamentally, the company has robust balance sheet with 1250cr cash balance (m. Cap 3500 cr).

As per mgmt commentary Q3 would be better in terms of revenue and margins and Q4 would have substantial topline growth.

Company is venturing into data center business to deploy it’s cash generated from EPC business.

Disc. Invested since sep 22 at around 275 levels

3 Likes

In early September I had done some analysis on REC and PFC and had taken positions. Sharing observations, I had then.
PFC Div Yield and Price Co-relation. Div Yield highlighted in blue and stock price in black.


Whenever PFC’s dividend yield has crossed 7%, the stock has given at least a 2 bagger return in around 1 year. There is a small but gradual increase in FII holdings too.

There is a similar trend in REC too and this pattern keeps getting repeated every few years.
The above pattern can also be co-related on technical charts.

8 Likes

There was a flag pattern BO too on NCC weekly charts. Potential retest of that and Cup and Handle today.
Flag pattern targets too in range of 96-97.
Strangely Tradingview shows data only from 2011 and not before. But if one looks at long term charts from around 2003 then the trendline drawn from 2007-2008 top comes at around 97. Weekly/monthly close above 97 can potentially signal a major trend change.
Negative news of IT raids today, if selling gets absorbed and stock moves up then would be a good sign.
Has always deceived this one. Hoping it’s different this time :slight_smile:

1 Like