Whatever be our method of identifying stocks with potential to generate future returns, I feel that this is a great way to find stocks to work on, even if technical analysis is not ones core competence.
As investors, we are forever looking for ideas to work on. Hitesh, is it okay to discuss stocks that are work in progress on this thread? I don’t think currently we have a thread on Valuepickr where one could discuss half baked ideas. Besides, as many small caps don’t have volumes, it becomes hard to apply technical analysis.
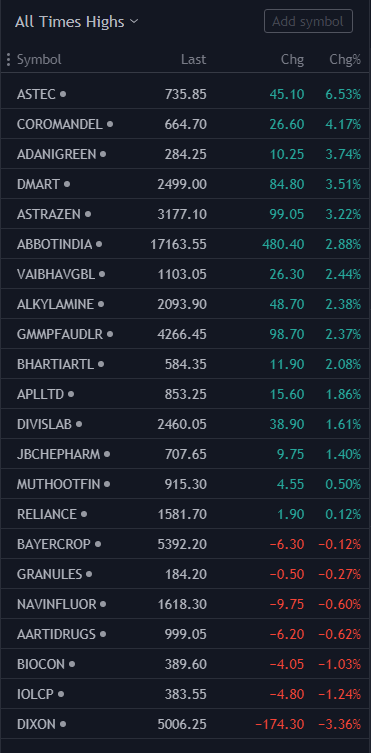
I am a momentum cum growth investor who is always in search of new trends. I keenly look at new all-time high candidates and their behavior with respect to it’s earning growth and general perception of that sector or stock.
This list is a good way to begin further research.
Hi Hitesh bhai,
Could you pls elaborate on the above as am confused how to differentiate between multibaggers and compounders in case both are making 52 week high ?
We are interested in stocks that take out 2,3, 5, 10 years highs and not 2,3,5 month highs. Because stocks that are strong and in an uptrend are going to keep posting consistently higher highs.
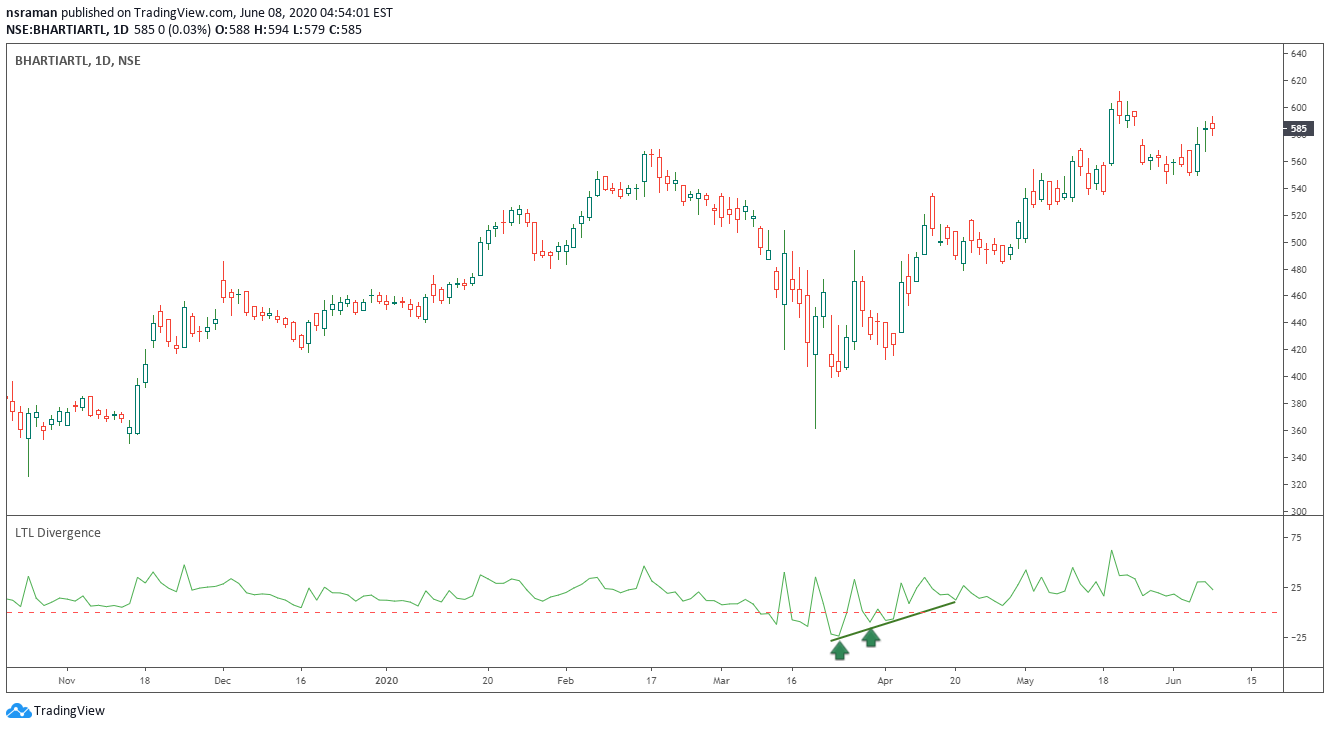
Here one has to understand the psychology of the price action. Why would a stock like Bharti take out an 11 year old high posted back in 2008 now amidst all this general uncertainty? And Bharti is a heavily traded counter and its difficult to manipulate its prices. So obviously majority of market participants see a distinct set of positives for the company to take the stock price to all time highs. And all this while Bharti stock price has been making a base by consolidating between a broad range of 250-450 (plus or minus a few rupees) throughout these 11 years. So this kind of jump above the range and then posting all time highs has a definite meaning. But that does not mean we have to go out and buy tomorrow. Because we know a thing or two about fundamental analysis, we will don that hat and try to find out the triggers lined up. Most of them are apparent to us. (dont ask me which ones )
Thank you for starting this great thread @hitesh2710. I am learning ‘how to invest’ from last 3 years and after understanding multiple investment strategies, i found this 52 week high strategy suits my behavior as safest approach. Here is what I do to filter stocks -
Fundamentals should be good (like debt to equity <1, no pledge, ROE ROCE 15-20% etc)
Monthly trend should be up
Weekly trend should be up
Daily should be up and near its 52 week high.
As you rightly pointed out in your post -RETRACEMNT or TREND REVERSAL - I am still learning on how we can confirm whether it is a retracement from 52 week or a trend reversal. This thread really helps me in learning this.
Appreciate your expert views on this.
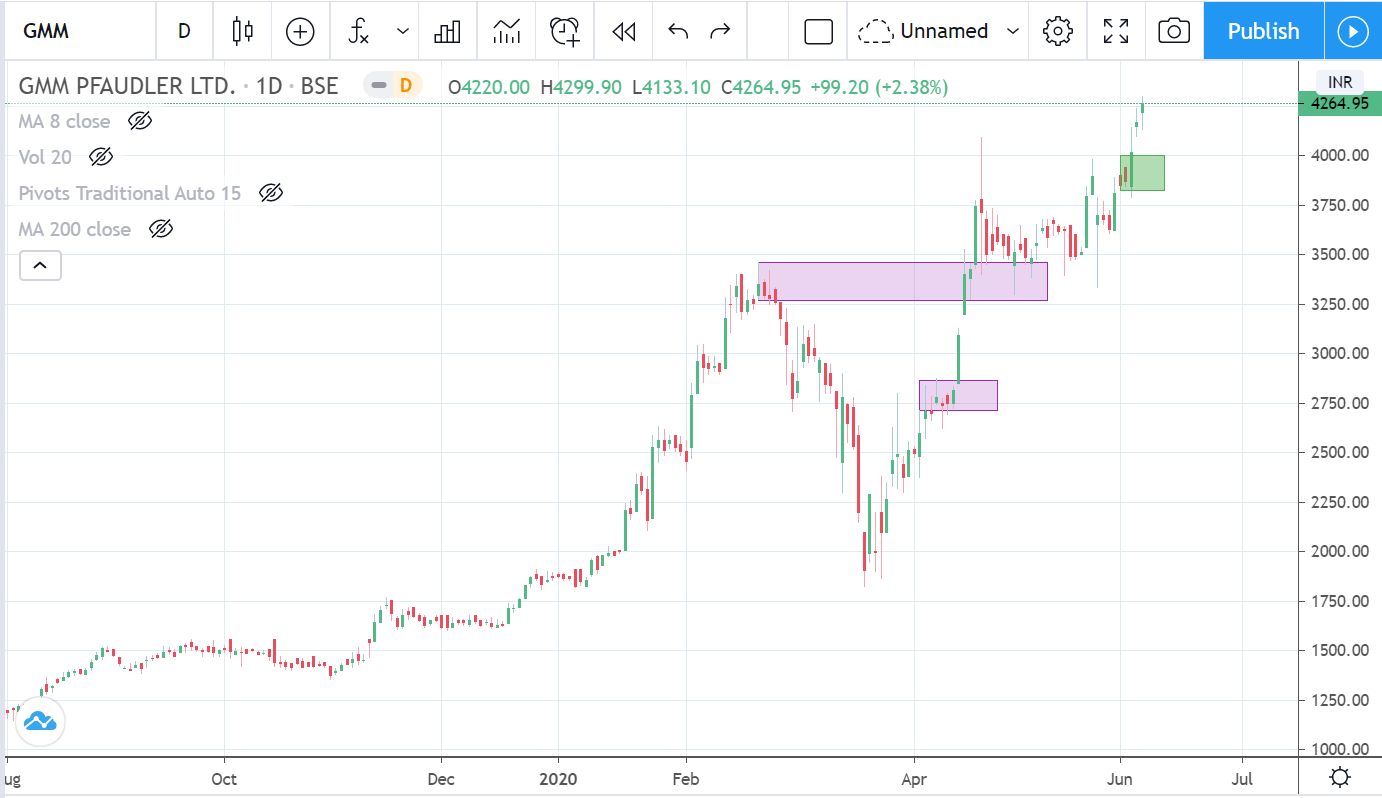
I was closely following GMM P that is falling into this category.
We can put up analysis on work in progress companies also. But we dont want to litter the thread with other types of patterns which will dilute the key message of this thread.
For other types of technical patterns, there are other threads like bull therapy etc.
Even in stocks that have corrected a lot, there will be sideways movement for a long period of time and then suddenly that stock will make a move to post a 3 month, 6 mnth, 9 month or 12 month high and that’s when we want to sit up and take notice. Again not to jump right in but try to figure out what’s changing in the company and whether the recent strength shown is sustained or not.
Buying stocks at all time highs / 52w highs requires a mindset change because of price anchoring. If you have recently purchased a stock and it is up by lets say 25% or even more - its tempermentally difficult to buy more and there is a tendency to wait for a correction peventing one from building a large position.
If one can somehow not be very sensitive to price anchoring, then thats a step in the right direction.
In my view, the main component of a succesfull 52w plan is not the high itself but identifying a base formation. Identifying the base formation correctly and counting bases are critical to successfully execute this plan. Maybe @hitesh2710 bhai can guide on some of the nuances of identifying a good base using his vast experience. There are ofc many books available around this but some pro tips always help
Hi Hitesh Bhai,
My approach is a different one. I follow my monthly chart for Divergence for already established names in the particular sector like Bharati Divis IPCA,etc. These might have a temp set back for various reasons but the underlying theme is strong and there is no deterioration in fundamentals ( may be temp here also). I follow 52 wk high for new names like Astral, PII ( but these are established now) and wait for a dip not more than 20% to enter. Power India, Escorts,Rallis,
Please Note: This thread has been categorised under the Technical Practitioners Corner - a Moderated Category. Please have a look. Might be useful to keep updated on such new initiatives at VP. If you can draw attention of senior practitioners (you may know) to this initiative, please help.
This thread in particular is very important to keep the focus on the Strategy deliverable - Shortlist of Actionable ideas - help us prioritise (deep-diving) fundamental analysis, as needed. Though each of us is free to use the outputs as it resonates with us individually - there is a bigger VP imperative behind - to influence/push collective conscious effort.
Please be conscious of the above goals while posting/replying - how does my post/reply add value? does my post help take forward the discussion? And please be patient - all posts and replies in this thread will require Moderator approval, hereon.
I did a basic test of the 52-week breakout strategy. Here are the results.
Duration - 2007 till date
Universe - Nifty 500
Frequency - Quarterly reset
Max Drawdown - 38%
CAGR = 27.23%
Strategy = But top 10 based on momentum filter
Basically, if you buy the top 10 stocks amongst those which are hitting 52-week highs and hold it for 3 months, you get a very good return. If you can overlay it with an index filter and a stop loss mechanism, it could actually give pretty decent results without much hassles.
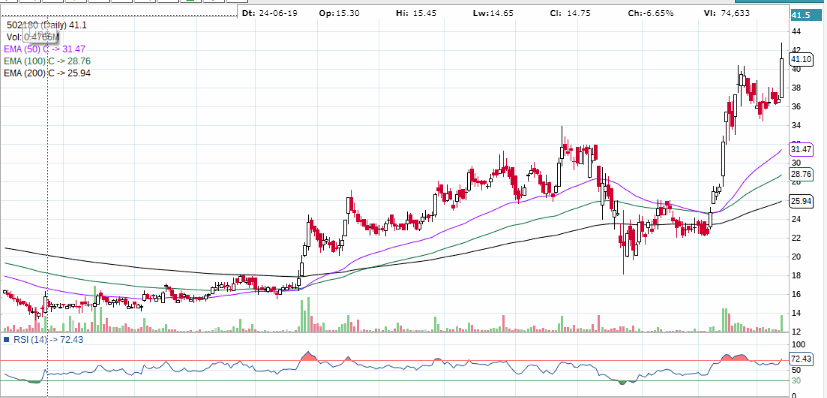
One of the best charts from the cement sector is of Shree DigVijay Cement. For years due to miss management or whatever, the price of the stock had gone nowhere. But after change of hands, it has managed to clear its long term trend line.
My doubt is that how do you know when the stOck which is making highs everyday is in good position or now turned into bad position
I am invested in gmm and it is making new highs everyday.
Fundamentally it is a very strong company but is this coming into a risky territory or its just the beginning.
How can we analyse that ?
Hi Hitesh bhai,
Should stocks making all time high be given more weightage compared to those making 52 week high under this strategy ? How do the two rank in preference ? Many thanks
Previous all time high of divgijay cem was 46.8 and the recent high missed it by 10 paise. As you say, flag target is close to 54-55. So I think there might be some consolidation/base formation and then it can take off. Difficult to predict the exact trajectory.
Interesting question. The obvious logic is that stocks crossing all time highs are to be preferred over those crossing 52 week highs.
e.g Stocks like alembic, which have crossed previous all time high of 792 would have a free zone on its way up and can fly hard.
Whereas stocks like sun pharma which has been posting 52 week high above 485 is facing supply in the 500-510 range. Once it overcomes this, it can go higher but since it has fallen from levels as high as 1200, it will face supply at various zones on its way up.
But one has to remember that a stock that posts all time highs started off by consistently crossing 52 week highs. Here one has to try and find out fundamental triggers. If these triggers suggest strong upsides, it makes sense to get in these situations too.
When a stock makes all time high, then all the shareholders are sitting at profit and no one is in loss. The selling comes due to profit booking by some but in such stocks the selling pressure is less.
Whereas the stocks which makes 52 wk high but are below all time highs may have some longterm shareholders sitting at loss and waiting to breakeven plus they will have resistance zones where selling will come by technicians and they will also encounter profit booking by those who bought at lower prices. So the selling pressure is more as compared to all time highs.
Generally it is the leaders which make all time highs and not the laggards. Even when the laggards do, they do with great difficulty which is reflected in the chart pattern.
However, there are other factors also and i have not tested strategy of buying purely on basis of lifetime highs.