Sunteck Realty - Quality Real Estate Company

Since I could not find any discussion with regard to the captioned company,i am starting a new thread on the same. I think that Sunteck makes for a good investment opportunity. Please find below my investment thesis which i have also published on my blog. I have initiated a position in this and safe to assume that my views are biased.

Sunteck Realty
I have been looking at Sunteck Realty stock with a lot of interest lately and my conviction has increased quite a bit over the last couple of weeks since I have been researching the company. It all started when i noticed the beautiful projects of Sunteck (Signature Island, Signia Isles and Signia Pearl) in Bandra Kurla Complex (BKC) where I go for running. I dug a little deeper and found that they have an existing JV with Piramal Realty (Piramal Enterprises being my largest holding) and that Ajay Piramal is invested in the company in personal capacity. That was enough to arouse my curiosity and send me scurrying for more. Here is what i found:

Summary

Business: Real estate is a difficult business due to a variety of reasons but it can earn a good return if it is being run by a disciplined and honest management. Additionally it is a cyclical business whose fortunes are tied to the health of the economy. Sunteck is a quality real estate company which has got a first rate management. It is even more cyclical than a typical real estate company because it plays in the luxury end of the segment. Currently, the stock price of Sunteck is depressed because of couple of reasons - 1) Real Estate industry is going through a protracted downturn, 2) There has been a lot of volatility in reported financial numbers of Sunteck as they use the project completion method unlike the more commonly used - percentage completion method.

Sunteck Realty began operations under the brand name Sunteck in 2000 as a corporate business center operator in Bandra Kurla Complex, Mumbai. It acquired Insul Electronics, a BSE listed company in July 2005. After acquisition the name of Insul Electronics was changed to Sunteck Realty and Infrastructure which was further changed to Sunteck Realty in Nov 2007.

Sunteck caters to the ultra-luxury and luxury residential segment in addition to commercial segment. It currently has city centric development portfolio of about 23 m sq ft spread across 25 projects at various stages of development and 4 rented assets with annuity income streams.

Performance so far
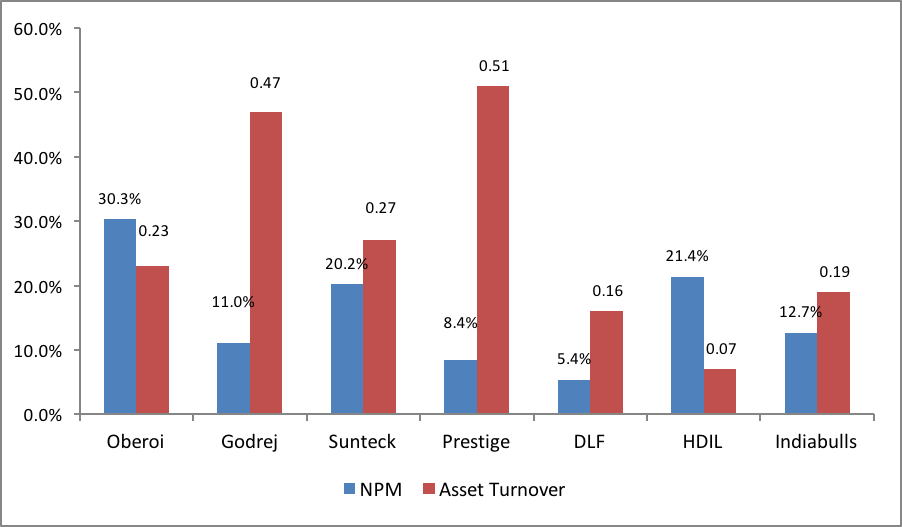
During the last 8 years (FY09-FY16), Sunteck has started recognizing revenues from completed projects in only 3 years - FY14-FY16. Before FY14 none of their projects had reached completion and so they did not recognize any revenues from these as they follow project completion method. Their average return on equity during these three years was 13%. Average over the past 3 years is a better way to measure their returns due to lumpiness of the revenues. While the returns are not great, when looked at the backdrop of dismal state of the real estate industry it is not too bad. I’m sure there is scope for improvement in their performance in the future. This will happen as they get better at execution with experience and the state of the real estate industry improves as the demand comes back.

What makes Sunteck different:

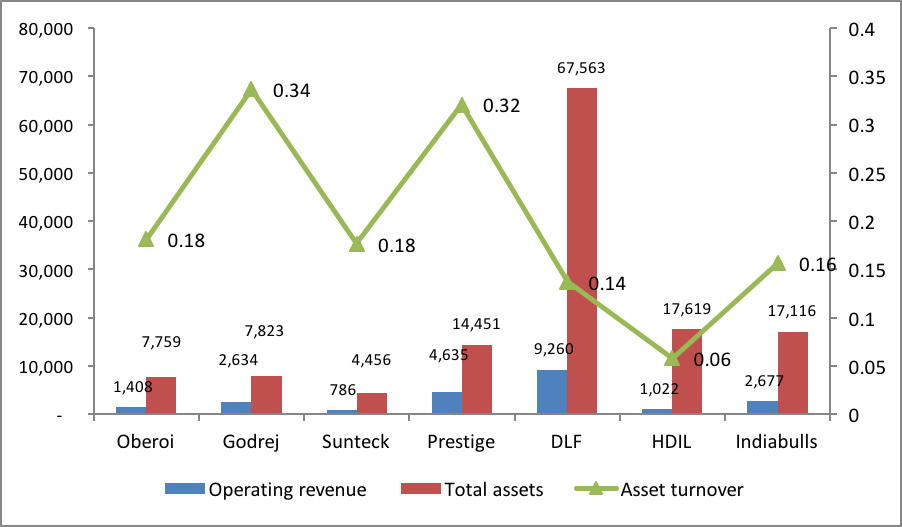
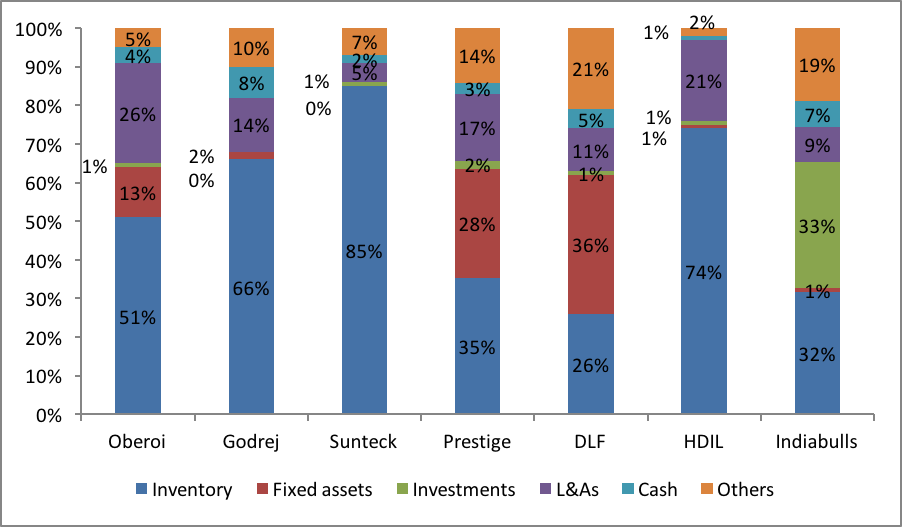
  1. Land as an inventory
    Many real estate companies purchase and maintain large land banks for future development. In the meantime they show the land as an asset on the balance sheet. When a company does that, their capital in the form of land does not earn any returns which depresses the return on capital.

Sunteck on the other hand does not treat the land as an asset but as an inventory. All the land owned by Sunteck is under development and in this way they are able to churn their assets quickly and earn better return on their capital. Which brings me to the next thing - financing.
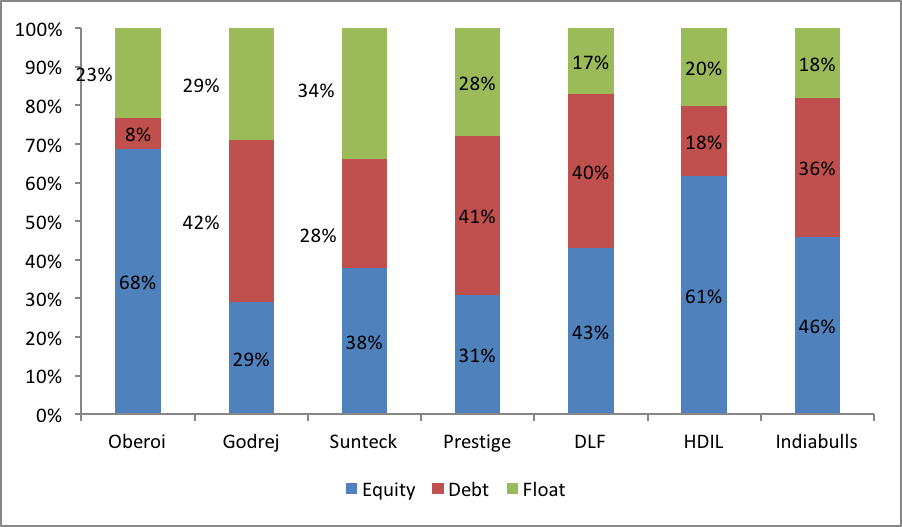
  1. Financing
    In an effort to maintain huge land banks, lot of real estate companies have over-leveraged themselves. However, it is never a good idea to have too much debt and it is outright criminal to do so in a cyclical industry. Because when the downturn comes, which it inevitably will and the demand suddenly goes out, the overleveraged ones are caught with their pants down at exactly the wrong time. In this case, they are forced to sell their assets to bring down the debt to manageable levels, again at exactly the wrong time since they are likely to get depressed prices for their assets (land) due to the recessionary demand.

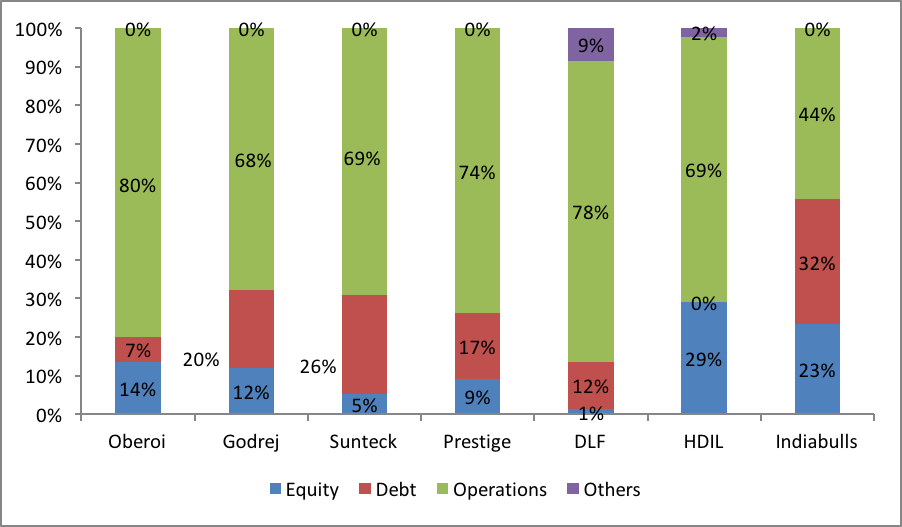
Here again Sunteck has used minimal leverage historically due to conservative nature of the promoters. First of all their land as an inventory policy has helped them and they do not need as much capital. Secondly, they have used a good mix of equity (very little), debt and customer advances to fund themselves.

  1. Timing
    Like in all cyclical industries, timing is of great importance in real estate as well. Generally like in other commodity industries, in real estate as well companies follow herd mentality and they all rush in to add capacity at the same time which sows the seeds for the next downturn. In terms of timing, what usually happens is most of the capacity addition takes place at the top of the cycle when the prices are at their highest. Sunteck on the other hand has a contrarian approach and have been buying land at distressed levels in the current downturn from other real estate companies who are forced to sell to bring down their debt.

  2. Promoters
    The company is led by Kamal Khetan who is a first generation entrepreneur who founded Sunteck in 2000. The promoters have consistently increased their shareholding by buying shares in the open market from 65% in 2010 to more than 73% in 2016. Piramal Group has also reposed their faith in Sunteck - they have an existing JV with Sunteck called Sunteck Piramal Realty. In addition, Ajay Piramal has invested personally in Sunteck by picking up a 3.5% stake in the company in March 2014 and later increased the stake to 4.63% by March 2015. Coming to the remuneration of the promoter, Mr. Khetan has been taking quite modest salary from Sunteck - 2010: 35 la, 2011: 59 la, 2012: 70 la, 2013: 75 la, 2014: 2.97 cr, 2015: 1.6 cr.
    However, what really sets the promoters at Sunteck apart is that they voluntarily decided not to take any dividend during FY2014 and FY2015. During these years the dividend was distributed only to non-promoter shareholders and the promoters voluntarily waived their right to get the dividend. They forego of dividend which would have amounted to INR 4.65 cr in FY 2014 and a similar amount in FY 2015. I can think of very few promoters (unthinkable in real estate) who would do such a thing.

  3. Valuation
    Currently, Sunteck is available at very attractive valuation of INR 1400 cr. Let us look at valuation from couple of perspectives.
    a) If as an owner of Sunteck, i want to do a firesale, how much would i demand from a prospective buyer as a minimum consideration. This should be equal to the amount of funds i have put into buying land and construction of the ongoing projects. In other words this would be value of inventory (which is funded through equity, customer advances and debt) less customer advances less debt. At the end of FY16 this value comes to 3768 (inventory)-917 (customer advances)-1208 (debt) = INR 1643 cr. As we can see this quality real estate company is selling at firesale valuations.

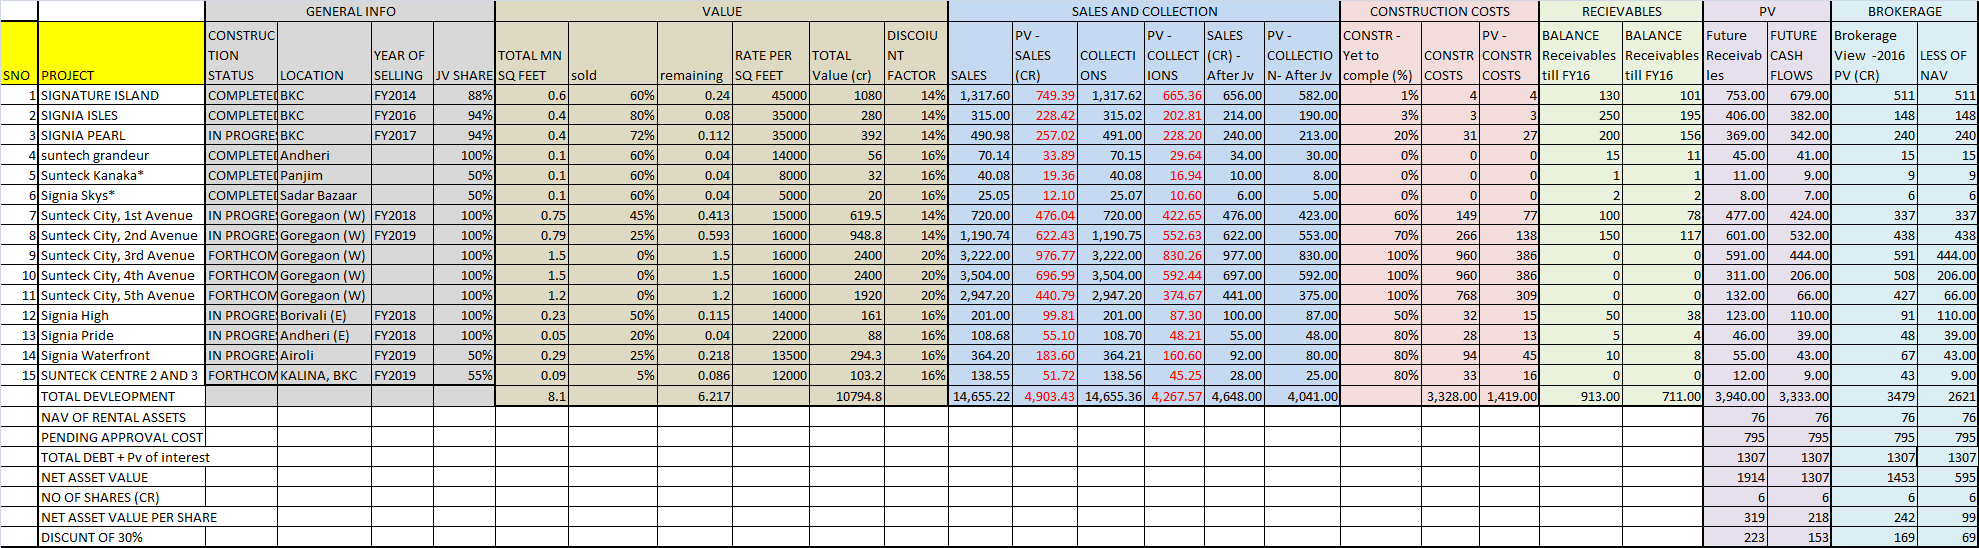
b) Secondly, let us try to do a valuation from cash flow perspective. For that please take a look at the table below taken from the Q3’16 update from the company. The table gives details about the ongoing projects of the company. All figures in INR cr. Since the company uses project completion method for revenue recognition, they have yet not recognized any revenues from the projects which are not 100% complete. Revenue to be recognized from the ongoing projects comes to INR 7,600 cr. - inventory for the first five projects and project size for the remaining projects. Assuming that all the projects will be completed over the next 8 years gives us average sales of INR 950 cr per annum and average net profit of INR 235 cr (assuming 25% net margin). This gives us a conservative valuation of 2,350 cr assuming a P/E of 10. This also assumes that they will not have any revenues from any other projects over the next 8 years.

Completed Project size Sunteck Share Pre sales Inventory
Signature Island Yes 2,570.7 100% 1127.7 1,474.0
Signia oceans Yes 62.9 50% 62.9 -
suntech grandeur Yes 101.4 100% 57.7 43.3
sunteck kanaka Yes 69.4 100% 26 45.0
signia skys Yes 56.9 50% 18.8 38.7
signia isles No 1,376.0 100% 941.3 417.0
signia pearl No 1,469.7 100% 883.4 557.1
sunteck city 1st avenue No 1,208.2 100% 329.5 768.7
sunteck city 2nd avenue No 1,324.2 100% 232.4 1,061.1
signia high No 289.6 100% 126.1 162.0
signia pride No 97.9 100% 10.9 83.3
signia waterfront No 263.3 50% 26.2 238.7
sunteck center II No 122.5 100% 0 128.5

Finally let me talk about the big picture and the overall prospects of the real estate industry specifically in Mumbai. Although Sunteck has presence outside Mumbai in a few places including Goa and Nagpur but their focus will continue to remain on Mumbai in the foreseeable future. While a lot of people tend to believe that Mumbai real estate market is saturated with so much development happening, in my opinion we are just scratching the surface. The landscape of Mumbai will be transformed over the next 10-15 years. Mumbai is developing like a hub and spoke model - with multiple hubs (such as BKC, Goregaon) which contain mixed commercial and residential developments and connected to other hubs through spokes.

So here we have a company which is a quality real estate developer. The company is conservative not only with respect to leverage which it uses sparingly but also in its revenue recognition principles. Additionally this is being run by management with a lot of integrity who are managing the company for the long term benefit of their stakeholders and do not mind taking some short term pains for the same including foregoing personal wealth. They want to create wealth for their shareholders over the long term and not off of them as is usually the case with real estate industry. It is no surprise that stock market does not like this company because stock market is obsessed with short term performance and abhors too much volatility in revenues. It is penalizing this company for their conservatism.

But i have not doubt that in the future as more of their projects get completed, they will reach a higher plateau in terms of revenues. Additionally, the real estate market which is in the dumps right now will inevitably come back roaring. The reversal in the market sentiment is a matter of when rather than if. And when that happens, the stock market will take notice. The trigger for the correction in undervaluation is three fold here - 1) Even if there is no change in sentiment with regard to the industry and the performance of the company remains as it is, I have shown above that the company is still undervalued 2) Their performance should improve over time 3) The real estate pendulum will swing again from from too much pessimism to too much optimism. As all of this takes place i’m happy to hold on to this and wait for the rewards alongside the management.

17 Likes

Few queries and observations…

  1. Why is average interest cost less than 2% ?

  2. Most if not all real estate companies carry land as inventory…which is part of asset side on balance sheet :slight_smile:

  3. Why would you consider leverage low ?? Debt has gone up from Rs 592cr in March 2014 to Rs 1240cr in FY16.

Please highlight company specific risks with your investment thesis.

2 Likes

I am also looking at sunteck, Agree with most of your positives,but
A) Very Slow Execution track record
B) Luxury being cyclical , not sure when will it turnaround and even then could be the last to turn-around
C) No wealth creation track record of company
D) Recent Debt increase
E) Not sure of average 950 crore topline for next 8 years based on current slow state of project completion.
F) My Net profit margin assumption at 20%

Thabks for starting a thread
Project completion method is not the way as you described it. It means the company will recognise revenue based on completion hence if 50pc of the project is completed they will recognise 50pc of revenue

Ideally it should be stock if the apartments inventory is not sold

I would be interested to know what policy other real estate companies follow before investing as project completion method can be fraudulently over estimated
I am sorry I haven’t had a chance to look at their reports yet. Are you sure they follow project completion method or the buildings are shown as WIP or finished stock based on completed or not and sold or not?

Land being assets or stock doesn’t really matter but showing it as stock gives the company an advantage as it rises their current assets hence their liquidity and current ratio

I think any company showing it as assets is more conservative in their accounting treatment than the one showing it as inventory

Would be so kind to upload your calculation on forecast revenue you mentioned

Thanks nirav and raj for pointing out the risks, i should have covered these in the thesis itself. Let me try to address them:

Debt: Debt is not too high but i would have preferred if there was no debt at all. The actual bank borrowings (as per the latest results update - http://www.sunteckindia.com/images/press-release/Results-Update-Q4-FY16.pdf) are INR 789 cr. The remainder of the debt (INR 455 cr) is quasi-equity in nature and includes ~Rs.150 crs from Ajay Piramal Group and the balance is advance towards finished goods and from Promoter/Group Companies.
Interest cost is less most probably because of the project completion method of revenue recognition. In this method, revenues and expenses are not recognised until the entire project has been completed. The loans that they have taken are all project specific and hence it is only fair to recognize the interest expenses when the corresponding revenues have been recognized.

Land as Inventory: While most of the real estate companies might be treating the land as inventory in their balance sheet, many real estate companies maintain huge land banks. If the land is sitting idle on the balance sheet for years, it is not in principal an inventory although it might be accounted for as such. As an example DLF derives close to 60% of its market value from its land bank while the similar figure for Sunteck or Oberoi is NIL because almost all the land is under development.

Execution: Execution has been slow in the past and this is a risk which i’m willing to live with. I’m betting that execution will improve as they get more experience. I also take cofort from the fact that the following projects are in advanced stages of completion - signia pearl, sunteck city 1st avenue and signia high and work has started for the following projects - sunteck city 2nd avenue, signia pride, signia waterfront, sunteck center 2 and sunteck center 3 (please refer Q4 update).

Luxury more cyclical: This is again a risk which i’m willing to live with. Although this (real estate turnaround) is just one of the triggers and there are multiple triggers for value unlocking here as i have mentioned in my thesis.
In general my investment horizon whenever i make an investment is for the long term. Ideally i would never like to sell any share and continue to hold as long as the investment thesis remains intact. In this case, I do think that 5-7 years is a resonable time frame to expect the real estate market to turn around. If you have a shorter time horizon, probably this is not ideal investment for you.

No wealth creation track record of the company: Again this is a risk which i’m willing to live with. I take comfort from the fact that Piramal Group and Ajay Piramal personally have put their money with them. Additionally they have also raised funds from reputed PE funds like Kotak (who has already exited at a good return) and KKR (who invested in Feb 2016).
Will separately upload the calculations etc.

With regard to valuation, i think probably 20% profit margin might be a better estimate. But i just wanted to show that it is hugely undervalued at current price as evidenced by their firesale valuation. Even from cash flow perspective, I have not accounted for any other development over the next 8 years or increase in prices on account of turnaround of the industry.

Edelweiss initiates buy on Sunteck with a target price of 345.

Sunteck Realty has 24msf of Mumbai-centric quality land bank, ability to source value accretive land deals, reasonable balance sheet and relatively short-time for land bank monetisation.
It has established its presence in the competitive Mumbai market through marquee BKC developments and is well-positioned to monetise its key Goregaon land parcels.
We expect new sales to double to 10.6 billion by FY18,47 billion of pre-tax cash flows from ongoing projects over next 5-6 years and 40% earnings CAGR over FY16-18E. We initiate with ‘buy’ and target price of 345/share derived by applying 30% discount to March 2017 NAV of493/share.
SRL has demonstrated ability for value creation in competitive Mumbai market through: differentiated product offering in BKC (land purchased at competitive prices) for ultra HNIs; purchasing land at distressed valuations and leveraging its ability to resolve complex land ownership issues and ability to forecast and capitalise on infrastructure-led demand improvement at Goregaon.
It has entered into asset-light JDA/JV agreements with land owners for project development and has received support from PE players for large upfront investments.
We envisage significant scale up in SRL’s operations underscored by improved execution and sales push in its ongoing projects and liquidation of unsold but completed inventory.

1 Like

Any idea what could be the triggers for value creation? otherwise you have so many real estate companies that are trading at a big discount to their NAVs or potential earnings.

There are multiple triggers for value creation as i have mentioned in my thesis.

  1. Sunteck sells at a bigger discount than its competitors because of the volatility in its revenues. However, as i have mentioned above that is because it uses the more conservative project completion method. As analysts become more comfortable with the reporting, the valuation discount due to volatility should narrow.
  2. Improved performance due to better execution
  3. Turnaround of the real estate sector: Mumbai real estate is really in the dumps right now. Please read this article to gauge the desperation - http://www.bloomberg.com/news/articles/2016-06-16/footballer-zidane-tapped-to-boost-sales-at-mumbai-luxury-project

In that sense this is a contrarian investment, where the investment is being made when it seems that this downturn will never end. But as we know, the pendulum always swings from too much pessimism to too much optimism. While it may take time, but there is no doubt that the cycle will turn.

In terms of timing, I cannot say if there is any immediate trigger. But i’m happy to invest with a horizon of 5-10 years.

Nice points

  1. DO you have Latest Conference Call Details (Q3 or Q4fy16) or cash flows as of Q4fy16 project wise.
  2. How do we be sure that sunteck is trading at Bigger discount than peers? Have you checked with any other peer? ( Not Godrej or prestige), but mid size developers ( Example puravankara or kolte patil or anant raj)
  3. Can you provide your yearly estimated cash flows? When do you think cash flows will break from 400 to 500 cr range to say move to 700 -800 cr range…

Ajay Piramal increases his stake in Sunteck realty - now almost ~5% of equity

So Promoter + Piramal holding now close to 80% - leaving little free float of about 350cr in the market.

http://www.bseindia.com/xml-data/corpfiling/AttachLive/36A28405_E647_455A_97C4_D13F57E32336_171912.pdf

1 Like

Thats a good sign isnt it. For long term investors like us who are not interested in trading in and out of stocks, liquidity shouldnt be an issue.

1 Like

Sharing a recent interview of Khushru Jijina - MD, Piramal Fund Management

@kashif_1461
Around the 20 min mark in the video, Khushru talks specifically about the luxury/ultra luxury projects in Mumbai stating that luxury apartments along with high volumes doesn’t sell.

Would like to know your thoughts as Sunteck has a couple of such projects with unsold inventory in BKC - and I believe this is part of the management’s guidance for FY17 growth of 20-25%.

Good Q1 results

This one is slightly dated (about 10 days old - 6th SEPT’16) but can give you a good perspective on revenue recognition model and a peep into what is possible
http://www.indianivesh.in/Downloads/636089319001250000_Sunteck_Realty_Ltd_Initiating_Coverage_06092016.pdf
PS - recently invested

Would really like to understand the reason for the massive dip in margins.

FY16 PAT margin was 21% and EBITDA margin 31.8%.

Now FY17 Q1 PAT margin is 11.4% and EBITDA margin 22%

Infact, putting it this way provides better understanding of the performance

In Q1 FY17 company has already achieved 66% of full FY16 revenues but only 37% of profits

I have done a detailed writeup and comparison on the real estate developers including Sunteck. I’m presenting it here in the following post. I would appreciate comments from other boarders on the quality of writeup as well as the content. I have also down a writeup on the general condition of real estate industry in India as a precursor to this. That can be found on my blog - https://reflectionsoninvesting.wordpress.com/2016/10/08/current-state-of-real-estate-sector-in-india/

4 Likes

Introduction

As we saw in part 1 of this article that we are at the cusp of a turnaround in the real estate sector in India. We are probably 2-3 years away from a broad-based recovery. If that is so, the next question is - what is the best way to take advantage of this turnaround. From an investment perspective, is there a better way of playing the real estate cycle than buying a house. The answer is yes, we can chose to invest in the stocks of select real estate developer(s). The stocks should provide a better return than the underlying real estate during the upturn in the cycle. The stocks are more volatile than the house prices i.e. they will perform worse in case of a downturn and will give better returns during the recovery period when compared to the underlying house prices. This is because of rampant speculation in the stock market. Anyone with a demat account can start trading in stocks whereas you need a substantial amount of money (as down-payment) to buy a house. During the subprime crisis people were able to buy houses with very little down-payment and we all know now what happened there!!

Financial analysis of select real estate developers

In the remaining part of this article I will try to analyse the financials of some select real estate developers to understand their performance during the past few years (FY2010-16). We will look at their performance from multiple angles – including their P&L, balance sheet and the cash flows to gain a deeper insight into their workings. I have selected the period FY2010-16 as that is the period for which data is readily available for all the companies. We will look at the performance of the following seven real estate developers – Oberoi, Godrej, Sunteck, Prestige, DLF, HDIL and Indiabulls. While this analysis will help to get a broad perspective on the performance of these developers, it cannot be used to form a view towards investing in them. For them a more nuanced and deeper analysis will be required.

With this background let us get started. First of all, we will try to get some idea of the scale of these developers. Figure 1 gives the total assets, operating revenue and asset turnover (operating revenue / total assets) for the selected companies for FY16. While assets and revenues give us an indication of the size of the developer, asset turnover signifies efficiency of the operations. The top three developers in terms of scale from an asset perspective are – DLF, HDIL and Indiabulls; while from a revenue perspective – DLF, Prestige and Godrej. From the chart, Godrej and Prestige stand out for their total asset turnover which means that they are utilizing their assets most efficiently than the others.

Figure 1: Total assets, operating revenues and asset turnover (FY16)

The next chart gives a snapshot of the market value of the companies on three parameters, two of which are balance sheet based – price to total assets and price to book and one P&L based – price to earnings. I think a balance sheet based measures give a better perspective on valuation for these companies (at this stage) because their earnings have been quite volatile for the past few years. Further due to the downturn in the real estate cycle their profitability has taken a beating.

The chart is quite revealing and the blue line tells us that market values the assets of only Oberoi (@1.31) more than the value of their total assets while the rest of the companies are selling for less than their total asset values. The second and third place on this parameter is taken by Godrej and Prestige with values of 0.92 and 0.52 respectively. The bottom three are rounded out by Sunteck (0.36), Indiabulls (0.26) and HDIL (0.22).

One reason for this could be excessive debt. The green line takes care of the debt and compares the market value with the book value (or net worth) of respective companies. The most expensive companies on this parameter are again Godrej (3.19), Oberoi (1.92) and Prestige (1.68) with Godrej and Oberoi swapping places for the first and second position. The bottom three are DLF (0.89), Indiabulls (0.56) and HDIL (0.36).

Finally, we take a look at the most famous parameter P/E ratios. Top 3 has one unusual entry and two usual suspects – DLF (52), Godrej (25) and Oberoi (24). Bottom 3 – HDIL (18), Indiabulls (13), Sunteck (10).
The data clearly suggests that market is giving rich valuations to Godrej and Oberoi. On the other hand, Sunteck, DLF, Indiabulls and HDIL’s are being valued cheaply and Prestige is somewhere in the middle. In the remainder of this article we will try to understand that reason in the light of their past performance and see if these developers really deserve their valuations.

Figure 2: Mcap/Total assets (left axis), Mcap/Networth (left axis), Mcap/Earnings (right axis)

Next, we analyze the asset side of the balance sheet to determine the composition and quality of the total assets as depicted in Figure 1. The major categories of assets can broadly be classified into:
Inventory: value of land under construction and the construction cost for which the corresponding revenue is yet to be recognizedwhich has so far not been recognized as revenueies. ied into: he markets valuation are in line with the performance of the com.

Fixed assets: land bank plus other fixed assets owned by the companies. Other fixed assets would generally include commercial real estate which is owned and on which the developers earn rental income. We can see from the chart that only three companies have a high proportion of fixed assets – DLF (36%), Prestige (26%), and Oberoi (13%). Which also means that these three companies have substantial commercial real estate assets. Indiabulls also comes in this category of developers as we will see below.

Investments: Indiabulls stands out for its highest investment at 33%. I suspect that this is their investment in other Group companies which hold various assets including land bank and commercial real estate. Hence, this should be treated more like a fixed asset instead of investment.

Loans and advances: L&As include advances given to vendors, deposits for projects etc. We see relatively higher L&As in case of Oberoi, HDIL and Prestige. For Oberoi, this is due to L&As to related parties. For HDIL it is due to advances for land purchase and for Prestige it is due to deposits and advances for land purchase.

Others: other assets include trade receivables, goodwill etc. Other assets are higher for DLF and Indiabulls mainly due to high unbilled receivables, and Prestige due to high goodwill and trade receivables.

Figure 3: Composition of total assets (FY16)

In the chart below, I present the corresponding liability side of the balance sheet which shows how the assets have been financed. In general the assets can be financed through three sources; equity, debt and through other liabilities – for the moment lets call all the other liabilities as float. Other liabilities will include customer advances, accounts payable etc. Equity can built up through two sources – 1) equity infusion from outside sources e.g. QIP, IPO, equity warrants etc. (equity dilution in other words) and 2) internal accruals or profits. Broadly all sources of liabilities can broadly be divided into internal and external sources. Real estate developers are forced to raise money from external sources (debt or equity infusion) for completing the ongoing projects or buying new land when internal sources prove inadequate. In general, the lesser the outside sources of liabilities the better the developer. A company which can continue to grow without using too much outside funding is rare. In other words, if a company generates enough cash to fund its operations without utilizing outside funding, there must be something special about it. We might even say the company possesses a moat.

The chart below does not give a breakdown of equity from internal and external sources. However, the data in figure 6 gives a rough indication of that as well. Read together (Figure 4 and 6), let us see what they tell us.

Oberoi clearly stands apart from the entire bunch. They have done 14% equity dilution (Figure 6) during the last 7 years and have managed with only 8% debt (figure 4) translating to roughly 22% outside funding. Which means that Oberoi is able to attract customers who provide it with advances to finance the construction and hence they need minimum outside funding. This must be a measure of the trust they have managed to build with customers over a long period of time. This trust acts as a source of competitive advantage for them.

The second company after Oberoi is Sunteck which has managed with 33% outside funding. Then we have DLF with 41%, HDIL 47%, Prestige 50%, Godrej 54%, and Indiabulls 59%.

The second point to note is that Godrej, Prestige and DLF have the highest amount of leverage at the end of FY16.

Figure 4: Composition of total liabilities (FY16)

So far we have looked at the balance sheet of the companies both from an asset as well as liabilities perspective. From the last figure, we have seen that as of the end of FY2016, Oberoi and Sunteck have used minimal outside funding and have been able to generate cash through internal accruals. At the other end of the spectrum are (surprisingly) Godrej and (not surprisingly) Indiabulls who had to rely on maximum outside funding to take care of their operational needs.

In the next few charts I will look at the cash flows of all the companies during the period FY10-16. Figure 5 simply shows the total cash inflows for the companies during this period.

Figure 5: Total cash inflows (FY10-16)

Next we move on to take a detailed look at the source of cash flows during this period (FY10-16). This figure is similar to Figure 4. The source of cash inflows can be either of the following – equity, debt, revenues (or operations), and others. Any equity cash inflows in this figure refers to external equity infusion. Here again, we would like the developers that are able to generate a majority of cash from operations as opposed to debt or equity.
First things first. As we have seen from our earlier analysis of the source of liabilities, Oberoi is the best and Indiabulls the worst in terms of the cash generated from internal accruals during FY10-16. After Oberoi, the developer with the second highest cash inflows from operations is DLF with 78%. Then we have Prestige, Sunteck and Godrej in that order at more or less similar levels in terms of internal cash generated during this period. HDIL and Indiabulls have been absolutely terrible during this period. HDIL has done a massive 29% equity dilution. Indiabulls has raised external cash with 23% equity dilution and 32% debt.

Figure 4 and 6 combined also tell us something more about the leverage levels of the developers. Godrej, Prestige and DLF have raised moderate amount of debt during the period FY10-16. Despite that they have ended with highest amount of leverage at the end of FY16. Which also tells us that they probably started (FY10) with high amount of leverage.

Figure 6: Source of cash inflows (FY10-16)

Continuing from the previous figure, next we take a look at the utilization of the cash flows during the period FY10-16. Real estate developers utilize the funds towards land purchase and construction expenses and others as shown in Figure 7. We would like to see the maximum funds being utilized towards operating expenses and capex which are the core activities of any developer. It is only when we look at this chart, the amount of mismanagement of funds at DLF and HDIL starts becoming clear. At these two companies more than 20% of the cash inflows were utilized for interest and debt payments, money which might have been utilized more effectively elsewhere.

Another thing to note is that despite Prestige and Godrej also having high amount of leverage, their outflows on amount of interest have been relatively modest at 6% and 1% only. Which means that they have been able to raise debt at much better rates due to some reason.

Figure 7: Utilization of cash (FY10-16)

Finally let us take a look at the profitability of these companies for FY16. I have done a Dupont analysis of profitability in the next two charts. The first chart shows the net profit margin and asset turnover of the companies. The second chart depicts the leverage and the resultant ROE. Whatever way you look at it, DLF, HDIL and Indiabulls clearly stand apart from the rest as the worst performers in terms of profitability as well.

The others also do not display great profitability - the profitability varies from Oberoi at 8% ROE to Godrej at 12.6%. However, both Godrej and Prestige have used high amount of leverage to magnify their returns. However, we should note that the profitability of the entire real estate sector has been dented due to the downturn and is currently at the lowest level. As we move into the upcycle of the sector in the years to come, the profitability numbers should improve.

Figure 8: Net profit margin and asset turnover (FY16)

Figure 9: Leverage and return on equity (FY16)

Conclusion

To sum up, Oberoi is an excellent developer and has a lot of credibility among the customers which they have built through good quality product and seamless delivery over a long period. They need little external funding because their customers are willing to fund their operations through advances.

Godrej lags behind others (though not by too much) in terms of cash generated from operations. Also, the amount of external funding in their capital structure is second highest after Indiabulls. In addition, they have the highest leverage amongst all developers. On the positive side, they have displayed with profitability which can be partly attributed to high leverage (bad) and party to high asset turnover (good). Given their ordinary performance, it is difficult for me to justify their premium valuations.

Both Prestige and DLF have generated good amount of cash from operations during FY10-16. Prestige has raised moderate amount of debt as well as equity while DLF has raised low amount of equity and debt during FY10-16. Despite this both have ended up with high amount of leverage at the end of FY16. But the cost of the debt for DLF has been much more onerous than that for Prestige. Additionally, profitability wise also Prestige is ahead of DLF by a wide margin.

Sunteck has required external funding but they have managed through a judicious use of debt and equity. They have shown discipline in their source of funding during the short period of their existence. Their performance has been commendable and they have shown the potential to become a large and profitable developer.

For HDIL and Indiabulls, I don’t have anything positive to say!!!

31 Likes

Thanks for detailed work. However, one question. Why did you pick only these companies. From an investor return perspective I see ,sone of key companies missing . I believe you could have covered companies with better quality (revenue n size does not necessarily mean best company in sector but they are good to compare with. ). I would be highly interested to include ashiyana housing , kolte patil and arvind infra to this. If you can share your template , I can leverage over this and di the same .again, great effort. Thanks

1 Like

I should have included the companies you mentioned as well. It would be helpful if you can do the work for these. I’m uploading the excel for the work done so far. Feel free to get in touch with me if you have any questions.Real estate sector companies - cash flow analysis.xlsx (52.7 KB)

1 Like

Humble thanks Kashif for sharing your work :slight_smile: Will respond in few days with updated work. Also, I have done some work on Ashiana housing with project pipeline built in valuation. I believe some more folks doing similar work. We all should join hand and build something strong for real estate sector leveraging on each others work. Will respond in few days once done.

My analysis on sunteck based on important projects

  • Present value of future cash flows = 3333 cr
  • Rental Assets NAV = 76
  • Pending Approval Cost = 795
  • Total Debt and Pv of interest = 1307
  • Net Asset Value = 1307
  • No of shares (cr) = 6
  • Net Asset Value per share = 218