There is a lot of discussion about art of valuation and various techniques to be used in valuations on this site. However, there is no tool available where all these techniques and guidelines can be put together to calculate intrinsic value and expected returns.
Several investment books teach discounted cashflow model as the logically correct way to value an asset. However, DCF is difficult to use if you do not use correct inputs. DCF is also highly sensitive to growth rates and discount rates and many users I have seen do not have a reasonable basis for estimating these inputs. The result is investors have no confidence in their DCF models and use P/E or other price multiples as the shortcut method of valuation. Analysts even manipulate inputs to DCF to arrive at a valuation that they have intuitively derived or their target price.
I have been using a simple spreadsheet based model that uses discounted cashflow to calculate intrinsic value of an equity investment and shoter term expected return. during the VP Goa meet, several members asked me to demonstrate the model however there was not much time available to explain the model in detail. Here is the spreadsheet and some notes I had prepared earlier for the model.
Equity Valuation.xls (173 KB)
In case you are using latest version of Excel try the one below.
Equity Valuation.xlsm (102.8 KB)
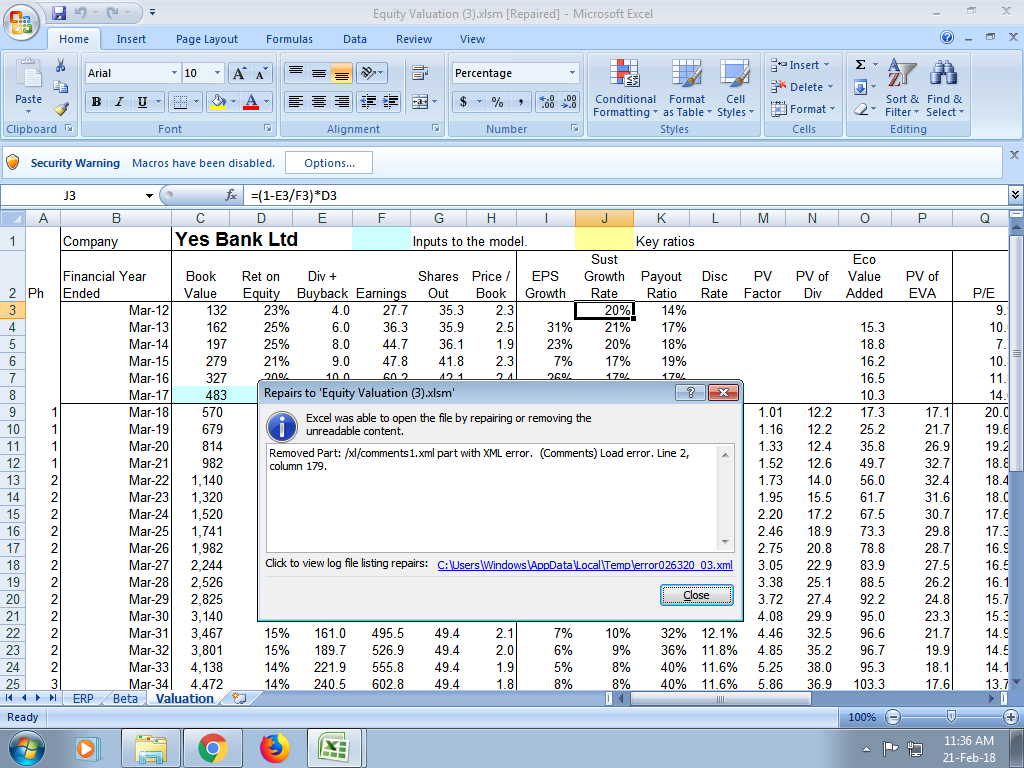
This spreadsheet uses Yes Bank to illustrate the model but you can input ratios and numbers for any other company to calculate its value.
What will you need to use this spreadsheet:
- Last financial year ROE, earnings, dividends, buyback (if any) amount, shares outstanding, price to book value.
- Current (TTM) book value, profits, shares outstanding, EPS, SPS, share price.
- Your expectations for future in terms of future ROE the business is likely to generate, future growth rates of earnings that business can achieve, and riskiness of the business.
- To calculate beta, you need stock prices and index values for last 2 to 3 years. Alternatively you can use beta estimate already available on public websites. Most of these give historical beta. This is good enough but if there is a fundamental change in risk profile of the company using historical beta can lead to inaccurate results. This model uses a simple linear OLS regression to estimate future beta.
- To calculate equity risk premium, you will need index values for last several years. You can use the one provided in the spreadsheet and update the numbers as time goes by. Alternatively use your own estimate of ERP.
All the above information is easily available on Screener.in or other public websites like exchange websites.
What does the spreadsheet model do?
- It uses past, current and expected future values and projects future book value, earnings, dividends, discount rates etc for next 2 to 20 years.
- Based on these future projections, it calculates present value of future dividends and terminal value to arrive at present value using dividend discount model (DDM). Terminal Value is calculated using Gordon Growth Model.
- Additionally, residual income model is used to calculate present value of economic value added as a way to cross check DDM valuation.
- A third model called Capital Asset Pricing Model (CAPM) is used to arrive at intrinsic value based on short term projections that are interpolated from longer term projections.
- It allows user to simulate various scenarios like slow growth scenario, high growth scenario, additional capital raising, short to long competitive advantage periods, wide and narrow moat scenarios, risk-averse vs risk-neutral valuations etc.
- It allows user to determine what future growth and profitability is already priced in current market price (by using the model in reverse way, explained later).
Dividend Discount Model.
This is a standard discount cashflow model that uses dividends as cashflows. Several users use free cash flow (FCF) as the cashflow in a DCF but I think FCF requires an ownership perspective where as DDM requires minority investor perspective. In Indian context, promoters usually are not willing to give up control of their companies in a sellout or M&A and no other investor can acquire controlling stake from open market purchases (since promoter already owns more than 50%). In such a scenario, a business cannot be valued using an ownership or control perspective but only as a minority investor perspective.
Another way of looking at DDM vs FCF issue is to look at the practical meaning of the cashflow to be used in a DCF. CF in a DCF is the amount of money that can be hypothetically taken out of the business without affecting the growth of the business. Dividends (and buybacks) is the actual money that is being taken out of the business without affecting the growth of the business.
An investor can actually take out FCF out of a business only if he/she acquires a controlling interest in the company. Dividends on the other hand is the money received by a minority investor that is being taken out of the business. So if you are taking a minority investor perspective then a DDM is more appropriate than FCF based DCF model.
Yet another reason to use dividends instead of FCF is that it is far easier to estimate long term dividends and growth rates of dividends than to estimate long term FCF and especially growth rate of FCF.
Basic assumptions in the model:
- Model assumes reversion to mean principle for profitability, growth opportunities and riskiness of the investment. This model is best suited for companies that are experiencing above average growth rates and profitability, which is like to revert to mean sooner or later.
- Model assumes that as the growth opportunities shrink, company will retain only the required amount of capital needed to sustain current and expected growth rates and excess capital will be returned to shareholders in the form of higher dividends and buybacks. This assumption may not hold if company is expected to just hoard excess capital and deploy it in low return investment opportunities on a long-term basis. In such a scenario, a lower net future profitability (ROE) assumption should be used.
- Model uses Return on Equity as the measure of profitability. For highly leveraged companies, return on capital employed is a more appropriate measure. However, I avoid highly leveraged companies and as an equity investor, return on equity is ultimately the most important shareholder return indicator.
- Model uses a three-phase approach for future projections. A high growth phase in which growth and profitability of the company is expected to be higher than average, followed by a slowdown period in which profitability and growth opportunities are expected to drop until they reach a level at which profitability is aligned with average profitability of the industry and competitive position of the company within the industry and growth rate of the company is closer to nominal GDP growth rate of the economy in which company operates.
- Model has a horizon of 20 years, i.e. high growth phase and slowdown phase together can be modeled as anywhere from 2 to 20 years.
- Gordon Growth Model is used to calculate terminal value.
- Model assumes that a business growing at a high growth rate has higher risks than a business that is slowing down or has reached a mature phase.
- Model uses CAPM Beta as the main measure of systemic risk. Beta is calculated by using BSE200 index as a proxy for market. An alternate measure of beta can also be used which uses true market portfolio (consisting of equities, fixed income, real estate, commodities etc) but that is work in progress at the moment.
- Model assumes that nominal GDP growth of the Indian (and world) economy will decline over time as both real GDP growth rate and inflation rate are likely to decline over long periods of time.
- Model uses equity risk premium along with beta and risk free rate to calculate discount rate. RBI reverse repo rate is used as the risk free rate. Equity Risk Premium is the additional return investors are demanding over and above risk free rate to own a risky asset like Indian stocks. A simple ordinary least squares regression over BSE200 index is used to determine required return from Indian equities.
How to use this model:
- In spreadsheet ERP, which calculates equity risk premium, enter monthly values of BSE 200 index. Add additional rows as months go buy. Copy formulas in adjacent columns.
- As and when RBI revises reverse repo rate, enter the rate and effective date in sheet ERP (columns I & J).
- Enter weekly stock prices and BSE 200 index values for last 3 years in sheet Beta. Add additional rows as weeks go by. Copy formulas to newly added rows. Alternatively use Beta estimates available publicly. Ensure that these estimates are accurate.
- Worksheet Valuation is the main sheet. It has several inputs and formulas. Input cells are marked with a blue background color. Key ratios are marked with Yellow background colors. Here is a list of all the inputs:
-
**a. Last fiscal financial ratios in range C8 to H8**. Enter ROE, Book value per share, Dividends and buybacks per share, Earnings per share, Shares outstanding (in Cr), and price to book value calculated using year end book value divided by average price during the year (you can also use closing price for the year).
**b. Optionally enter same ratios for last 5 financial years** but this information is used only in charts not in calculations. Else delete these numbers from the sheet.
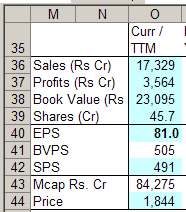
**c. Enter current / TTM values** of sales, profits, book value, shares outstanding, EPS, SPS and current price in range O36:O44.
 **d. Enter projections for future** for each of the three phases:
-
**i. Inputs for High Growth Phase**
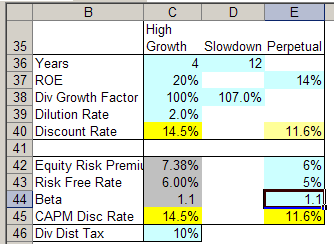 **1. Years** - This is the number of years company is expected to grow at a high growth rate. This is equivalent to competitive advantage period during which growth rate and profitability is higher than average. Typically 2 to 5 years. There are companies that grow at a high growth rate for much more than 5 years but as investors, it is conservative to assume that current growth rate will continue for up to a maximum of 5 to 8 years and then revisit this assumption every year.
**2. ROE** – This is return on equity company is expected to achieve at the end of high growth rate. This can be same as, higher than or lower than current ROE. Average companies generally earn an ROE close to their cost of equity capital. Companies with moats earn a return far higher than their cost of equity capital. Typically if current ROE is 20-25%, it is reasonable to assume that company will continue to earn the same ROE for next few years. A number higher than 25% is usually an optimistic expectation especially if you are also using a high number for years of high growth period. Arrive at these two inputs based on your fundamental analysis of the company and growth plans that are already in place.
**3. Dividend Growth Factor** – This is the % rate at which dividends will grow faster than sustainable growth rate. 100% means dividends will grow at sustainable growth rate. 110% means dividends will grow at 110% of sustainable growth rate. If a company has high growth opportunities and it can grow faster than its sustainable growth rate, then a company can choose to limit dividend payments or even reduce dividend payments. On the other hand if growth opportunities are already declining, company is expected to raise dividends higher than sustainable rate as it will not need to reinvest all the cashflow back in the business. Typically, this value is 100%. Reduce it to 95% or 90% if you feel growth opportunities are high, or increase it to 105% or 110% if you feel growth opportunities are declining. This number controls the growth rate of dividends and payout ratio in high growth period. Select a value for Dividend Growth Factor such that resulting profit growth during high growth period matches expected growth during this period based on the growth plans and opportunities that are currently visible.
**1. Years** - This is the number of years company is expected to grow at a high growth rate. This is equivalent to competitive advantage period during which growth rate and profitability is higher than average. Typically 2 to 5 years. There are companies that grow at a high growth rate for much more than 5 years but as investors, it is conservative to assume that current growth rate will continue for up to a maximum of 5 to 8 years and then revisit this assumption every year.
**2. ROE** – This is return on equity company is expected to achieve at the end of high growth rate. This can be same as, higher than or lower than current ROE. Average companies generally earn an ROE close to their cost of equity capital. Companies with moats earn a return far higher than their cost of equity capital. Typically if current ROE is 20-25%, it is reasonable to assume that company will continue to earn the same ROE for next few years. A number higher than 25% is usually an optimistic expectation especially if you are also using a high number for years of high growth period. Arrive at these two inputs based on your fundamental analysis of the company and growth plans that are already in place.
**3. Dividend Growth Factor** – This is the % rate at which dividends will grow faster than sustainable growth rate. 100% means dividends will grow at sustainable growth rate. 110% means dividends will grow at 110% of sustainable growth rate. If a company has high growth opportunities and it can grow faster than its sustainable growth rate, then a company can choose to limit dividend payments or even reduce dividend payments. On the other hand if growth opportunities are already declining, company is expected to raise dividends higher than sustainable rate as it will not need to reinvest all the cashflow back in the business. Typically, this value is 100%. Reduce it to 95% or 90% if you feel growth opportunities are high, or increase it to 105% or 110% if you feel growth opportunities are declining. This number controls the growth rate of dividends and payout ratio in high growth period. Select a value for Dividend Growth Factor such that resulting profit growth during high growth period matches expected growth during this period based on the growth plans and opportunities that are currently visible. This input controls growth rate of dividends in high growth period. Some companies pay a fixed % of profits as dividends, while others raise dividends at a rate similar to rate of growth of earnings. Based on the pattern of dividend payments over the past 3 to 5 years make a judgment about rate at which future dividends will grow and select dividend growth factor accordingly. I generally use a trial and error to set this value. **4. Dilution Rate** – This is the annual rate at which company will dilute current equity capital to raise additional capital to fund growth opportunities. 0% means no new shares will be issued and current growth opportunities will funded by internal accruals and debt. Typically use value of 0%. If you believe company has high growth opportunities that cannot be funded by current internal accruals including reduced dividend payments and company will need to raise additional equity capital, use a value between 1% to 3%. Use the growth in shares outstanding over last 5 years as a yardstick. Promoters in India are averse to diluting their stake in the business.
Additional capital is assumed to be raised at current price to book value ratio. If the current book value is high, adjust the number accordingly. Using too high dilution rate (especially for financial companies) will result in significantly higher valuation. When companies ae raising additional capital, growth in net profits will be higher than growth in EPS so use growth in profits and make sure that this growth in profits is actually achievable.
-
**1. Years** – This is the numbers of years over which company’s growth opportunities and profitability will revert to sustainable levels from high levels. Typically 5 to 15 years.
**2. Dividend Growth Factor –** This is same as Dividend Growth Factor for high growth phase. As the company’s growth opportunities shrink, a good company is expected to raise dividends as it retains only the capital required to sustain reduced growth opportunities and return excess capital to shareholders in the form of dividends or buybacks.
This number controls the sustainable growth rate in terminal phase. Terminal value is sensitive to this number and present value is sensitive to terminal value so this number is important.
Typically, I use a number such that resulting terminal growth rate of a company will be lower than nominal GDP growth of the economy (in INR terms) in which the company operates. Most India listed companies will operate in India and Indian economy’s nominal GDP growth is assumed to be between 7% to 10% (4-5% real + 3-5% inflation) in long term. If you are valuing export oriented company then take the GDP growth rate of the global economy (2-3% in long term) plus expected depreciation of INR against other strong currencies (around 3-4%).
I use a dividend growth factor such that terminal growth rate works out to be between 5 to 7% for export oriented companies and 6% to 9% for India focused companies. Based on my perception how much potential exists for disruption in the industry in which company operates, I choose a number within this range. If the industry is likely to be disrupted then I use a higher dividend growth factor which will result in lower terminal growth rate. I also use peer analysis (explained later) to select this number. A trial and error technique is used to select an optimum factor.
This input also controls payout ratio in mature phase. Typically mature companies pay out between 40 to 60% of their profits. This will also act a consistency check while determining dividend growth factor.
-
**1. Return on Equity –** This is the profitability of the company during the mature phase. Most companies with little moat earn ROE close to their cost of equity capital (which is the discount rate, explained later). Companies with moats earn far higher return than cost of equity capital. If a company is expected to grow for several years and earn a good ROE over this period, it is conservative to assume that is has some moat which will diminish over time but some moat will remain which will allow the company to earn ROE in excess of cost of capital.
Typically, I use an ROE that is about 2 to 3% higher than cost of capital for companies with low current moat and a value of 5-6% higher than cost of capital for companies with high current moats. If a company’s current ROE is far higher than its current cost of capital and it is because of some kind of moat which is expected to sustain over long periods of time then a higher ROE is justified. Typically I use between 12% to 18%. **2. Equity Risk Premium.(ERP) –** This is the additional rate of return over and above risk free rate investors demand to own risky assets like stocks. ERP is highly volatile as it depends on market’s risk perception and that in-turn depends on general investor sentiments. Risk Premium is generally proportional to faith of investors in Corporate India and stock market. When high volatility or scandals shake investor confidence, ERP rises as investors take flight to safety. As our capital markets are expected to strengthen over long term, I assume equity risk premium will decline and will average about 6%. In comparison, ERP has averaged about 8% in last 10 years. **3. Risk Free Rate –** This is generally little above inflation rate. My assumption is inflation in India will average around 3-4% in long term to RFR will average around 5%. I use RBI reverse repo rate as the risk free rate. if this rate is unusually high or low, then adjust accordingly. Should be little higher than inflation rate. **4. Beta –** This is a measure of systemic risk in the company that cannot be diversified away. In addition to the general equity risk premium, investor (should) demand higher return for owning stocks of companies are riskier than average company (e,g, banks, capital goods). On the other than, investor demand lower return for owning companies that are safer than average company (e.g. FMCG, Pharma).
Beta reflects risk perception of investors. Over time beta tends to revert to 1. i.e. less risky companies tend to become risky while risky companies adopt changes that make them less risky. I assume that over time, a company’s risk profile will match that of the industry so long term beta of the company will be close to industry beta. I use 0.8 for safer industries like consumer staples, pharma, IT and 1.2 for risky industries like Financials, Capital Goods, etc. Beta of Market is 1. **5. Discount rate–** Model calculates the discount rate using CAPM formula (RFR + Beta * ERP).but it can be overridden (with caution). during periods of complacency investors typically require lower discount rates resulting in higher valuations. Discount rates typically drop during bull markets and spike during bear markets.
Residual Income Model (RIM)–
Too often, DCF is criticized for its large terminal value. Depending on how many years you project into the future, terminal value can be anywhere from 50% to 90% of present value. Since terminal value is several years away, such high dependence on terminal value makes whole DCF model less reliable (and that’s why a lot of thought process has gone into this model to determine terminal value parameters).
An alternate model called Residual Income Model is designed to address issue with high terminal value. In this model, residual income is defined as the value added by a company when it earns ROE higher than its cost of equity capital. Present value of company is calculated by adding present value of future residual income and current book value. This model puts a greater emphasis on current book value instead on terminal value. Terminal value in this model is typically no more than 15% to 25% of present value. this is suitable for newer and smaller companies whose book value is close to their liquidation value and company has yet established a moat.
Another way of looking at RIM is that it values companies purely based on its liquidation value without much moat. This is correct for small companies that do not have much moat or whose moat is not well established. RIM almost always gives a lower valuation than DDM. I normally interpret difference between RIM and DDM value as the value of the moat. If DDM value is significantly higher than RIM value (more than 150%) then investors are paying a huge premium for moat. One needs to verify if the company indeed has a long-term sustainable moat.
Capital Asset Pricing Model (CAPM) –
Both DDM and RIM use the three-phase approach over which a fast growing company enters a slowdown phase and eventually becomes a mature company. A company can take anywhere from 5 to 20 years (or more) to go from growth to mature phase. Most investors do not own companies that long. Most active investors plan on investing in a company while it is growing at a high rate and exit as it enters slowdown phase. Such investors do not give much importance to a model that projects growth rates over long periods of time.
Spreadsheet uses CAPM to estimate intrinsic value based on projected growth rates over high growth period and then uses price multiples (which are interpolated from DDM model) to calculate terminal value. DDM in comparison uses Gordon Growth Model to determine terminal value.
CAPM value is more sensitive to near term growth rates and discount rates. I use DDM value as a lower bound of valuation range and CAPM value as the higher bound of the valuation range. During bear markets, I use RIM value as the lower bound of the valuation range instead of DDM value.
Adjustments to past financials.
Model uses latest year financial data to project future ratios and numbers. Occasionally, it makes sense to adjust past data so that projected financial ratios reflect estimates of growth and ROE numbers derived from fundamental analysis of the company. In the attached spreadsheet, ROE for FY2016-17 is adjusted downwards as company (Yes Bank is used as an illustration) has raised additional capital at the end of financial year which will lower ROE in the next 2 to 3 years as it will take time for this additional capital to start adding to the bottom line.
Companies that pay no dividends cannot be valued using this model and companies that pay only a token dividends will be overvalued. For such companies I normally set a hypothetical dividend such that payout ratio is about 10%. For companies without high growth opportunities I use a higher payout such that sustainable growth rate is close to achievable growth rate. growth rate of average company should be close to nominal GDP growth rate.
How to check if inputs are internally consistent?
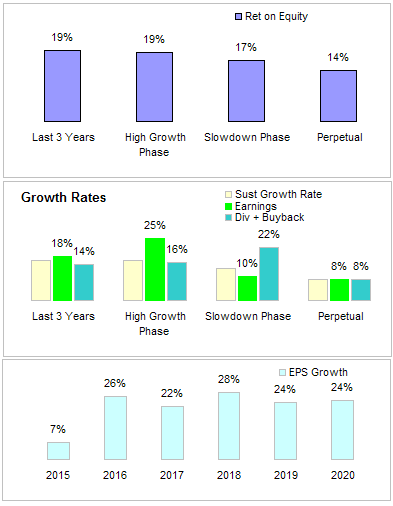
Valuation spreadsheet has few charts that show averages for past as well as projected ROE and growth rates.
Some key points to check.
- Company’s profitability should drop as the company moves from high growth phase to mature phase.
- company’s growth rate in the high growth rate should be close to its sustainable growth rate. this rate can be higher if company is raising additional capital and/or its ROE is expected to rise over this phase.
- Growth rate of dividend should be close to its sustainable growth rate or earnings growth rate. company’s have their own dividend policies so this rate should be consistent with the policy.
- during slowdown phase, dividend growth rate should rise and sustainable growth rate should drop and earnings growth rate should average lower than sustainable growth rate.
- During mature phase, all the growth rates are equal and typically a few % points lower than nominal GDP growth rate.
- Discount rate during mature phase should be close to discount rate for the market (beta close to 1) as mature company’s risk profile is close to risk profile of the entire market. Terminal Discount rate should be between 3% to 8% higher than terminal growth rate. The difference is the capitalization rate. Lower capitalization rate is used for companies with high moats and higher capitalization should be used for companies with low moats.
- ROE in perpetual phase should be close to discount rate. The difference between the two reflects perpetual moat of the company. companies with durable moats will have ROE much higher than discount rate.
Checklist
Investors tend to stretch inputs to DCF model to justify current stock price or target price. To check if current inputs are stretched, a checklist is included in the model, which will flash an input parameter as too optimistic, or too pessimistic based a pre-determined range for that input parameter.
Peer Comparison.
One of the factors that make price multiples such a popular valuation technique is that is uses peer comparison effectively. DCF on the other hand is an absolute valuation model. I generally value companies in a peer group together so that growth rates and profitability projections (especially during perpetual phase) of companies in a peer group should be close to each other and reflect their current differences in fundamental characteristics.e.g. risk parameters of Yes Bank are higher than HDFC Bank but growth assumptions of HDFC Bank are lower (due to its large size). similar numbers for SBI are much lower.
Iterative Approach
I also use an iterative approach to valuation. i.e. I start with largest company in the industry and then move on to small companies. for large companies, efficient market hypothesis holds true much of time. i.e. market value is close fair value. By using the model in reverse direction, (i.e. setting profitability, growth and risk parameters such that intrinsic value is close to current market price), user can get a sense of future projections priced into the current price. These numbers can then be used as a starting point to value other smaller companies in the same industry. Few iterations later, you can get valuation parameters that are consistent with fundamental characteristics of the companies in the industry.
Reverse DCF or What growth is already priced in the current price?
Based on my interaction with several investors, I have noticed that many investors are good at spotting companies that are good businesses but these may not be good investments as much of the goodness is already priced in the current stock price. In an efficient market, current stock price reflects consensus estimates of future growth, profitability and risk profile of a business. Unless your projections are different than consensus, a good business may not be a good investment.
By setting input parameters (especially for the high growth phase) such that resulting intrinsic value matches current market price, the model can be used to get a sense of what expectations are already priced in.