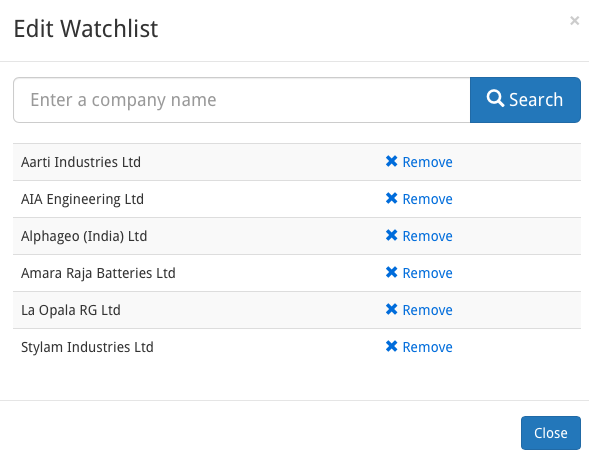
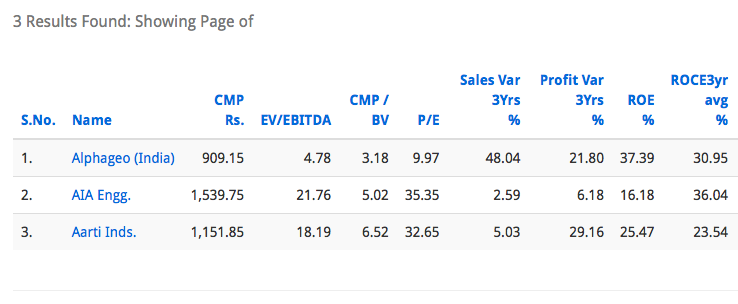
Hi. I have an observation: some stocks added to the watchlist dont reflect later in the watchlist data. E.g. try as I might, I cannot get stocks like La Opala, Stylam, Amara Raja to show. Any ideas?
Hi There,
Is there a reason why the P/FCF metric is using the Net cashflow instead of the FCF? I was trying to compare the P/FCF between Screener and Morningstar and here we have used the Net cash flow.
How to use Industry PE and Historical PE variables in screener.in every time I am running a query it is giving null result. Say
Price to Earnings < Industry PE
I can see Upcoming Results section in my default login screen for my tracking stocks. But I do see for few days (may be week or two ?). Is there a screen where I can see upcoming results for all my tracking stocks where the result date is announced and captured by screener ? Even better, is there a screen in screener.in I can see a result calender for those scrips were result date is already known whether I can tracking them or not ?
I do not have all stocks I am interested in results in my watch list to reduce other alerts. But I like to track results for more stocks and that oo not very frequently, hence the question
Now if screener.in do not have way to see such information much ahead, which other site has a handy upcoming results tool which lists 3K+ scrips traded in NSE/BSE ? Needless to say that I am looking for free websites which do not charge for it (for a limited results or all results)
Thank you. This serves the purpose. I am trying to escape from moneycontrol as it diverts my attention multiple times. In summary, screener , “view upcoming results calender” can be a feature link like “Browse all screens”, “Show more” for news feeds.
The 52 week high low prices are not coming correctly in Screener.
for eg. (this is just one example, happening for many stocks)
Jubilant Life Sciences Ltd
Current Price: ₹ 1,007.40
52 Week High/Low: ₹ 999.00 / ₹ 600.00
Screener.in is a fabulous utility for small investors without access to power tools that the big research houses have. It also another use case that is not commonly known or utilised. That of shortening the time needed to analyze any given stock by customising the excel download.
When I started analyzing stocks, I found to took an inordinate amount of time and effort in just collating basic information i.e trends in growth, profitability, cash generation, debt etc. Only then could you even arrive at a first snapshot of whether it was worth a deep dive.
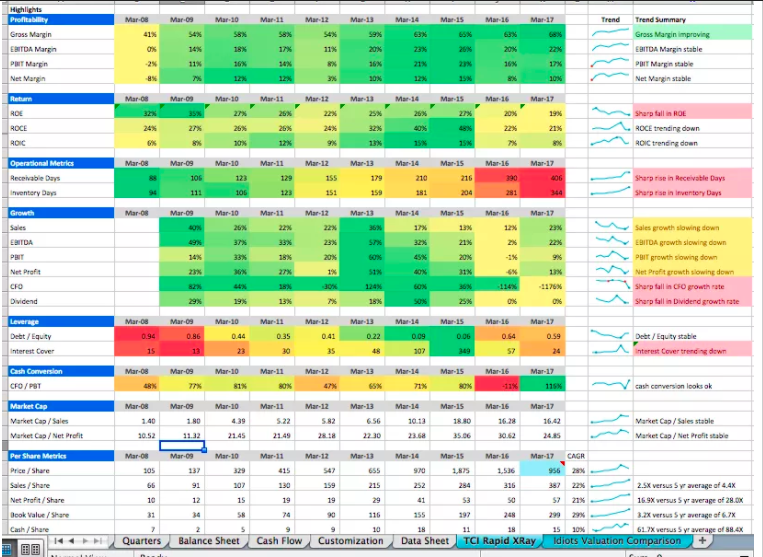
screener.in allows you to upload a customised excel that does the work for you. Here’s a snapshot of the customised sheet I added to my screener.in template with formulae and graphs.
Sirji I have downloaded the latest version and uploaded the data to screener and then tried to download excel sheet for another company. But error appears. Forbidden 505. Pls guide
I am trying to find companies where the net profit in the last quater (Dec Qtr) > net profit in Sept quater * 1.5 > net profit in June quater * 1.2 and Net profit is > 0
While running the below query
Net profit > Net Profit latest quarter *1.5 > Net profit 2quarters back 1.2 AND
Net profit > 1
I am getting incorrect results. Am i using incorrect variables? Appreciate your help and thanks in advance