
Are a majority of other users also facing the price update problem? Prices haven’t been updated for a few days now, don’t know about the company news.
Price updates problem has been resolved. News feed also getting updated now.
1 Like
Wondering how is “Though the company is reporting regular profits, it is not paying out tax” computed ? Does it check if Tax > x times PBT ? ex - Veto Switchgears.
1 Like
There is some problem with other income data for companies for TTM. Sometimes it gets added to Operating income and sometimes it doesn’t. Initially I was using the EVEBITDA ratio but then figured that sometimes other income was added to operating income in case of some companies used to give an incorrect EVEBITDA ratio. So I made a new ratio for my use correcting the same and making the denominator as “Operating Income - Other Income”. But in some cases the other income is not added in operating income. In those cases the ratio doesn’t give the current result.
Also there is no ratio to reflect profit before tax TTM, present values are of profit before tax last year and profit before tax preceding year. I also can’t make a new ratio for this due to the other income issue highlighted above. Please resolve. Thank you!
@ayushmit @pratyushmittal Goes without saying we all love screener.in. I am sure you hear it all the time. Add one more voice to the thousands thanking you.
I just wanted to check if you guys think would it be relevant / useful if we could also build a portfolio manager that can track investments and returns. I think it would make some sense. Best.
1 Like
Earlier Screener used to show upcoming result dates for companies in your watch list. Its not showing that anymore. Is that some issue or feature is removed from screener.
1 Like
Hello Donald Sir,
First of all I am sorry for the delayed response,I was busy with my training responsibilities.I went through the excel sheet and have suggested a few changes.Kindly,have a look. Following are the comments in column A of calculated data sheet:
- EBIT: I think we should subtract other income,as it is not related to core operating activity and hence would give a clearer picture.
- Invested Capital: I think CWIP should not be a part of IC,as it has not gone into production.
- ROIC: I think we can have Pre & post tax ROIC. Pre tax ROIC helps in making apple to apple comparison with other investment avenues.
- WACC: I think this is perfect,as discounting factor is the opportunity cost and with valuepickr’s ability 12% opportunity cost is fine.
- May be we can rename it to Real wealth created.Gives a better understanding.
6.Row 30:I think we should have valuation metrics in a different sheet.Thinking about valuation while analyzing creates a lot of biases.
7.I think Net working capital to Invested capital is a complete ratio.
8.I think we can have invested capital instead of Total assets.
9.This can be converted to ROCE,by putting capital employed as denominator instead of Total asset.
10.I think we can have three ratios instead of this.Invested capital turnover.Fixed asset turnover and Net working capital turnover.This was we will be able to pin point what is the source of a superior or inferior invested capital turnover.
Few Suggestions:
- We can get back the working capital as a percentage of sale that we had in the last sheet as it gives a lot of insight into the working capital intensity of a business.
2.We can get back the cost analysis that we use to do.
3.Gross margin and operating margin should be added as these percentage figures give a clear picture about the things to focus in further analysis, when looked in combination with Invested capital turnover.
Warm Regards,
Shrey
Zenith Fibres.xlsm (88.0 KB)
Thanks a lot for the great website. I have been using valuepickr, & screener for a lot of time, but haven’t noticed this thread.
Off late, I am seeing the Volume as 9,99,99,999.00 .
If it is fine to reveal, may I know the data sources to get these data.
Thanks & Regards
Mukund
1 Like
I dont know whether this utility existed from before or whether i am just discovering it. Either ways - WOW! take one more bow - with all the bows you must have taken @ayushmit @pratyushmittal and all the others behind screener , you guys must have developed six packs by now.
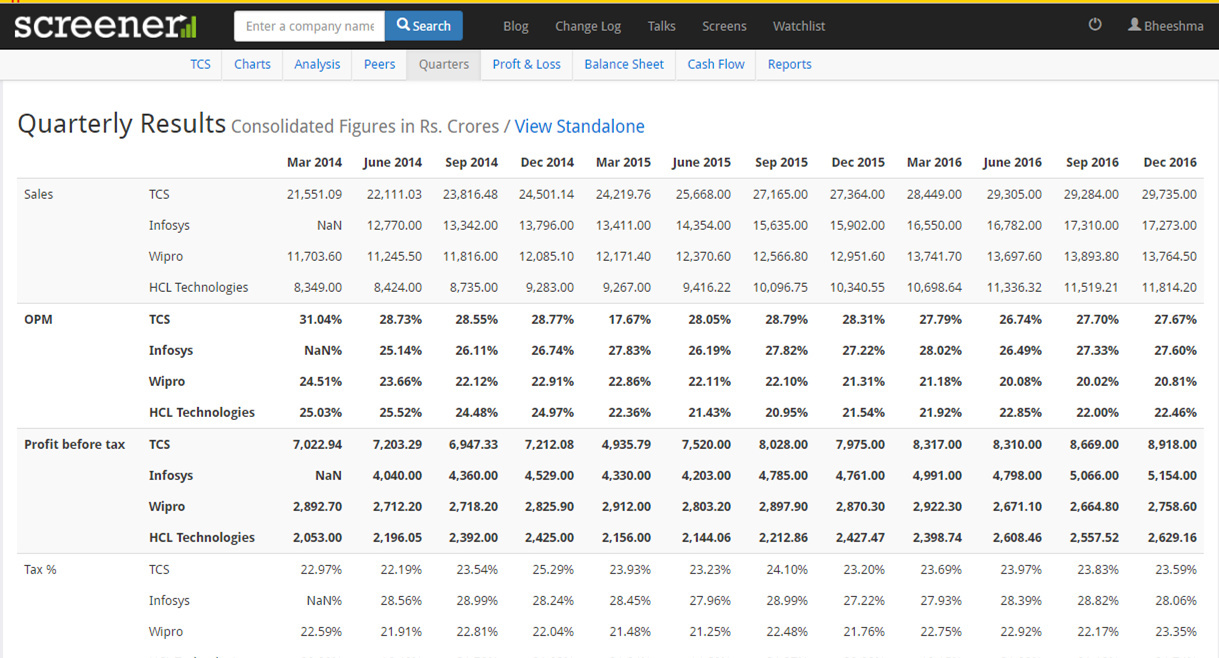
If you add company name for comparison, screener gives you a neat row wise comparison of the key numbers all in one screen! company wise. over time.
I did this for infy, tcs, hcl, wipro and i was blown away. The only thing screener cant do however and i must register my strong protest is print money. You guys must look into it. Its a major flaw ![]()
12 Likes
@Donald Is there a way to create a query on screener to find companies who grow their Book Value/networth continuously for last few years.I am unable to create one,since relevant variables are not available on the query builder.Only recent Book Value & Networth is available on the query builder,so finding it difficult to create the needed query.
1 Like

Folks, please continue to use. And let your fellow investors know.
Not many use the absolutely-delightful, thoughtfully added time-saving
"custom" functionality.
We can only do one thing - spread the word. spread the love with which
Pratyush/Ayush have created must-have toolkits for investors
4 Likes
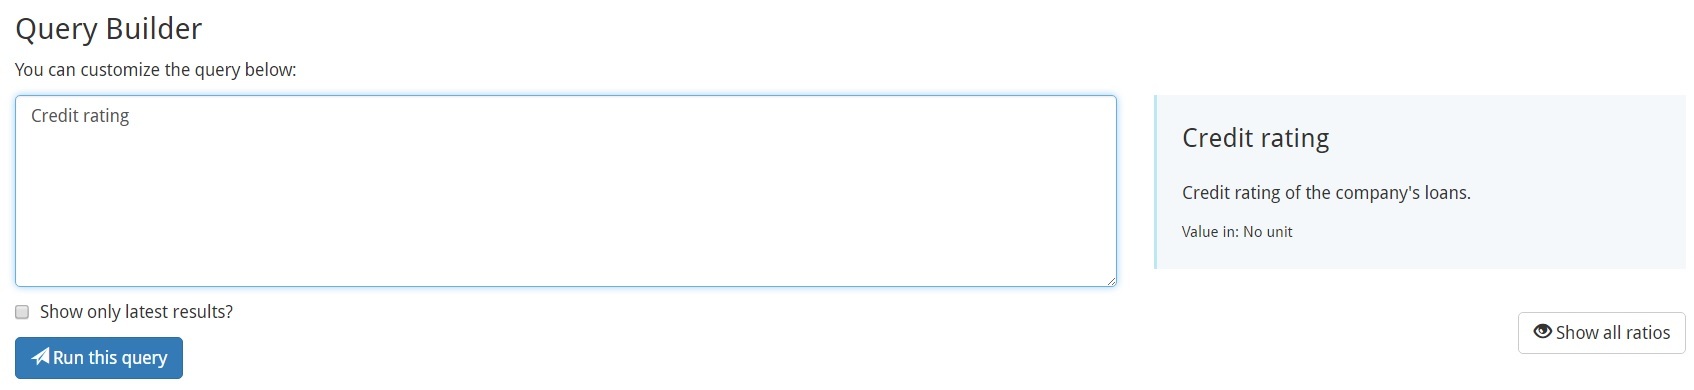
@ayushmit @pratyushmittal Thanks a lot for creating such a wonderful tool for Indian Investors. I would like to screen companies based on their credit ratings. Could you please help me how to use that feature for defining query?
Dear investors,
Is there a query/tool/website to get stocks in sorted order of returns between a given start date and end date ?
Many websites provide 1d/1w/1m/6m/1y returns. I need returns during specific time frame (say during DeMo).
1 Like
@csteja : Bajaar.me now has a screener that allows you to do exactly that. Click the Top Performers option from the list, and select a range of dates, and market-cap range.
How to find equity dilution trend in screener?
Use the export to excel feature. The exported sheet will have the equity trend for the last 10 yrs.
You can also customize your own sheet upload it and receive customized ratios for any company. Donald has shared his sheet in this thread. Thats as good as it gets.
1 Like
Many thanks @vml.
Is there a way to find Top performing sectors in a given time frame as well ?
It would be helpful if anyone can answer.
Hi ,
Does anyone know if there is a way we can add a condition in our queries to filter on a give sector.
So my query shoold return only companies from that sector.
Please let me know if anyone has tried that.
Hi Guys, Is there a way I can view the equation used for different ratios available in Screener.
2 Likes
The query fails to give meaningful results if any of the variable value is "–"
eg. Pledged percentage: –
so for example if you have a query like
Market Capitalization > 100000 AND
Pledged percentage < 10
Then infosys will not come into this. Although it should come.
Can screener people please correct it.
Or Is there any work around to solve this?