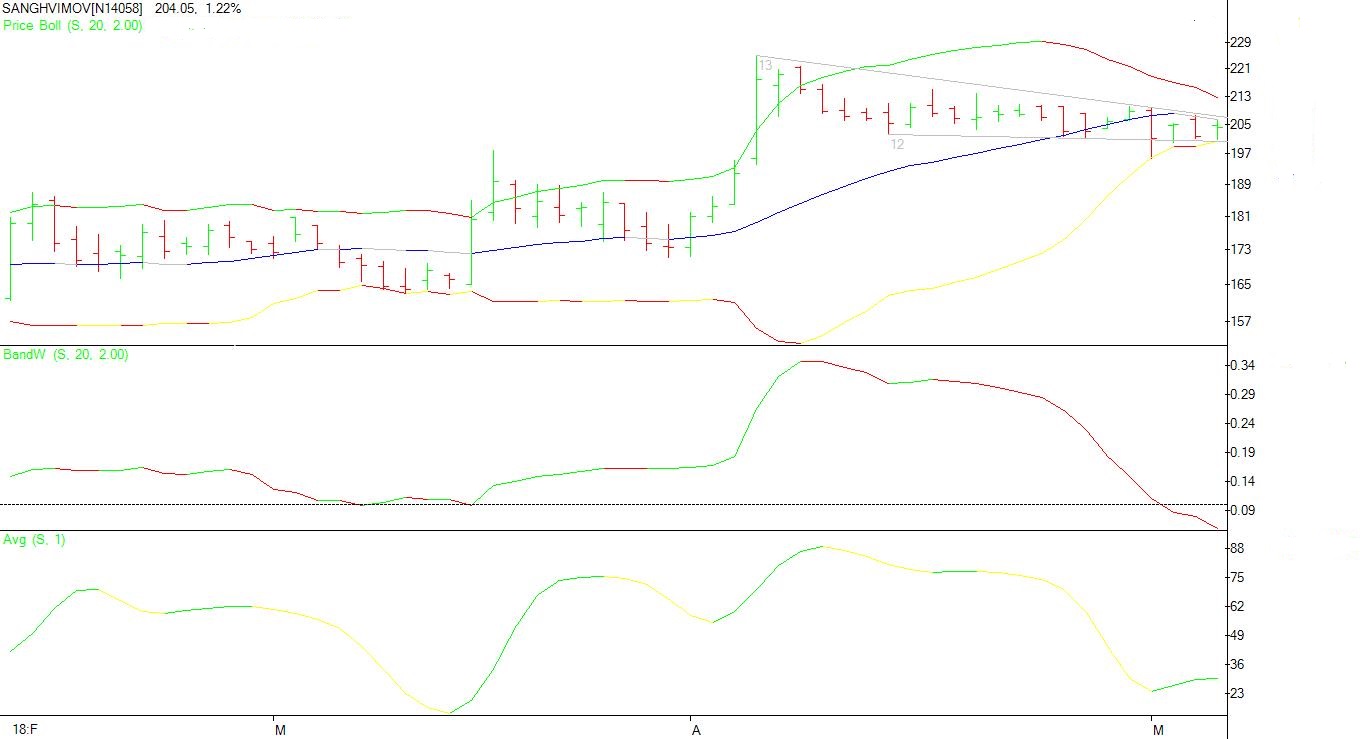
Daily chart of Sanghvi movers with Bollinger bands…the stock is now under volatility compression / band squeeze…further its also under pole and flag consolidation pattern…I am expecting a breakout in the next few days…it can be an upside breakout or it can also be a price breakdown…To be on the safe side, I recommend further buying only above 207 when the probability of upside breakout is quite high…
And if an upside breakout does happen, then do remember that the pole length is around 65…
Now with this data assuming Avg Crane cost 1.5% of total cost , then per MW potential revenue is Rs 10 lakhs .
Now Assuming annual tenders are around 5000 MW - giving Market Potential revenue for crane player at around - Rs 500 crores
For Sanghavi @ 60 % Mks the revenue at peak will be Rs 300 crores .
Assuming Wind sector gives 70% of Sanfhavi revenue . Max revenue possible is around 500 crores same as FY 2016 … which had EPS of 25 … Assuming for Cyclical company if I give peak earning multiple of 5 , Fair value is RS 125 … Right
Yeah that is @ top end , past 3 to 4 years – Tendering has been far lower than top end , plus we have elections - Added to this is concern on transmission side - lot of tender finalised are not seeing development becos of transmission not being place - Hence I have taken 5000 MW development and not order placed / tendering
If more than 5000 MW development ( not tenders / order placed) happens that is bonus …
On Multiple - SM has huge variation in EPS . If I give 10 PE on peak earning it will be like 100 + PE on bad year earning . I looked at another way too … It generated 400 crores FCF in last 10 years when wind was doing really well , ie Rs 40 crores per year … if I assume it will generate Rs 60 crores FCF in future and apply discount rate of 15% . that will give Fair market cap of Rs 400 crores - which is half of today’s market cap which again gives me price of around Rs 125 . Am I missing something ??
Guys…there is a very detailed report by Stalwart Advisors on sanghvi movers and also a detailed note after meeting the mngt of sanghvi movers and inox wind…due to valuepickr policy I cannot post that report but I can just say that even with very conservative estimates they expect a yearly profit of 165 crores for sanghvi movers…maybe even 250 crores whereas the present market cap of sanghvi is just 800 crores approx
You should also consider that the depreciation is actually very high whereas average life of crane is 20-25 years. Hence actual cash inflow would be more.
I have provided my assumption of fair price above -
Can you provide contra fact both on market potential and why OPMs will be higher than past bull market which will propel profits to greater than 250 crores … on sustainable basis …
I have one observation which might help SML achieve higher margins assuming there are no pricing pressures. In earlier years, wind was driven by smaller investors investing to avail Accelerated depreciation benefits. Typically these investors place orders very late towards the deadline of Sept. and March and want the projects to be commissioned by Sept or March so that they can avail AD in same year. Now following may have taken place in past -
(1). SML cranes would be underutilised in months of April - June and Oct-Dec
(2). Because large no. of wind mills would be installed in fewer months for Jan-March and July-sept, some orders would have gone to competition.
The current auctions because of huge volumes would require installation round the year in batches and would allow for higher utilisation and higher revenues for SML.
It will be good to understand this better from someone knowledgeable from wind industry or from SML
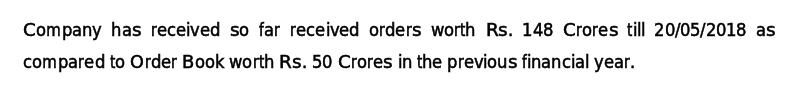
According to the q4fy18 results company has received orders worth 150 crores, this seems quite low to me given 7.5 gw is already auctioned. I think transmission bottlenecks are seriously effecting the sectors.
I also feel the same. I do not understand that even if with average Capacity Utilization of 65% in Q4 company posted losses. And They expect 70% Capacity Utilization in FY 19. then what would be the estimated profit/Loss?
Can anybody tell me what is “average blended yield”? and how is it calculated?
As per TD Power system, Inspite of tendering of over 5 to 8.5 GW, on ground execution is very slow . Most might come for execution post Sept if everything goes well.
But he also mentions a caveat that becos of Lok sabha election – lot of decisions might get delayed ie land acquisition , financial closure , transmission connection etc …
In this entire context TD power system was bullish on captive power system as merchant power rates have increased and new expansions in paper , cement , steel etc will go for power back up …
Also refer to my earlier calculation of Max possible TO of Sanghavi Movers from Wind power - Max possible order from current auction ( assuming 5GW ) will be around 300 crores … so current order 150 crores is pretty good …
The gross bloc as per market rate by the mgmt is 2150cr. A 65% CU means bloc worth 1397cr was delayed. A 2.15% monthly yield on 1397cr would be about 30cr. Thus qtrly 90cr.
This is a broad calculation.
Hope it helps…
Further to your qs, blended yield means the typically the return on asset employed. This number is generally market driven and my guess is tops 3%. its basically like your rate of interest earned on money deployed. The yields differ from types and tonnage of crane deployed to the user industry, etc. Hence average blended yield number eventually.
Hope this helps…
Thanks Parin. This helps a lot to me to estimate the next year revenue based on this calculation. Based on this calculation FY 2018-19 gross revenue can be between 389 cr to 416 cr considering 70% utilization for the year.
SECI over the past 15 months persists, given that the existing inter-state transmission infrastructure in the states with high wind potential may not be sufficient to provide connectivity to the 5.1 GW bid out by SECI so far. Further, the augmentation of transmission infrastructure would take about 24-36 months, whereas the winning developers must commission the wind power projects within 18 months from the date of issuance of letter of award/signing of PPAs (power purchase agreement), it added.