
Hi Mihir… The dividend yield number for all companies shown in ratestar seem to be erroneous. All other sites give the same number except for ratestar. Could be a bug. Pls look into it
Mihir, I absolutely loved the design. Even though I have been using screener.in for long (and loved it). This is a little more intuitive and easier to play with. One question - Haven’t you added ways to screen companies? This is good for looking information but what if I have to search all companies with, say, ROCE > 20? Also, I liked the rating system but could we have more information on how that rating was reached and maybe create a filter to search for companies with a specific rating?
Hi Mihir,
Can we see something which represents Economic Value Added (EVA) in your tool?
Thanks
I have just registered to this site. But I did not find option to screen stocks…please help…
Mihirji excellent initiative. keep it up. Let the value community gain from your venture. Truly hats off
My feedback for improving the website. The Dividend yield logic has some bugs as divident yield is always showing more than actual.
Hi,
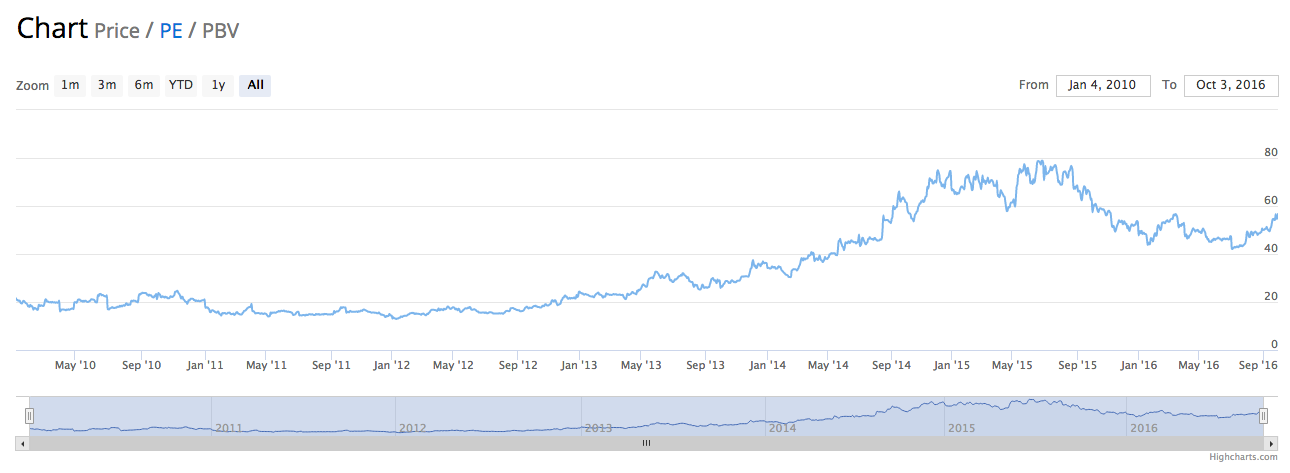
I like the PE movement across the years.
Thank you!
3 Likes
Do we get schedule breakup for financials in any web site? For e.g. break up other expenses (fees, taxes etc) . Rather than having grouped numbers of BS/PL.
MoneyControl has some breakup. Not sure if that level of granularity is enough for you.
http://www.moneycontrol.com/financials/3mindia/results/yearly/MI42
Thanks for response. You are right, but as you said granularity is not
enough e.g. break up of CL, other expenses etc.
What is the smartest way of copying the data from annual report to excel.
When I try some works, some doesnt work . Of course with normal copy paste
command.
Thanks in advance
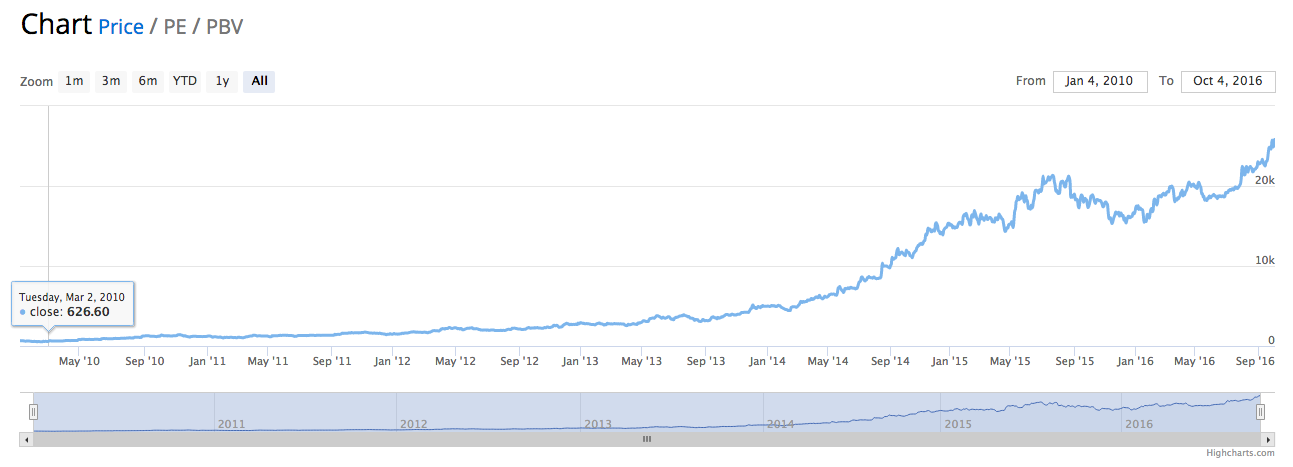
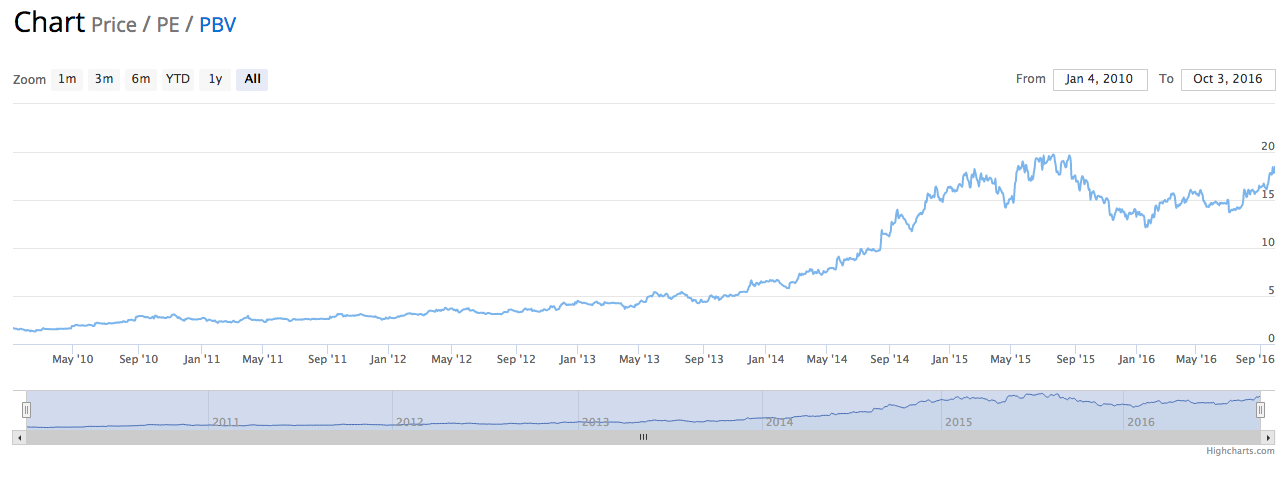
As many of you may have already noticed, we have added historical P/E & P/B ratios for all the companies ![]()
Attaching example of Eicher Motors’ charts here:
Since we have taken the initiative to make the best research tools available to everyone, we hope you’ll use this and notify our team of any bugs that may have inadvertently cropped in
6 Likes
Thanks for the feedback, regarding annual numbers, we’ll keep that in mind.
The charts show TTM ratios though…
Mihir is the PE chart adjusted for Bonus and Splits?
1 Like
Yes, charts are adjusted for bonus and splits
1 Like
Dear Mihir,
Hearty thanks for ur website.
Is it possible to view companies having rating above 65 or 75 or 85.
If not, can you please introduce such a feature.
Thanks,
Prasad.
It is easily possible. They are not doing it for some reasons known to
them…
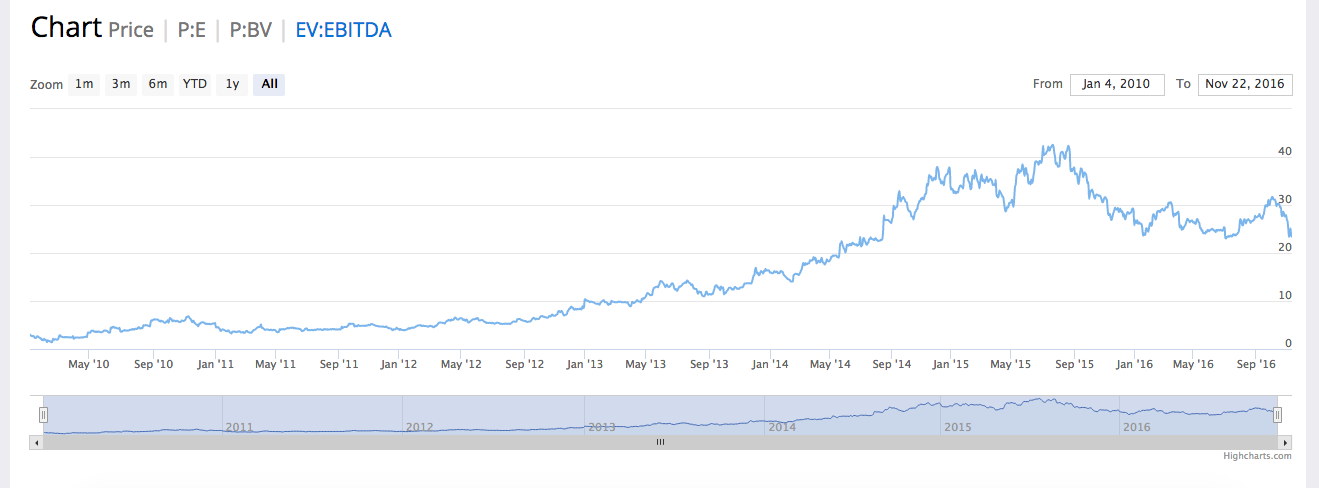
We have added EV/EBITDA chart as well for all companies on www.ratestar.in
Feedback can now also be sent directly through homepage ![]()
2 Likes
Many thanks. I find this feature very useful.
Can you add Price to Sales too? (market cap to revenue)
Thanks
Kumar
@m1hirk hey great stuff! everything is great except of course the export feature. The PE feature is very nifty great job