Any plans to add history of bonus, splits, rights and dividend? If so, how soon can we expect them?
Everything seems to be good and fast to load. Really appreciate your effort.
Any plans to add history of bonus, splits, rights and dividend? If so, how soon can we expect them?
Everything seems to be good and fast to load. Really appreciate your effort.
Quite a few stocks where the P/E is showing incorrect !
@sunilsurana @sumit_tumba The bug has been fixed. Please check.
@ekveer Thanks for the suggestion. Will consider it.
Great tool Mihir!! Request if we can add a couple of more features: -
Thanks
Was checking Pokarna, still not showing correct PE.
@m1hirk
Please check Kellton Tech
http://www.ratestar.in/company/Kellton-Tech-Solutions-Ltd-119602
The link is leading to some other company http://www.vmfsoft.com/ site
Mihir Khajanchi
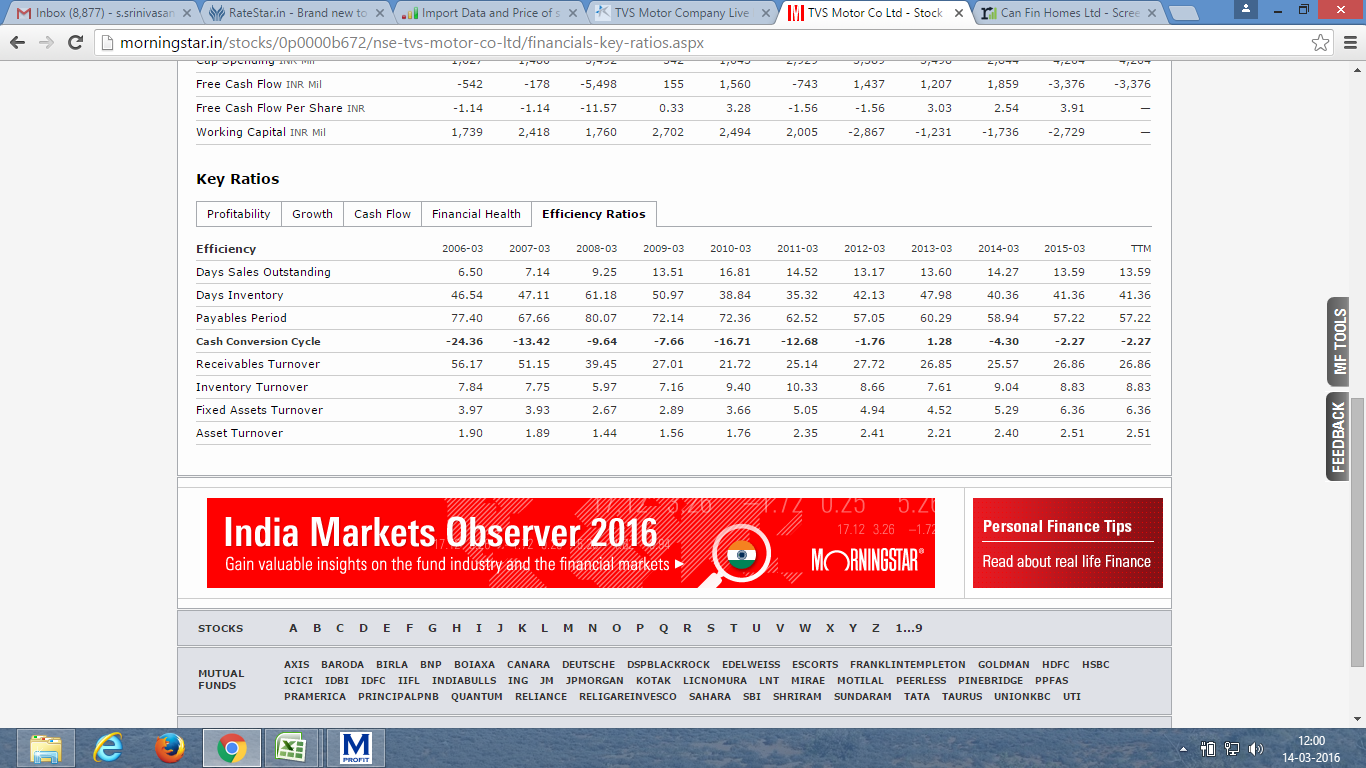
Why there is a difference in " cash conversion cycle " between Morning star and Ratestar ?
Did you find any case where our data is wrong?
That is because Kellton is the rebranded VMFSoft and the website address is not updated here.
Just checked, there are no errors in our data which we could identify.
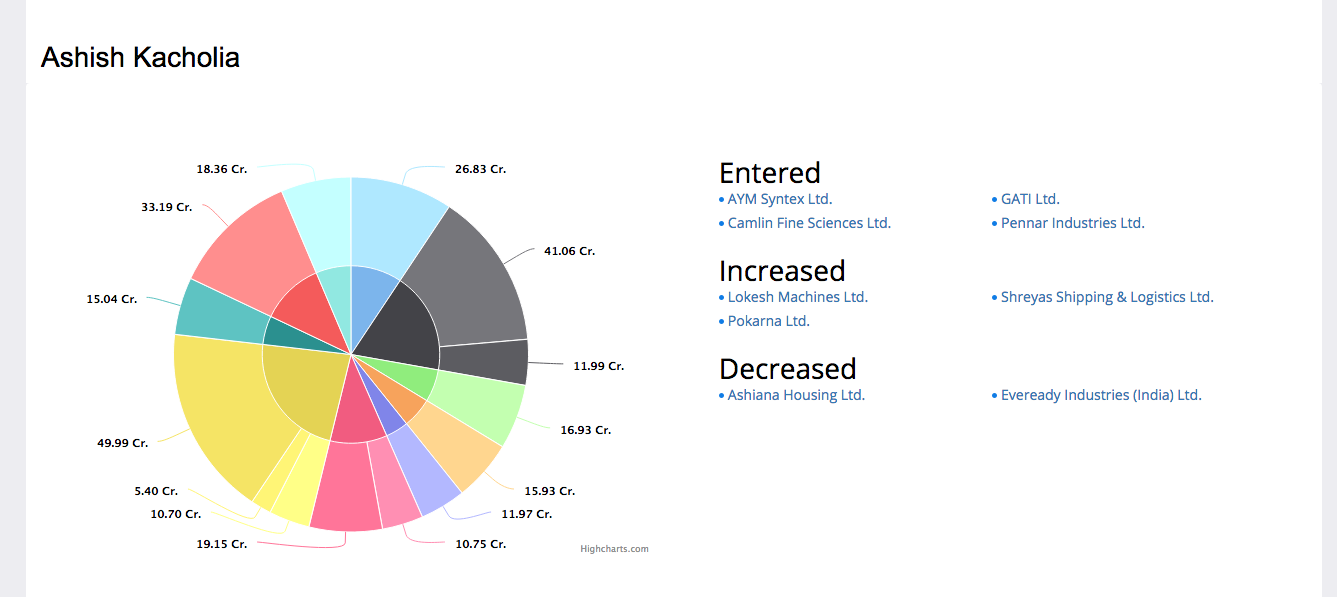
We have added a new feature to identify top holdings of investors and their overall portfolios. Beta mode, feedback welcome ![]()
www.ratestar.in
Hi Mihir,
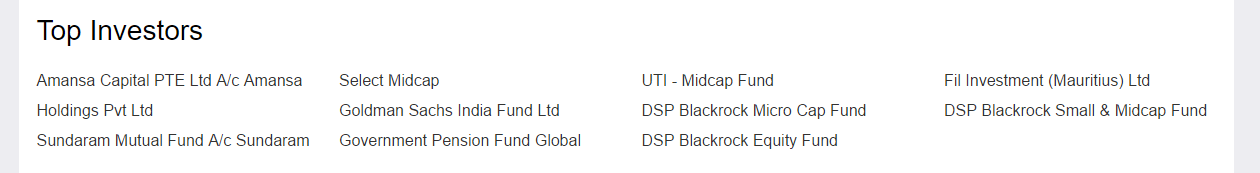
One Feature Request - In the Stocks Page, Top Investors are listed down.
Would it be possible to also convert this into a pie chart as % of Shareholding in that Stock. (just like that for the Investors shareholding in stocks).
Thanks,
Manish
Hi Mihir
Rate star has a star rating system as well as rating to a scale of 1 to 99.
how can we find stocks scoring more than 70 ?
Hi Mihir. I agree with the previous comment. Pls provide a filter to list stocks which have a rating of over XX. And that XX should be user specified.
HI Mihir,
Will it be possible to add detailed line items for “Cash from Financing Activities”? (like Net Debt Repaid, Net Debt Repaid, etc.)
Thanks for the webapp, it is of great use but i still feel comfortable using it in conjunction with screener.in which allows me to query and create my own parameters for the list. (not complaining since i like tools that give specific capabilities)
one suggestion i would like to make is that is it possible to show or generate graph for any field in the page ? ( i understand that this is vauge but let me run you through an example)
i was looking at PAT growth for a few companies and my concerns were
screener.in shows growth current year, 3, 7 & 10 yrs
what i observed in ratestar is that some companies have very good year followed by a bad year
The problem with compounded results as shown in screener is that the bad year gets hidden and anyone might miss noticing it. the problem (at least to me) in ratestar is that it is burried in huge amount of data. it is a good pattern that should be easily visible in a graph and will help point us in digging further.
i asked for graph view of any field since stock analysis is a collection of continuing data and any one else might prefer the same graph view of some other parameter. another example being that shareholding pattern would be better in graph to easily see how the ownership is trending/changing.
hope this was constructive.
(edit: formatting for bullets, first post problems  )
)
Also, it is not possible to understand how the rating is given to stocks. Some stocks which are a strict avoid in conventional analysis seem to be scoring more than 70/99. May be they seem to have some data which common investors do not have. If ratestar can be transparent on the rationale for their ratings, it would help a lot…
Please try our Android app: https://play.google.com/store/apps/details?id=opulent.ratestar
While this is the first version, we aim to keep updating this regularly with app specific changes. Please let us know the feedback.
@rtsivakumar @rvetri We are working on new features on ratestar and we would keep in mind the feedback while incorporating them.