Numbers and Narratives: A Simple Discounted Cash Flow (DCF) Model for Equity Valuation

I have created a Discounted Cash Flow Excel Model for Valuation of Common Stock. A Stock’s value is nothing but the story behind the stock and the numbers that keep the story grounded in reality. Hence, I have named the model ‘Numbers and Narratives’. The name is also inspired by one of my all-time favorite YouTube videos by Prof. Aswath Damodaran.

In fact, the model itself is a spin-off of a larger, more complex Valuation model created by the Professor himself. Do visit his website to access more Valuation tools, videos and learning material. They’re invaluable!

Before jumping into the model, let me quickly quote Prof. Aswath Damodaran on a timeless Valuation wisdom from his book ‘The Little Book of Valuation: How to Value a Company, Pick a Stock and Profit’:

“The value of a firm is a function of three variables—its capacity to generate cash flows, its expected growth in these cash flows, and the uncertainty associated with these cash flows.”

Keeping that in mind, here is the Google Sheets link to the updated model (You can download it from File->Download As->Microsoft Excel):

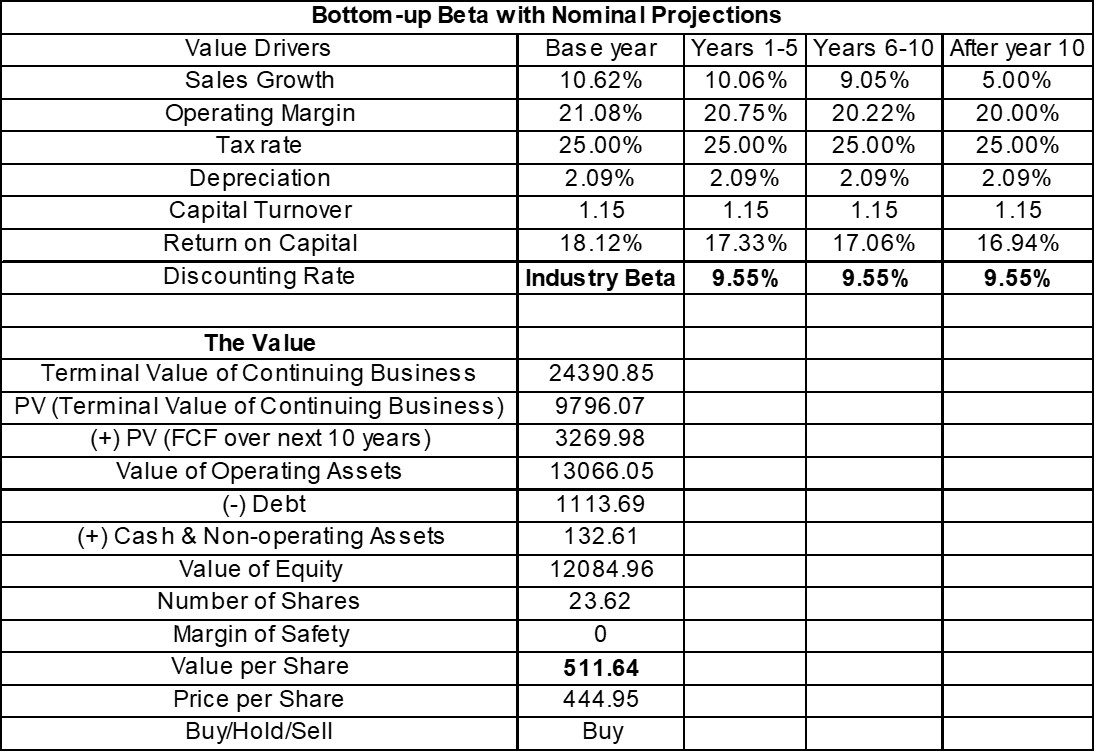
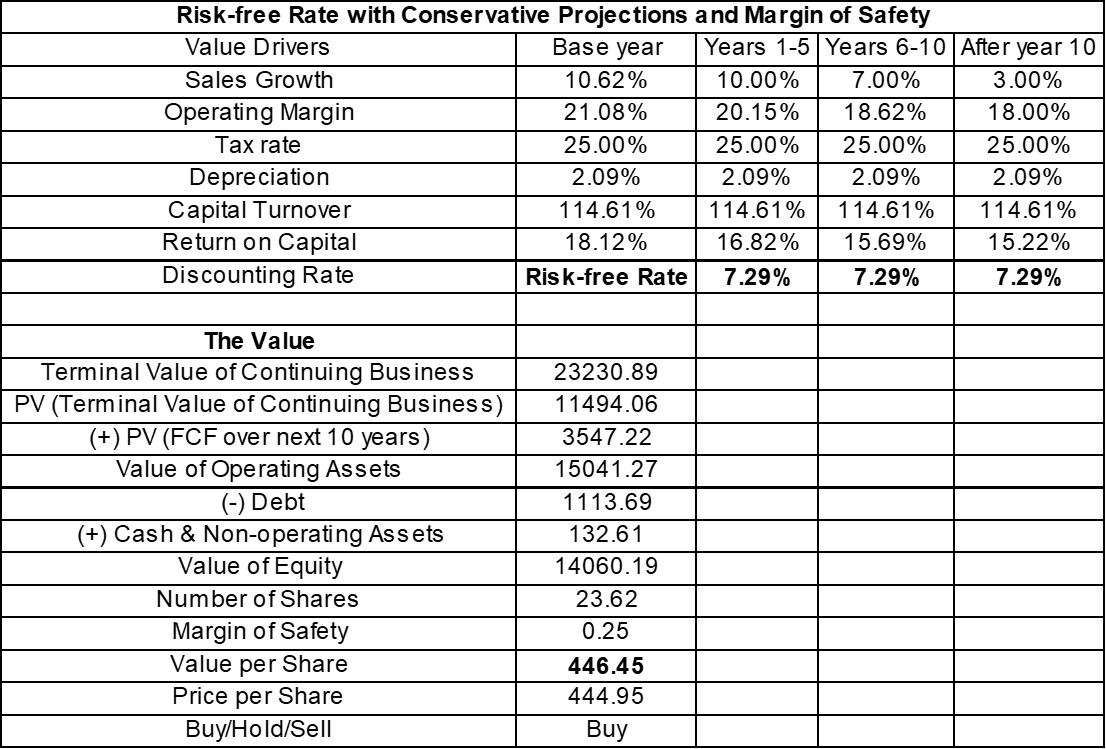
The example Valuation given in the sheet is of KRBL (Note: The example Valuation done on KRBL is not accurate to-the-penny. It is for representation purposes only). The Excel will also show circular referencing errors when you open it for the first time. Please ignore it. If you have iterative calculations turned off, turn it on from the ‘Formulas’ section of your Excel.

Using the Model

The model is pretty much self-explanatory and easy to use (This is the major aim of this model). If you’d still like a hands-on explanation on how to use the model, take some time out and read my blog post. It’s a step-by-step guide on the input methodology and other intricacies of the model:

https://valuationinmotion.blogspot.in/2018/04/numbers-and-narratives-simple-dcf-model.html

It’s a fairly simple DCF model, which allows you to anchor your transaction Price to a company’s Intrinsic Value rather than dubious anchors like the P/E, P/B or EV/EBITDA. Quick-fix Valuations like the Multiples Valuation appeal to your emotional mind. However, by allowing you to enter your narratives and reasoning regarding the company and its numbers, the model appeals to your logical mind instead. A logical mind is one of the most important edges of the rational investor.

Disclaimer: This model cannot be used to value BFSI firms. In fact, BFSI firms are like the twilight zone for Valuations in general. Theoretically, it is possible to Value a BFSI firm using a DCF, if you carefully audit every P&L item and Balance Sheet item and arrive at the proper Free Cash Flows. But that will take way too much of time for it to make sense as a regular Valuation tool. Some say the Dividend Discount Model (Courtsey @Yogesh_s ji) could be used as an easier fix for Valuing a BFSI firm, but that’s also not very accurate. Unfortunately, that’s as close as we can get to logically Valuing a BFSI firm. This is owing to their all-cash and extremely leveraged nature of business.

On a lighter note:

strip_

If you have any doubts, concerns, improvements regarding the model, feel free to post in this thread and let me know. You can also DM me or write to dineshssairam@gmail.com instead. This thread can also be used for general discussion on Valuation, specifically the DCF model.

Happy Valuation!

29 Likes

Thanks for sharing this Dinesh - really helpful. Prof Damodaran is a star :slight_smile:

1 Like

@dineshssairam can you share the source of each input in your KRBL valuation? For example - I tried to match debt figure from the balance sheet, but it did not match currently. So if there are say 10 inputs to the model, if you can specify the exact source of each of these, it will be great. (So if you have taken sales as TTM, then link to the last 4 quarter P&Ls. If it is industry beta, then where exactly you have picked it up from - link to that website).
This info will really help in applying the model to other stocks accurately.

Thanks

I should have probably mentioned that. The model for KRBL is not accurate (It was impromptu). But I’ll edit the first post and mention what goes where for each entry item in the model.

Hi Dinesh…Does this can we upload on Screener…Will it pick auto data…If not could you make assist us to get that one…Thanks for Your hard work…

Probably. But Screener has very generalized data. One needs to go through the Notes to Financial Statements to understand the different headings and fill out the model accordingly.

Hi Dinesh, Thanks for the model, was trying to check what a good price with margin of safety would be for KRBL. However when you look back there were two years in the past five, when the free cash flow was negative and sort of free cash flow growth does not seem to be linear. This i think is due to inventory build up and working capital getting tied up. Quite a lot of value comes from the terminal value, which is very difficult to read. Was reading Pabrais book and he was suggesting that it is very difficult to predict the life of firms and it is better to take 15 times cash flow as the terminal value at the end of the tenth year.
My own take is that this is a difficult company to value using dcf. Can you just try Mahanagar Gas using this model as it has better predictability if you have the time.

1 Like

What you’re saying is true. No company’s Cash Flows are linear. But what we’re trying to do is, instead of predicting every single year’s Cash Flows, we come up with what Prof. Aswath Damodaran calls ‘The Valuation Trifecta’:

  1. Growth (Revenue Growth, including Operating Margins)
  2. Reinvestment (CapEx, Growth cannot come without CapEx under normal circumstances)
  3. Risk (Captured by the Discounting Rate)

Of course, if you think the Cash Flows will behave in a specific way, you ought to adjust for these measures in your model. A company making a negative OCF is not necessarily bad (Unless ofcourse it’s regular). If you check in the years when KRBL made a negative OCF, there would be a positive ICF.

If a company makes ₹100 OCF and ₹50 ICF (Reinvestment), its FCF would be ₹50. If a company makes -₹25 OCF and ₹75 ICF (Sales of Assets), it’s FCF would still be ₹50. Of course, this is not sustainable. We shouldn’t ignore this if it’s a regular occurance. But one off cases are excusable. It’s part of the business.

In the end, regardless what a company’s Growth, Margins, Reinvestment or Risk is, all we’re worried about is how much FCF the company generates. Maximizing FCF maximizes value to the Shareholders.

4 Likes

Can you please provide a PDF link to the Financial Statements you were looking at? I’ll be happy to make a step-by-step post on the entries in the model.

Thank you.

Discount rate taken by you in your calculation takes valuation to higher side. Why not we take 10% or 12% which can be opportunity cost or minimum expected return from investment. If we consider 10% then the stock becomes expensive.

Are we not very optimistic about the stock considering the fact that we are taking 5% as terminal growth rate, low discounting rate and 0% Margin of safety.

My queries may sound idiotic. I am learning from such discussions.

Hi,

In order to answer this, we need to understand the three different school of thoughts regarding Discounting Rates for stocks (Or ‘Capital Assets’ in general). And since you asked a question specific to KRBL, I am going to provide examples from that specific valuation. Of course, I have an anchoring bias because I already know the Value of the stock. But if you want to Value it yourself, you are most welcome to download the model above and try for yourself.

The first and the most famous one use by Analysts is of course, the Capital Asset Pricing Model. Without going into the technical details, the CAPM formula basically throws a higher discount rate for stocks with a higher volatility. This school of thought argues that a higher volatility is a chance that you will not achieve your required rate of return and hence, you should try to discount the cash flows at a higher rate, thus reducing the purchasing price. As mentioned above, most Research Analysts follow this method. But of late, this is being dismissed as a very poor indicator of actual risk in a Stock. In our case, it would look like:

A second version of the same CAPM is the BBCAPM, or the Bottom-up Beta CAPM. It uses the same formula as the CAPM, but replaces the ‘Beta’ with something called as the ‘Bottom-up Beta’. Again, ignoring technical details, the BBCAPM still throws a higher discount rate for stocks with higher volatility, but adjusts for Financial Leverage aka Debt. Let’s say Company A and B both have a Beta of 1.20. Under the normal CAPM, both of them would have the same discount rate. Under BBCAPM, the company with the lower D/E Ratio will have a slightly/heavily lower discounting rate. However, instead of just comparing 2 companies, the BBCAPM would require an input of the Industry’s Beta as a whole (Or the average Beta of companies in the industry) and then it works backwards to find the Bottom-up Beta. Prof. Aswath Damodaran follows this method religiously and many Research Analysts have also started following this. In our case:

The final school of thought comes from the age of Ben Graham, Warren Buffet’s mentor. Ben Graham saw Stocks and Bonds as very similar instruments. The major difference being, you’d know when a Bond matures and what exactly are its cash flows. With a stock, you don’t know that. So he concluded that by projecting the Cash Flows conservatively and using the Risk-free Rate to discount the cash flows (As one would do with a Bond), one could end up with a fairly accurate Value for a Stock. But of course, Mr. Graham also had one more card up his sleeve - the Margin of Safety. By undercutting the Value of a stock by a hefty percentage (>25%), the investor provides himself Capital Protection, as well as a safety cushion in case his estimates have been wrong. Warren Buffet and Charlie Munger follow this very same method for each of their investments (Often adjusting for a few basis points when interest rates are unnaturally low). Several other famous investors such as Prof. Sanjay Bakshi, Prem Watsa, Monish Pabrai, Raamdeo Agarwal have indicated that they use a variant of this method. However, the original creator of this model, Prof, Aswath Damodaran warns against using the Risk-free Rate. But then, he also warns against the use of Margin of Safety (Terming it as a poor substitute for doing a good valuation) For KRBL:

In the end, I would tell you the way I imagine it within myself: discounting rates should depend upon how comfortable you are with your own projections. The higher the comfort level, the more your discounting rate should move towards the Risk-free Rate (It cannot be lesser, of course). They should not depend on anything else, especially not random rates like 10% or 15%.

6 Likes

Thank you so much.

Below conclusion was more helpful.

Quoting Warren Buffet on the topic:

"When we look at the future of businesses we look at riskiness as being sort of a go/no-go valve. In other words, if we think that we simply don’t know what’s going to happen in the future, that doesn’t mean it’s risky for everyone.

It means we don’t know – that it’s risky for us. It may not be risky for someone else who understands the business.However, in that case, we just give up. We don’t try to predict those things. We don’t say, “Well, we don’t know what’s going to happen.” Therefore, we’ll discount some cash flows that we don’t even know at 9% instead of 7%. That is not our way to approach it.

Once it passes a threshold test of being something about which we feel quite certain we tend to apply the same discount factor to everything. And we try to only buy businesses about which we’re quite certain.As for the capital asset pricing model type reasoning with its different rates of risk adjusted returns and the like, we tend to think of it – well, we don’t tend to think of it. We consider, it nonsense.But we think it’s also nonsense to get into situations – or to try and evaluate situations – where we don’t have any conviction to speak of as to what the future is going to look-like. I don’t think that you can compensate for that by having a higher discount rate and saying, “Well, it’s riskier. And I don’t really know what’s going to happen. Therefore, I’ll apply a higher discount rate.”

1 Like

This is my biggest gripe with DCF, that we are plugging in some arbitrary numbers for risk while the whole perception of risk itself is a made-up concept so that human-beings can cope with dangers of uncertainty (Do read “Availability, Emotion and Risk” chapter in Thinking, fast and slow by Daniel Kahneman). And then people confuse uncertainty with risk and assume higher uncertainty is higher risk and that gets into their notion of value. And then people try to plug in volatility into value. I find the whole exercise unscientific and trying to attribute a preciseness to things which are by nature imprecise. I find it better to be roughly right than precisely wrong - or as BM put it recently “what matters is broad subjectivity than accurate objectivity”.

P.S. I like the work you have done here and I don’t want to come across as undermining it in any way.

4 Likes

David Dreman, in the context of investing, has rubbished the widespread notion of risk as volatility.
Risk, per Dreman, is loss of capital and erosion of purchasing power due to inflation.
Higher rewards haven’t necessarily been generated from high volatility and lower rewards haven’t always had low volatility.
Like everything in life, it’s complicated.

2 Likes

No, I don’t mind. I myself consider the Risk Free Rate + Few PPs to be the appropriate discounting rate. If someone has to use anything higher (Like Research Analysts using the CAPM), that doesn’t mean that the risk is high - but the knowledge to project the Cashflows precisely is not enough. That could either mean the company is outside one’s Circle of Competence or there’s not enough hard work being done (Ex: Reading the last 2-3 Annual Reports of the company).

I had to include all three methods in the model because they’re still largely used in the real world.

Since I am new to valuation models, it was good to read disadvantages of DCF model for a balanced view. Lately, I have realized the importance of a valuation model. All the favourite, quality stocks of VP forum which were quoting at lofty valuations have gone a severe time correction. They have delivered minimal returns in last two years. This experience has made me realize that no stock can be bought at any price, irrespective of its quality. There has to be a rough number for every business. (I know it has been repeated here too often but one has to learn from the experience)

So, can we know what method do you use for assigning a value to a stock? Putting every information available at your hand in a rough number. What’s your methodology?

1 Like

@avneesh
I understand that your question wasn’t intended for me. But, I thought I must share my views. I apologise if I’ve overstepped my bounds. As you rightly said,paying the wrong price for a right business is a recipe for disaster. I personally, am an admirer of the Dremanian investing strategy which advocates selection of low PE multiple, BV multiple, price to dividend, price to cash flow stocks. Also, buying stocks in which growth is available for a reasonable price.
Sometimes, we investors, build unsustainable expectations in the price of a business and justify the premium as a premium for quality. But, it’s pertinent to note that most businesses are strictly ordinary. We construct a coherent story in our mind to rationalise those irrational valuations. I’m fairly certain, that most seemingly top class businesses today will struggle to give returns because their current price has built in years and years of consistent, perfect growth.
Yet again, I didn’t mean to pollute the thread.

2 Likes

The stocks which have made me the most money are ones where there was a lot of future value due to growth. They appeared extremely expensive during the time when using DCF, P/E, EV/EBITDA, relative valuation - whatever. So I have focused more on figuring out where the growth is going to come from - New markets, new business segment, changing govt. policies, increasing opportunity size, capex completed but yet to contribute to topline, pricing power, improving margins, commodity price arbitrage, macroeconomic indicators etc. than breaking my head over valuation. You can key in growth while calculating value using DCF but I prefer to see growth as an unknown.

When you have growth on your side, you can be sloppy on the valuations and get away with it more often than not. DCF works best in steady state businesses with little disruption, policy changes etc. Unfortunately, not many of these exist here and when they do, they don’t have growth on their side and/or they are priced to perfection, so it is important to value these well to ensure decent returns. I have preferred to decipher growth from a subjective standpoint more than value from an objective standpoint and then follow results for a few quarters - the proof is in the pudding. I feel that being able to decipher businesses and mastering capital allocation, the art of selling and mastering the mind over a volatile portfolio contribute more towards the returns than valuation, because it is a given that everything is overvalued and so figuring out which ones can justify the overvaluation and which ones can’t is more important than arriving at absolute values.

20 Likes

I understand that you took some of the values from screener.in (TTM). But I could not get all of them, such as cash, non-operating assets, etc. Would you please tell us where did you get this data from? Thanks