
PE based on consolidated earning was already 23.48 based on yesterday’s levels. With today’s correction it should be around 22.8
1 Like
Bhai deliberately sachchai ko ignore Kyo Kar raha hai? People are quoting consolidated PE but yet you are quoting standalone repeatedly. Btw I am also just 40% invested right now and looking to buy. So if you are looking for a correction, at least post correct stuff.
1 Like
The bell curve I am referring to has been established based on 4400 data points which are downloaded from the NSE website. Row by row. No interpretations. This is standalone data, ok. But, I am also applying the statistical conclusions (Median, Mode, Average) on the same chart. Standalone to standalone.
Similarly, if someone has a consolidated bell curve then post it and follow it. Don’t mix the two. It would be a blunder to make statistical conclusions from standalone data and applying it to consolidated data.
3 Likes
Why do you expect that nifty will not fall below the PE of 20-22? What is the average PE of nifty over say last 5, 10 years?
On a standalone basis the average PE of Nifty between 2007 & 2014 is 19.5 and PE on standalone basis is roughly 6 points above consolidated numbers.
Sorry, I do not have Nifty PE on Consolidated basis.
That’s because I am expecting next two quarters to show more earnings recovery as we have seen this quarter. Also, I am quite confident that the D/E is coming down and that is going to have a direct impact as well. And then there is the sentiment positive of demand picking up. That’s why I think a P/E of 20-22 based on TTM earnings which is low base due to demonetisation and GST impact reasonable. I might be completely wrong but then I think this is the middle ground. I don’t want to be bearish because of the last few sessions nor bullish because of what transpired before that. Also, another interesting development is crude coming under $67 today from the $71 it was last week. So I see P/E 20-22 (Nifty 9700-10200) as the middle ground. This is based on the information I have today.
7 Likes
The other way to look at same thing is if historically, X number of crashes happened with Y range of fall, how many of them are attributed to a crash post years of stupendous earning growth and how many post expectation of growth euphoria but growth did not come with same pace. This could be a rough way to understand difference between correlation and causality around which there is disagreement. The problem of mixing correlation/distribution and causality could play havoc in analysis.I do not think we will have enough data points to statistically validate causality and call it a pattern and that would remain an area of intellectual discussion. Hope, I have communicated what i wanted to and it gets perceived in same way as there is subtle difference between correlation and causality
6 Likes
Hi @vicky_7900
Actually as pointed out by @jamit05 these are numbers from NSE website. The bell curve shared above helps in knowing the trend and more importantly the frequency table for probabities are all derivatives of this. So either one can analyse this or the adjusted data. Trend on both data sets will be the same, offcourse the absolute numbers will be different.
Saurabh has a very important point in his post. We can post mortem all the data we like and our brains will try and form patterns when there actually might not be any. That’s the human brain.
By the way very nice analysis @suru27. Keep sharing such stuff man.
Regards
1 Like
Hi Deepak, there are 2 issues
- Using standalone rather than consolidated.
- Giving nifty levels (8200, 7000 etc) based on today’s (or older) EPS (that too standalone), not taking into account future EPS growth.
I am familiar with normal distribution and have taken interest in the past to study derivations of its probability density function etc.
These are very useful things but I think their application here could have been better.
Hi
Only on the NSE reported numbers its purely a statistical analysis. We need to be cognizant of that. Perhaps I was not able to communicate clearly on this.
Just today Prof Damodaran has shared on his blog related to this. There is an excel sheet attached to the post. I am posting the data for India below.
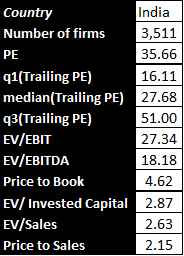
A quote from the article
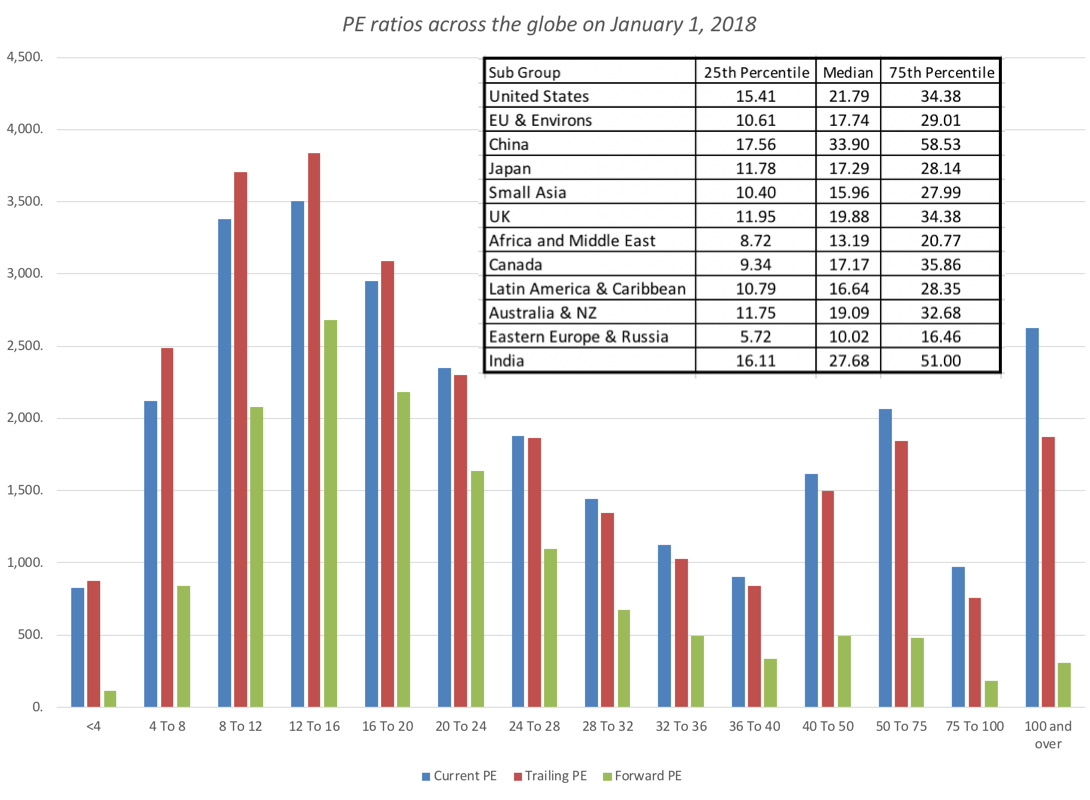
“I know that it is dangerous to base investment judgments on simple comparisons of pricing multiples, but at the start of 2018, the most expensive market in the world on a PE ratio basis, is China, followed by India, and the cheapest market is Eastern Europe and Russia.”
The data for the other countries is as below
Regards
5 Likes
Good insight. It would be interesting to see this in context of GDP growth and ROCE, PB etc
One is best off if he walks the middle path. Not too bearish, not too bullish. We talk only of the average path.
On the bearish side, Nifty remained below PE 15, 23% of the times. This pegs Nifty to 6200. What is the possibility of this happening?
Well, we saw PE 27+ recently. Market has remained there only for 0.70% of all trading days… still we saw it. The probabilities were slim, but it happened in stark reality.
In that light, PE 15, i.e. Nifty 6200 has a far higher possibility of happening than PE 27.
Moreover, we have seen last three times, that whenever PE of 26+ has been breached, the next bear leg has been vicious. The lower PE (<15) have quickly touched.
In other words, whenever PE 26+ has happened, the possibility of PE < 15 becomes very high.
This, again, is not my opinion, but facts.
4 Likes
Surprising to see that many guys here predicting NIFTY going to 8300 so that NIFTY PE can become 20.
Let us not forget that NIFTY PE CAN become 20 or even 18 AND NIFTY itself will stay above 10000.
6 Likes
You mean time correction. Nifty hovers around 10k for next 2 quarters and eps catches up. But there is huge amount of liquidity, domestic and foreign, MF SIP which will flow in like tsunami. So I feel nifty will be directional/trending- down or clear up. Sideways or time correction seems unlikely.
My response was to members who are tightly coupling NIFTY PE 20 with NIFTY at 8300.
My belief is that we are on an earnings upgrade path. And NIFTY PE will always trade on the upper side of its historical average during the earnings upgrade cycle. (NIFTY PE will trade lower than its historical averages PE when the future earnings are looking bleak).
I track 685 companies (combined market cap of more than 98%) very closely and based on the results that have come up till now, earnings have grown 16% YoY and 15% QoQ. And the earnings season is not even over yet!
If you go thru my other comment on this thread, I had talked about an on coming correction to 10700 levels on 25th Jan (edited). Much before the budget and current global correction. But, that does not make me a soothsayer. Such retracements are normal in a healthy stock market and we should not indulge in fear mongering by throwing around NIFTY levels of 8300 and 7000.
16 Likes
Hi Chirag
Completely on the lines of your thought process.
PE is an output whereas the Earnings and Nifty levels are inputs. Earnings move independently impacting Nifty and thus the PE. So simply dividing PE by Nifty levels which I have seen in another thread is perhaps incorrect.
Something like circular reference error 
Rgds
3 Likes
This definitely makes sense considering the current scenario…Lot of people have considered standalone numbers for PE calculation and also have given less weight-age to earnings growth…
One more neglected variable is GDP to Market cap which is no where near the top !
Hi @deevee
I just bumped into this post where you mention
Are you referring to this thread Nifty PE? Because I would like to correct errors if any!
Thanks a ton!
I try to stay away from the standalone vs consolidate PE calculation debate.
While ValuePickr members are doing a great job tracking the consolidated PE and it will be an asset in the future, I need to compare current PE with long term historical PE then I have to use the number given by NSE India which is standalone.
Check this article on why sometime we need to stick with an “incorrect” calculation: https://www.washingtonpost.com/news/wonk/wp/2013/09/10/the-dow-jones-industrial-average-is-ridiculous/?utm_term=.105ded55414a
So while they can “fix” the calculation now, they don’t do it as it will not co-relate to the historical data.
For me, the percentage earnings growth is more important than the absolute number of earnings itself.
1 Like
At broad level that is fine. But we need to note that consolidated EPS has grown at much higher rate compared to standalone EPS dues to inorganic growth or high growth subsidiaries.