Saurabh, that is a nice study, very useful. I keep revisiting the book and so i have not invested much in the past year except for some momentum bets. ICICI direct has a portfolio x ray report which is nice and i can see standard deviation of my portfolio is high, We have chosen Nifty here for the study. Since most of us here deal with the midcap and smallcap space, and the fluctuations are more severe, would the results be drastically different if we had a index mirroring the midcap/smallcap space.
Not related to equity, would a crash in bitcoin or cryptos cause any ripple effect on markets and lead to a melt down? Would that be a blackswan event that no one anticipated?
G1
Global brokerage firms see Nifty hitting 11,400-11,500 and Sensex 37,000 in 2018
Moneycontrol News Two global brokerage firms which have come out with their yearly outlook for Indian markets for the year 2018 suggest that the rall…
NiftyPEDistribution.xlsx (12.2 KB)
Column B shows the % of time spent by the market in the PE range. For ex. Row 8 shows that Nifty has spent 4.6% of all days in PE of 16 to 17; and PE 17 to 22 a total of 50.30% of all trading days.
Observations:
The Core PE 17-22
Nifty has spend 50.30% of all trading days in this range of 17 to 22;
As per current EPS the range becomes 6600 to 8600;
Since market remains there for 50% of the times, there should be no hurry. Comfortably paced SIP is good enough.
The High Side PE 22-28
Nifty has spend only 21.90 of all trading days in this range. This range is rare and is likely to come only for a year every five years. So, i believe these times should be specially reserved for booking profits. As there are plenty of other days where you can do the buying.
The fag end PE 24-29
Nifty has spend only 7% of all days in this range. That is phenomenal. There is really no question about what needs to be done. If a mutual fund investor or an Index investor is set to Buy in this range, then he ought to reconsider.
This range 24-29, has the lowest values in trading days spent. Like a cat ona hot tin roof. Prices want to get out of this situation it seems Hence, I feel that the volatility is expected to be high.
8 Likes
Nifty crosses 27 PE today.
I believe limited strong upside ahead with a follow-up into a steep fall. Market will fall only when the last bear has turned into a bull.
1 Like
Nifty PE is about 24 based on consolidated earnings. Also after this Q results, PE will reduce further as decent earning growths will be visible on a low base of demon Q last year. 2-3 Q down the line again earnings will be much higher as 2017 had GST effect.
Net net 3 Q down the line PE will drop to around 20.
Markets are forward looking and discounting these facts.
3 Likes
I think this 27 PE has been priced for the Q3 results, if the numbers disappoints, the bears will grip the market. Otherwise, good numbers will reduce the PE to the range of 24 and the bull will continue.
1 Like
I guess standalone PE is not making sense any more as consolidated earnings add almost 10-15% to EPS.
For PE to become 20, keeping Nifty constant, the EPS will have to become (10500/20) = 525; Current EPS is 390… this is a 35% jump.
A 35% increase in Nifty EPS has happened in the total of last six years. Therefore, I doubt if EPS will be able to give much support to Nifty in 2018.
1 Like
Look at consolidated EPS.
Also, all IT majors did buyback of 4-5% of equity. EPS needs to adjusted for that too as IT forms 11-12% of Nifty.
1 Like
I have been following what the NSE website has published, and have used around 4500 data points to develop a Nifty PE Bell Curve. Current PE is 27, and the bell curve says it is +2 Std Dev…
1 Like
By no means, valuations are cheap. But raw statistics only gives a bird’s eye view. We need to be cognizant of following when comparing historical data for Nifty data:
- We have to look at it in context of nature of inflation and interests rate.
- NSE just uses standalone data for most of the companies. e.g. HDFC PE shows as 37.23 . This is a major issue as for a lot of companies like HDFC subsidiary profits are increasing at much rapid pace compared to standalone entity. Thus divergence between standalone and consolidated earnings will become larger. So we have to use consolidated numbers.
- Nature of Nifty constituents has changed. It had lot more capital intensive, commodity businesses and PSUs in the past warranting a lower PE. Today NIFTY has a lot of technology, pharma and consumer facing businesses commanding higher PE.
4 Likes
I agree. Over the years the changes that you hve mentioned have come by. However, I believe that due to the following reasons, the PE range should not have changed very much.
-
Earlier IT and Pharma were leading the roster and trading at PE of 35+. However, now they are languishing at PEs below 20. This has had a huge impact, because at one point in time IT and pharma made-up around 30% of the Index.
-
The Top Ten companies of Nifty 50 make up 50% of the index weight, and the other 40 companies make up the rest 50%, which is where shuffling has happened. The Top Ten companies still stand their ground. Therefore, due to this attribute of weight distribution in Nifty 50, I do not think that the shuffling would hve caused any drastic change in the Nifty PE Bell Curve.
A bell curve of 4500 data points say that the Median for Nifty PE is at 20. This, in my opinion, is the gospel truth.
1 Like
Nifty PE will be further lower if you discount earnings for the next three years, instead of next three quarters. Not everything is priced in an efficient market, always.
The law of markets prohibits judging the exuberance of markets into buying further. And that was exactly my point. That the market is not cheap in any valuations.
Are we prepared for a steep correction mentally? If yes and with a plan, then one should be comfortable.
1 Like
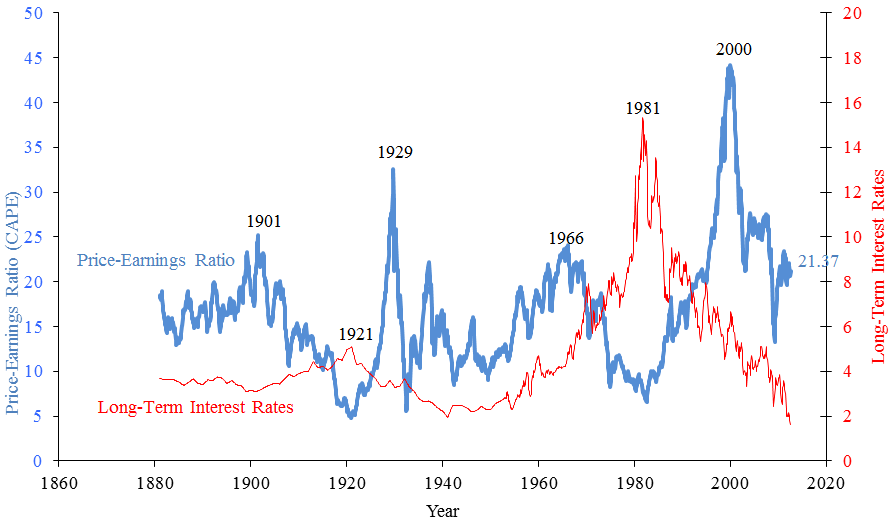
Point is interesting. S&P 500 bell curve was same for nearly 100 years (till 1990). After that 2000 looks more like an aberration and slowly its getting back to the old bell curve. Interesting to note that except for few humps there is not much PE expansion on the long term also. If history is to repeat itself after 1929 next major PE event came only 7 decades later.
Another interesting thing to note is that if its S&P 500 or Nifty the PE stays in the 14-25 range for most of its life.
For my own personal view. I will consider PE 26 as exit levels for now.
8 Likes
This graph beautifully captures the inverse relation between PE & interest rates.
Almost all the times( except in the 1950s & 60s), the directional change in the interest rate ( Up or Down) has accelerated the decrease or increase in long term PE ratios .
So we should closely watch the bond yields & interest rate trends ( I feel that may be a better predictor about the future trends as far as the PE levels are concerned )
1 Like
While you have made a seemingly good argument, I am not sure bell curve can be applied to market PE over a period of time. What if there is a secular shift in PE range? As an example, Scientific American says that “over the last 150 years the average height of people in industrialized nations has increased approximately 10 centimeters”. Now if you were to take a random sample of 1000 humans from 19th century and 21st century, their heights will still form a bell curve but the actual height on an average is up 10 cms. I wonder if post 2014, we have reached a stage where average PE will shift up a few points? If yes, all your calculations will remain valid (for past data) but won’t apply to the future.
1 Like
Furhter, please look at this chart
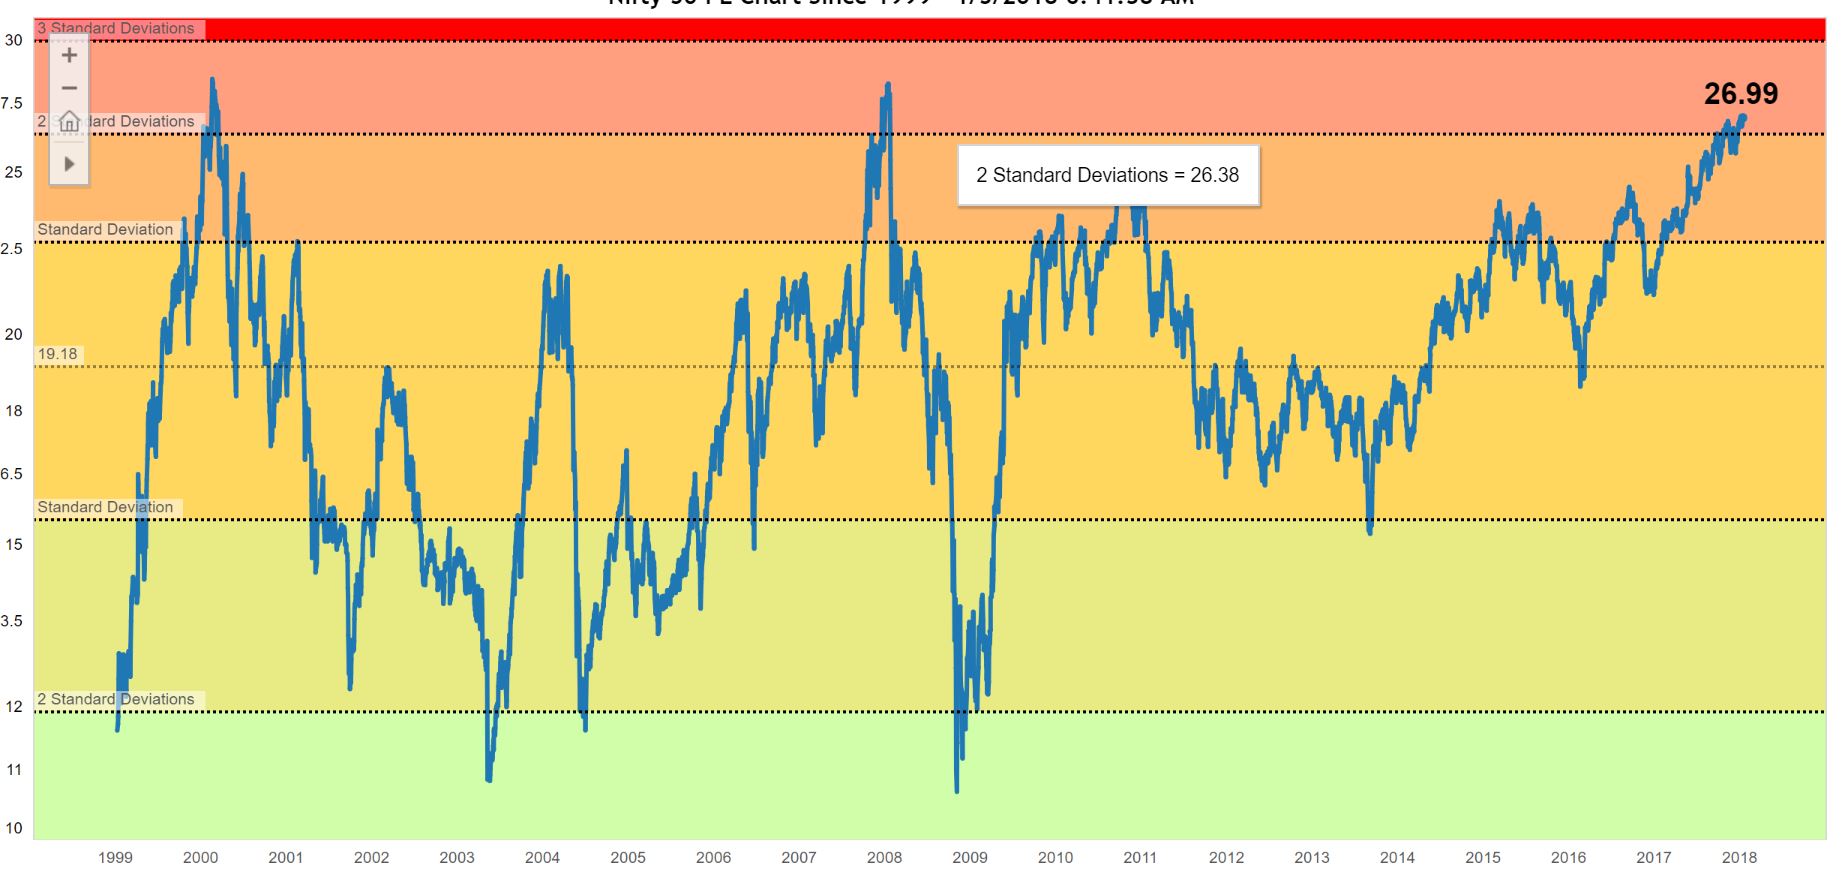
Both times when Nifty PE went 2 SD above normal, it started 2 SD below. But this time it only went 1 SD below (mid 2013) and then went straight to 2 SD above. Is that an indication of PE range shift?
3 Likes
My takeaway is that it will be more or less a bell curve with crest and thorough changing for that particular cycle. Sometimes it can be flat otherwise steep up and down. There doesn’t seem to be a point finding a median. Interesting is that range of 14-25 is where it spends most of time
There is a trading folklore that says don’t look at the level of an average line but instead look at the slope of that line. Essentially look at how fast the line is moving and not where it is.
When I look at the long term PE chart, whenever the PE has shot up, it pulled back sharply. On the other hand steady climb was followed by a steady drop. Current phase looks more like a steady climb than a rocket launch. PE is mean reverting so there is no doubt we will see a PE of 20 in future. Sooner or later is the question and how will we get there. A sharp pull back or a steady drop? With earnings expected to pick up and liquidity indicators signaling huge liquidity in the system a sharp pullback anytime soon is unlikely.
I have never seen a bear market start when GDP & earning growth is picking up and market is awash with liquidity. Its when high growth meets with high PE that makes a top. I only see early cyclicals reporting good growth now. When late cyclicals start reporting strong numbers, it will be time to step back.
27 Likes