
The last paragraph of yogesh is very critical n Crux of debate . n numbers can be deceptive if science behind numbers remains Mistry.
Dear Yogesh,
Good observation.
Please elaborate on late cyclicals.
Prasad
My immediate response would be that, by its very nature the market is not bound by rules. I will try and back this comment up with numbers from the past, if i can.
Illogical is also very likely to happen.
3 Likes
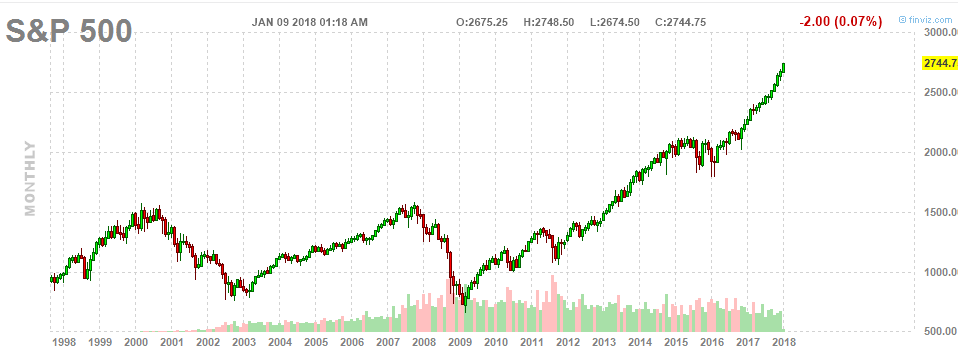
SnP swift move on monthly chart from 2000 to 2744… very quick. Almost as if it was intentional.
Point being, there isnt a single swift move in Snp chart of past twenty years, that has not been reversed.
1 Like
Hi Yogesh,
You have made an important point and very interesting observation. Waiting to learn as the time goes by whether market responds to earnings growth and GDP or will the mass behaviour pull the market in bell curve.
Can you explain this in detail? I did not understand this.
Hi,
I have plotted a chart of ROEon a quaterly basis. I took ROE as EPS/ Book Value which is not exactly correct but will give a rough estimation.
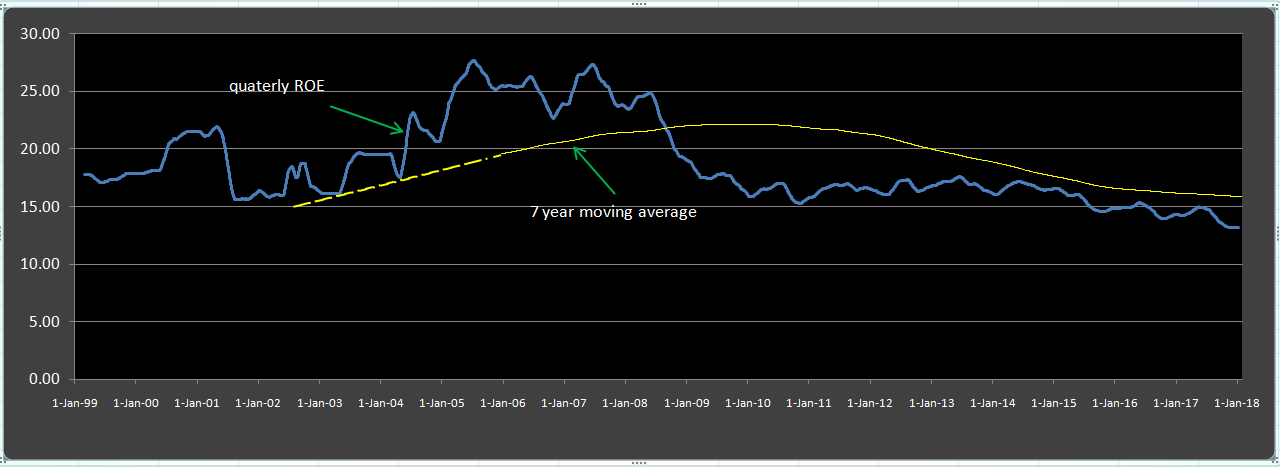
It is presently running below its 7 yr average from 2009 onwards.The dotted line in the average curve i just extrapolated the slope of the curve. My point is that how long the earnings can remain in the lower side. There has to be atleast a mean reversion.
4 Likes
Once again why should ROE be a fixed number and not a function of interest rates?
You put it in one simple line.
Most here are justifying this the current situation based on future expectation that the GDP growth will resume and the earnings will pick up. The Growth has been shrinking since 2008. It has been ten years. What are the chances that the desired change will happen in 2018.
What if the economic growth recovery does not happen in time. How low could the market go?
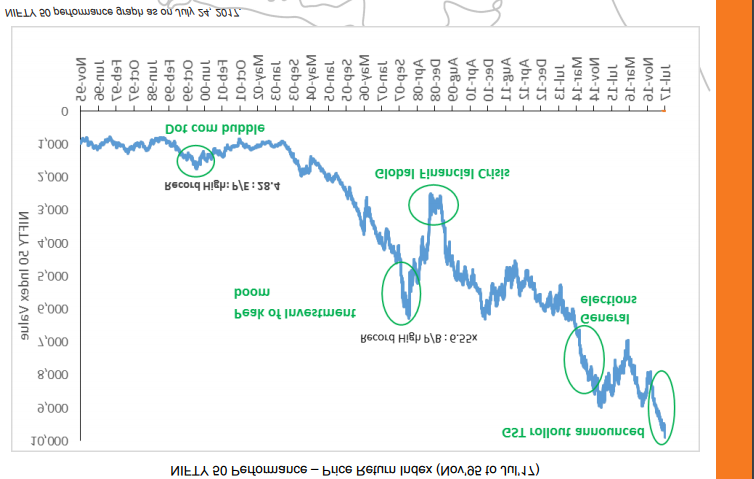
Sometimes we should see the chart upside down to shift our biases…if the below chart isn’t a great time to buy (for value investors), what is? If the current PE were 5 to 7 points below the historical median, wouldn’t we be buying? At least, we would start buying in a phased manner, wouldn’t we? If yes, why not sell in a phased manner during this bull market?
When the markets are going up, forecasts are always rosy; the opposite is true during bear markets. Don’t believe me? Read some headlines when Crude Oil was near $27 / barrel in 2016. It was as if the inventories would continue to pile up and Oil was headed towards single digits! Oil producers themselves were getting ready for $20 a barrel.
I leave you with some quotes from The Little Book of Behavioral Investing:
From a survival point of view, a false positive is a better response than a false negative. Emotion is designed to trump logic.
Some 70 percent of analysts think they are better than their peers at forecasting earnings - yet, the very same analysts had 91 percent of their recommendations as either buys or holds in Feb 2008.
Hope isn’t a good investment strategy.
“Don’t question authority. They don’t know the answer either!”
“Analysis should be penetrating, not prophetic.”
“You can’t predict, you can prepare.”
Disclosure: I am not an investment adviser. My portfolio as of today - 50% equity, 10% gold, 40% cash.
14 Likes
I am adding few interesting papers on early and late cycles.
For info.late and early Business_Cycle_Sector_Approach.pdf (263.0 KB)
late and early cyclicals FollowtheCycle.pdf (267.8 KB)
1 Like
Though I’m not a big fan of Mr.Porinju Veliyath. But what he says makes sense.
Thanks for the nice graph!
Everybody talks about earnings recovery. But, what is the quantum of the earnings recovery that is expected?
I am guessing the numbers from my visual inspection of the graph. It appears that average RoE for the past 20 years has been ~18.5%. The RoE for the previous year looks is about 14.25%. So, one may think that earning should recover by ~30%, (18.5%-14.25%) / 14.25%.
We should remember that RBI has made its objective to target inflation. CPI for 20 years prior to 2015 was ~7%, the stated target is 4% with a range of ± 2%. If inflation goes down, so should RoE. We should not compare RoE in future with past RoE which was at higher levels of inflation. The expected RoE should now be 3% lower reflecting the decline in inflation (7% - 4%). So, the new average RoE should be 18.5% - 3%, that is, ~15.5%. From the current RoE of 14.25%, the new normal of average RoE is only about 8% higher, 8% = (15.5%-14.25%)/14.25%. So, the earning recovery has the quantum of ~10% and not ~30%.
If my thinking is correct, then I wonder what will happen when market recognizes this. 
3 Likes
During large market declines, illiquid small caps lose ~90% of their value. Then many a barsati medhak (frogs that appear in monsoons) will disappear from news channels.
He just says market is bullish because of DII and MF funds. This is one herd which had no Shepard. They all got onto the bandwagon due to Modi factor. Economic reforms are on track… But it takes time.
Every piece of news article is bullish. Market is just waiting for a catalyst. These levels are not sustainable.
1 Like
Pe will come down as good growth ahead
Once again, go ask a saver who is getting 5% in FDs post tax what RoE does he want from equities? Why do we not take into account cost of capital when talking about RoE?
1 Like
Let’s think about this saver. He was getting 7% in FDs post-tax when inflation was 9%. He was happy while eroding his wealth at 2% each year. Now he is getting 5% in FDs post-tax when inflation is 4%. He is increasing his wealth at 1% and yet feels miserable. This saver appears to be a creature of herd mentality and not logic. I would rather not follow him.
1 Like
Would you start trading in bitcoins just because its recent returns have been phenomenal compared to Indian equities? Most of us will not because we do not understand it enough. Same way most savers put it in FD because they do not understand or are not comfortable with equities. I find nothing wrong in that. In china most savings go into Real Estate, same had been in India prior to demonetisation and that is basic nature of human beings. Nothing to blame them or feel surprised. They will invest where they understand and feel comfortable.
I also think that there is nothing wrong in that. Nor do I trade in bitcoins while friends do. But, I would find it peculiar if a saver feels happy while his wealth erodes and sad while it increases. I will not like to follow such savers.
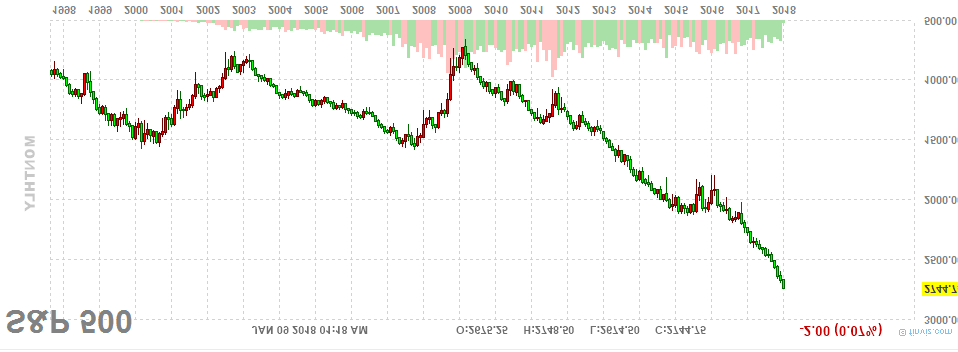
Adding Nifty chart of last 22 years and then upside down.

It more of looks like a continuous downtrend in upside down chart rather than a buying opportunity. Just considering the chart will never give you entry/exit points as market is in long term uptrend. Unless some unforeseen events at country level, market is going to stay in uptrend. There may be corrections on the way but that is welcome.
Having said that, I am really scared with current PE levels (Standalone or consolidated) but I believe better earnings will be reported this and next year considering low base last year.
Made my portfolio more concentrated and switched everything where I have even faintest of doubt about management or future growth. (Trimmed from 20 to 14 stocks).
Checking news about all companies nearly every week or twice a week (as against relaxed approach earlier)
In 10% cash and will continue to be so.