Nifty PE crosses 24|A statistically informed entry-exit model!

Dear @Yogesh_s

Please do not see the below words as overconfidence :slight_smile: I know humility is more appreciated but sometimes it is not required, so I will flat out state my facts.

The biggest mistake will be to think of any member of this forum ā€œaverageā€.

Why: I although wise in the ways of business (some might say that) was a fool when it came to investing. Sure, I may and many others may have made some money with stocks, but there was no process behind investing.

This forum will take the dumbest person and change their entire outlook to investing. The number of things learned are so many, it is impossible to put them down in a sentence or ten sentences. It is the most amazing exposure to one who was earlier a retail investor like me and used to think investing is a black art; a game of pure luck etc. The ā€œblackā€ has been removed and what remains is the art; priceless and will carry us forward for years to come. Thus no one who reads and participates here, remains average anymore.

The mind, once expanded to the dimensions of larger ideas, never returns to its original sizeā€ - Oliver Wendell Holmes

We all come to this forum which is a fountain of knowledge to someone who wants to drink from it, benefit from it, we donā€™t even ask who pays for all the maintenance of this collaboration. I have personally had the pleasure of reading thousands of posts and I am sure everyone has benefited in some way which changes us from being the clueless retail guy to a more informed participant in the markets. There is reading, arguing, presenting our logic, getting validation or a reality check. This is not available to everyone so we should not take the learnings here as information that everyone has, no they do not.

So, average is not acceptable. The average is a statistic encompassing all of the market participants and then the only fair investment is the Index ETF and nothing else and then there was no point to reading and learning here. Assuming that would be my mistake.

Plus, we have the privilege of being given the opportunity to learn from some of the finest investing minds, yourself included in my list so how can we be average.

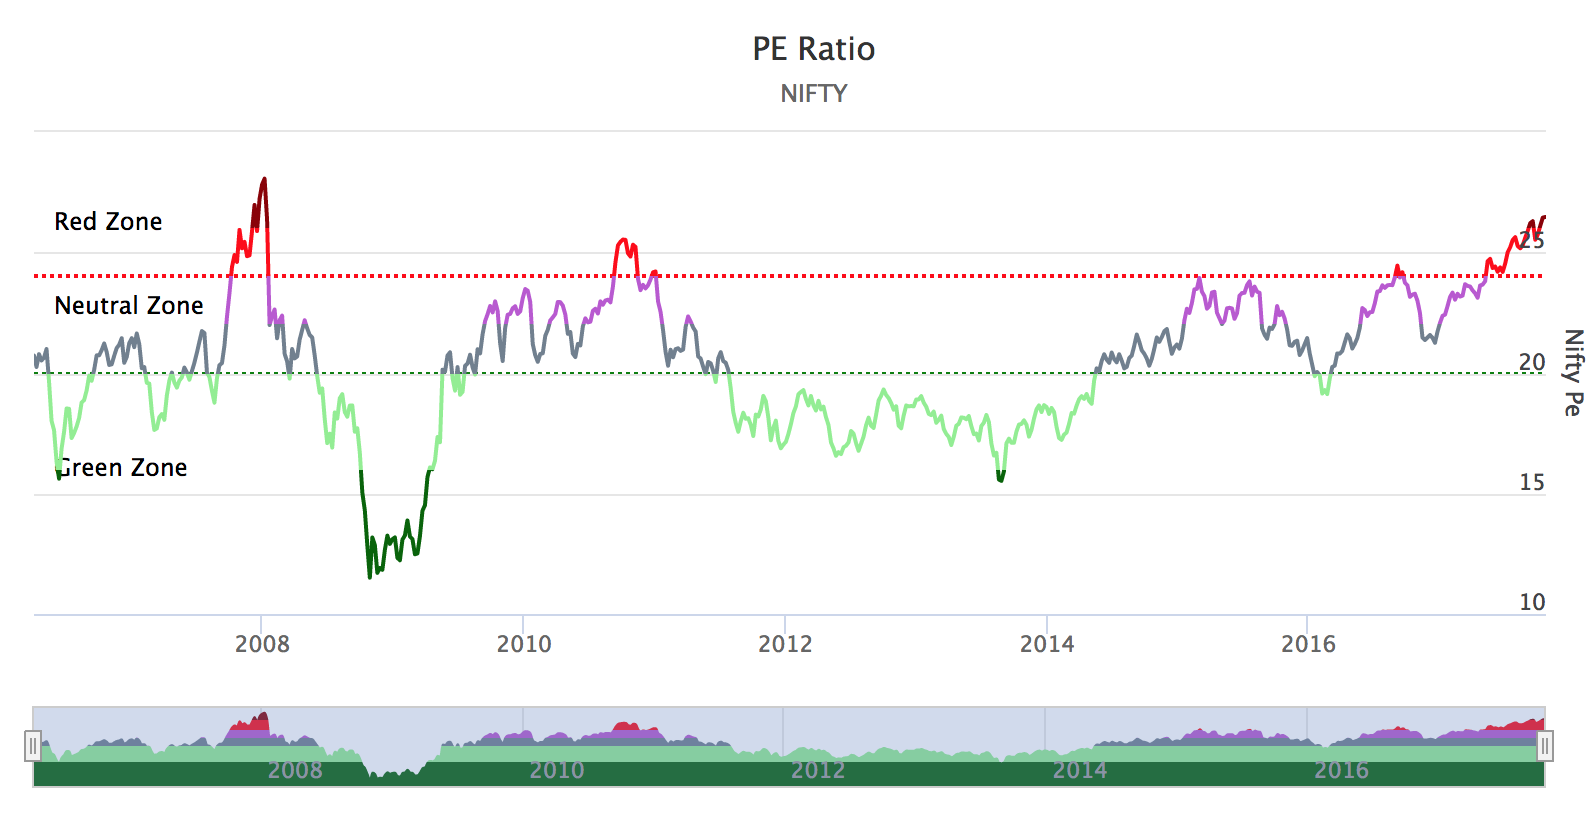
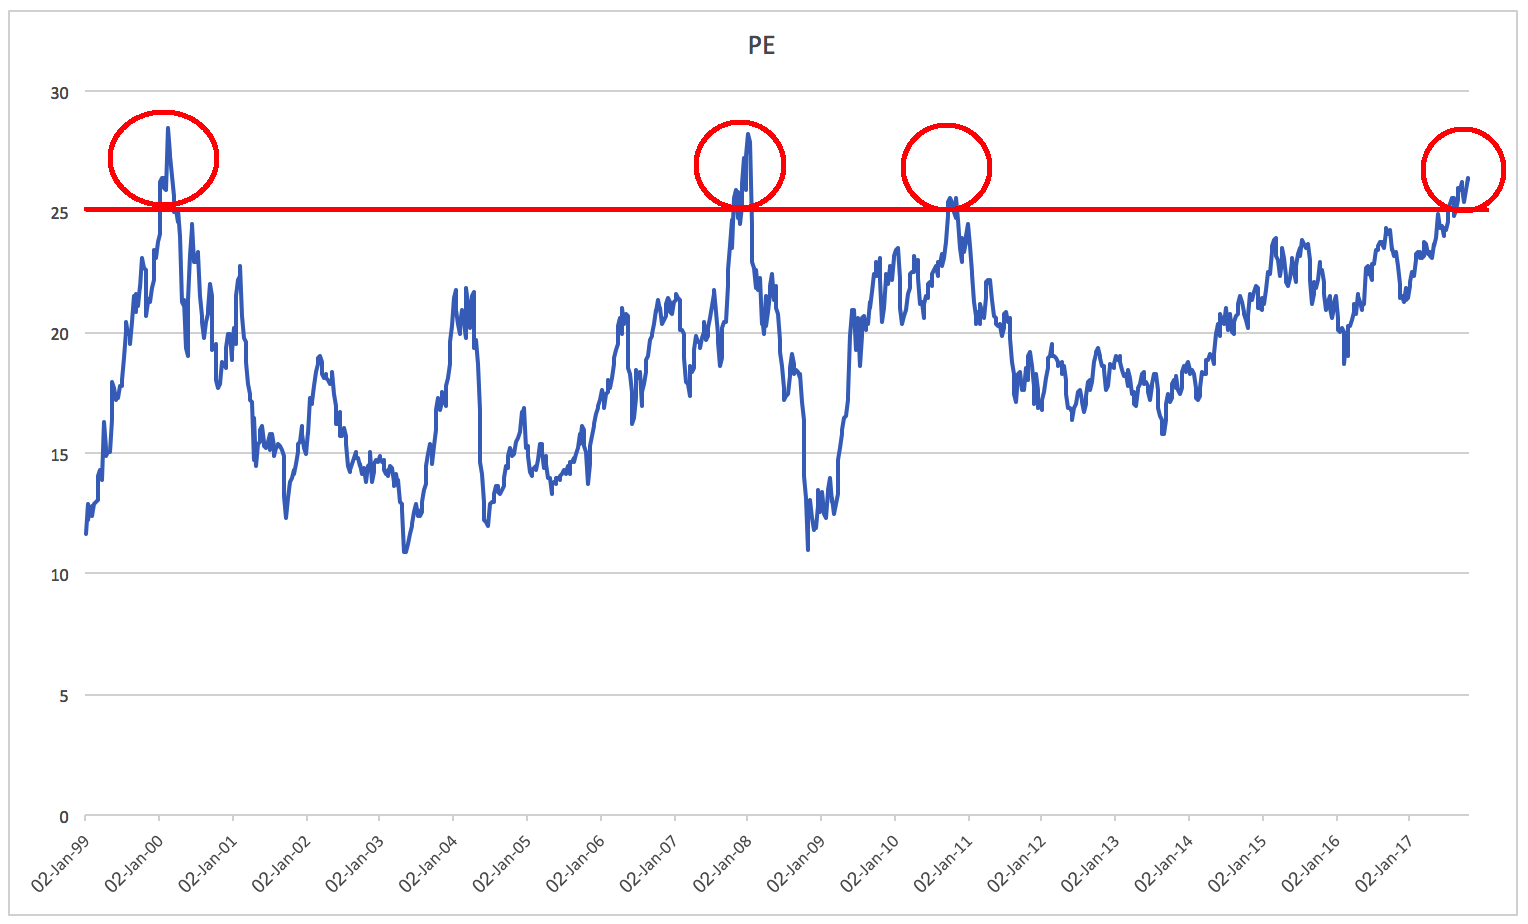
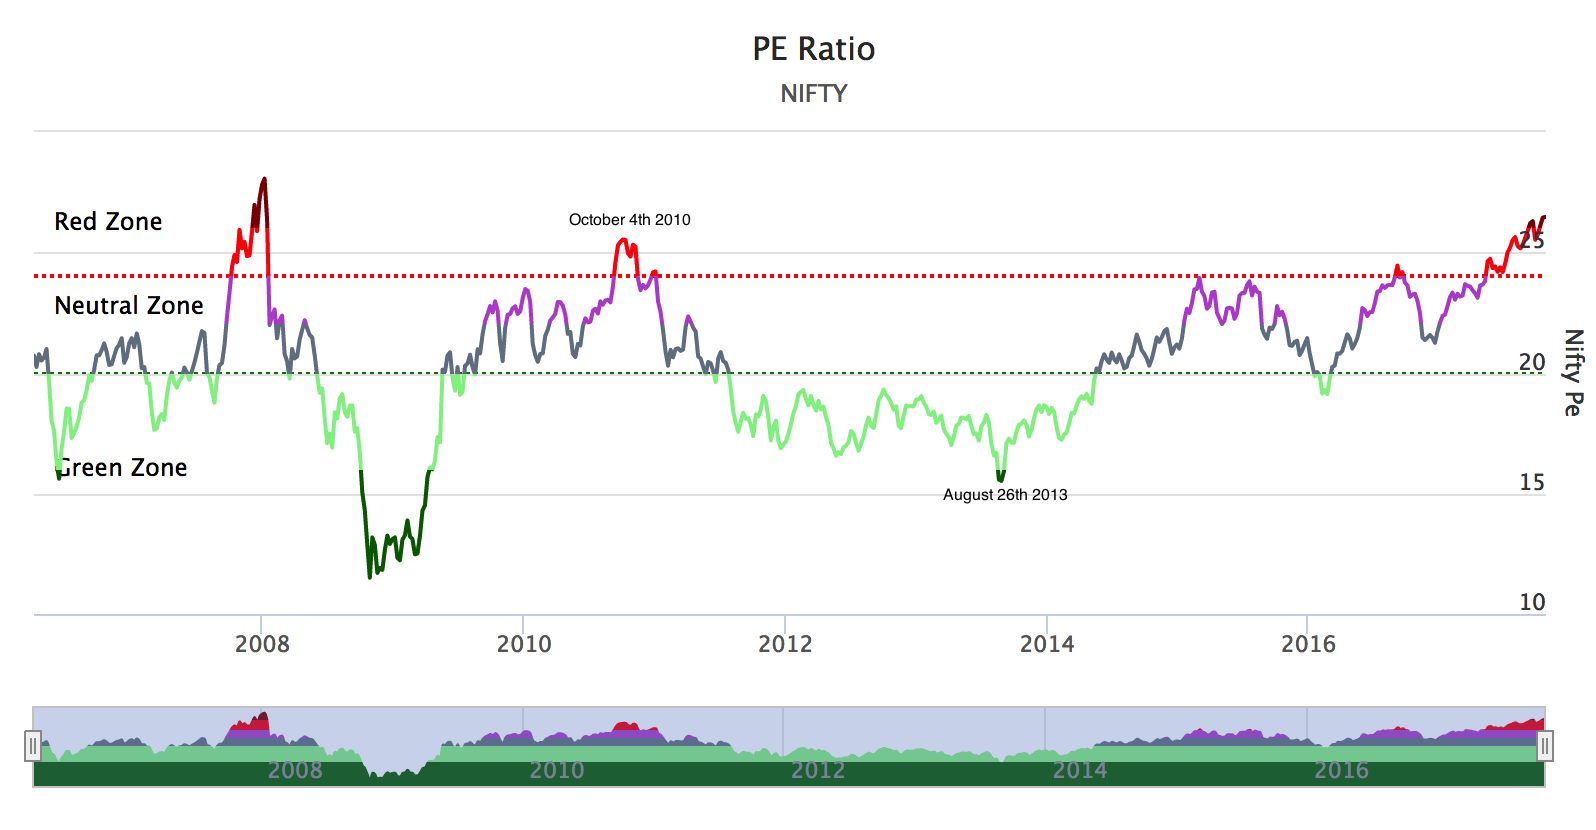
Here is a chart from Sanjaybakshi on the Indian indices. I will be surprised if this time itā€™s different.

I also have a lot of data from other global markets and I am sure you do too.

Why be average? I want to be above average. Special :slight_smile:

So, a big thank you to all the people who made this forum and kept it open so everyone could learn and become a better investor.

13 Likes

I think we are mixing things here. As someone had said, there are a million ways to make a million dollars. Whats important is to have a way defined for yourself and stick to it over a long period of time.

As regards to the discussion happening above, one needs to review if his portfolio behavior is in-line with the Nifty behavior. If the portfolio goes up in the same proportion as the Nifty and crashes in the same proportion as the Nifty, he would be better off just investing in the index. He should then look at Mr Bakshiā€™s chart and time his entry/exits in the index accordingly. He will do good in life.

My simplified view is that there are 3 types of investing in the equity market -

  1. Invest in the index. Timing is crucial in this strategy. As i said, the chart above will be an excellent input to chart out entry/exit points. This can even be automated.
  2. Invest in an equity fund ideally through a SIP. Discipline is very crucial in this case. You need to be disciplined with your SIPs and stay the course over a long period of time.
  3. Invest in individual stocks/businesses. Business domain competency and temperament are the crucial attributes to have in this case.

Money can be made via each of the above mentioned strategies. Figure out who you are, what you want to do and accordingly create your investing framework. Happy investing :slight_smile:

10 Likes

Hi,
The Nifty PE ratio Vs 3 Yr Returns table is informative. Please try to compile a data for Nifty PB ratio Vs Returns also.
regards

1 Like

Hi @josephseby

I find the PE ratio is a fair reflection of the earnings being discounted at the point in time for the NIFTY 50 and the other indices.

The PB to me is not dependable as the PB ratio is dependent upon the constituents of the indexes at the time, and banks heavy will show something else and manufacturing heavy will show something else.

Earnings remain constant method to gauge the optimism or pessimism of the participants in general. Thatā€™s my view anyways.

what I mean by average investor is someone who regularly invest in the market and not try to time the market. This no way implies that members of this forum are average. Since we discuss individual stocks based on their fundamental characteristics and not so much based on their trading characteristics, I was only implying that finding undervalued stocks is much more rewarding than timing the market. Sometimes just existing one stock to enter another stock irrespective of where the index is trading isnā€™t a bad idea. That way one can ignore index valuation and just focus on individual stock valuation.

I exit a stock when it appears expensive and if there is nothing else to buy, I just sit on cash. Exit decision depends on valuation of the stock and not valuation of market as a whole. This has nothing to do with index PE except that at high index PE levels it is difficult to find things to buy. But I have not come across a situation where there is nothing to buy even at the top of the bull market. finding stocks becomes a little hard but isnā€™t that exciting as well? I mean if there are bargains everywhere, whatā€™s the fun in that?

As regards index PE, IMO it is inversely proportional to interest rates and volatility both of which are at mutiyear lows so comparing PEs ratios with past levels may be misleading. We may be a little expensive at this time but we are not in a euphoria type situation something that warrants extreme caution and abandon stocks all together.

10 Likes

Dear @Yogesh_s Sir.

I did not mean that you meant that forum members are average :slight_smile:

Let me clarify; The excel you provided is a undeniable statistic and the chart by Prof. Sanjay Bakshi is also a correlated undeniable statistic and both data points refer to the same indices (ok, nifty and sensex). So both are true and thus facts of both the data points should only to be judged together as they do not exist in isolation. If the Index will at times go to these elevations, it will also come down from these elevations.

My point was, as a slightly above average investor, we must learn (imho) that if we buy the pessimism, then inversely we must sell the optimism else where is the profit. Then we can wait for pessimism to strike again, and buy.

For long term investing as you rightly said, and for those who can find and study stocks, I do agree that buy and holds are a great strategyā€¦ but may I be honest; I frankly think even on this forum the entire group of people who can actually dig up a stock is maybe 20-30. You are on the list :slight_smile:

For simpler investors (who first must recognize their lack of ability) we have to learn to adapt in another way. Yes, so I have a strategy and it works for me. The benefit is, even if a wrong stock is bought by mistake but during periods of pessimism, one may escape but when the markets are elevated there is no sparing foolishness and leads to permanent capital erosion.

So, yes, we (I) have become above average (considering where I started) by learning from the more intelligent contributors but are not yet exactly the super investors of ValuePickr Ville.

So, I use the sneaky strategy of timing with market and sleep better and keep learning in the meanwhile, and hope to try and get to the next level. But I am sure, that is at-least 3-5 years away, so must be very alert with entry and exit points in the meanwhile.

Just as I recognize that I am not as stupid as the pure retail investor anymore I must also recognize I am not as smart as many of you guys here and should not operate with the level of confidence that you guys operate with.

Best Regards.

1 Like

Abandoning undervalued stocks due to high Index PE can be injurious to portfolio returns in the long run.

1 Like

Here are my calculations. Pretty close to Professor but a little less pessimistic.

image

Current PE 26.3
Current PB 3.4

Source: NSE - Data as of Oct 19 2017

Market Timing.xls (857.5 KB)

5 Likes

A little twist on the data

image

Above table shows that when index is trading at a high P/E ratio, it can still give a decent return and when it is trading at a low P/E ratio, it can still give a bad return. Expensive market can remain expensive or get even more expensive and cheap market can remain cheap or get cheaper. Point is lets not the averages fool you.

Note: this data is as published by NSE. I actually doubt their calculations but didnā€™t spend any time correcting it as I donā€™t use it anyway.

10 Likes

What could be reasons for the divergence between current PE and PB?

This was discussed earlier this year. Please follow the discussions after post 126.

3 Likes

Hi,
that means PB is still in a comfortable level. How about using Grahams Number PE x PB.
Regards

How about FII pumping in today. This FII DII is useless stuff I feel . May be because I am not a macro guy much. What is hot wonā€™t be cheap and what is cheap wonā€™t be hot. One needs to develop his own style thatā€™s what I have learnt. May be 2013 was a time when nothing was hot and everything was cheap. We are reaching to a situation where slowly everything is becoming hot but we have not yet reached . So would avoid timing it yet

Wow, the information shared above are outstanding.

Hi Saurabh @suru27, as you have pointed out, 'we are reaching to a situation where slowly everything is becoming hot but we have not yet reached thatā€™.

I believe this aptly describes the present situation. I have been shortlisting some companies for the last few months, but all of the stocks I have shortlisted so far are overvalued at the moment, hence I am waiting for the valuation to come to a level ground.

I have learned something about my behavior over the last one year, that is buying at a fair valuation is important for me else I get pretty nervous after I take position and I end up thinking too much and getting frustrated and this is the reason I am staying out.

As you have pointed out that one needs to develop their own style, looks like this is something that will stay with me.

1 Like

@Yogesh_s Sir.

Deeply in thought since your posts. One mental model for me is to re-visit every theory and either discard pre-conceived ideas or validate them further.

I had data only for last 10 years and the nifty module made it easier to see the drawdown probability using that plus prof bakshiā€™s analysis and I have been using that. I am pasting the nifty chart I have been using below:

Now, thanks to the excel you provided with much more historical data, I used that and simply created it as a chart the last with nearly 19 years data as below.

Sir. In last 20 years; the PE multiple has crossed 25 only 3 times previously. The impact is clearly visible.

Sir, why will it be different this time. Are these 4 times (including the 1 ongoing run) not the 4 rare times in 2 decades that the investor must sell out? That seems fair (realistic?) to time? Then am I a market timer? :slight_smile:

Look forward to hearing your thoughts.

8 Likes

Apologies for multiple posts, but to quote something I read at VP I think by Donald ā€œIt seems I was blind but now I can seeā€

Like a bolt from the blue I understood what you meant.

Nifty Top: Around October 4th 2010

Nifty Bottom: Around August 26th 2013

3 of VP favorite stocks from the time:

Avanti: Up 493%
Mayur: Up 251%
Ajanta: Up 520%

While the Index went from 25 to 15 :slight_smile:

Ok. Understood. Focus on stock picking. Gn.

13 Likes

Dear Value Student & Yogesh

Thanks for wonderful discussion.

In a pricey market, probability of errors are high.
In a undervalued market, probability of success are high.

Investor always talk about success stories and forget about their failures.
(Human Nature ā€¦)

For every ā€œAvanti Feedsā€, there are 5+ other failures, which no one wanted to look in to ā€¦ (General observation only)

A seasoned stock picker can spot opportunites in any market, but number of
opportunities reduces as markets moves beyond certain P/E.

Uncle Warren is sitting on USD 100 billion cash; My humble question is ā€œWonder Why?ā€

9 Likes

Another thing to note in the above PE graph.

Every time when the PE reached levels above 25, and then when the bear market started, it wasnā€™t mild. Instead, market went onto correct sharply to reach the other end of the spectrum, i.e. PE below 15.

This speaks a lot about the underlying psychology of an overbought market, wherein how the value investors significantly lighten their holdings as stocks appear expensive at PE>25. Then as the bigger-fool theory unfolds, these holdings are passed onto a class of investors who are weak-hands. They are easily shaken due to high prices of acquisition, and are easily scared away. This whole group of investors want to head out of the door all at the same time, causing an extremely low PE.

This is probably what causes an extremely high PE one year and an extremely low PE the next. And in between that swing, the economy, incumbent ruling party, exports, business, GST is just the sameā€¦ nothing has change.

5 Likes

Good observation. Because even if you sell at 25, the question remains when do you buy back. A 40% fall from here would take us to 6300 and looks unlikely for now. Or may be the earnings go up and price falls a little to get us to lower PE.

Reinvestment risk is something not discussed often. But it is a real risk for long term stock specific investors. Unlike index your stock may not correct significantly and goes above your sell price after mild correction. For index investor Nifty levels matter.