I believe the actual increase in revenues will kick in starting Q2 2018 when the new building is ready, this quarter there were less bookings resulting in average results.
Construction work for IT building no. 4 admeasuring
about 17 |akh sq. ft. is in full swing, and is expected to be completed by 30 April 2018. The
MEP and facade works have now commenced.
Bombay Exhibition Centre revenue were less QOQ and YOY as well. Not sure why ? less bookings? But stock is technically holding up beautifully. One company where you are assured of revenue is this one; and yes Q2 2019 with new IT park will re-baseline the revenue to higher level.
Thanks for the excel. Couple of points which we may need to take into account to build a more accurate model.
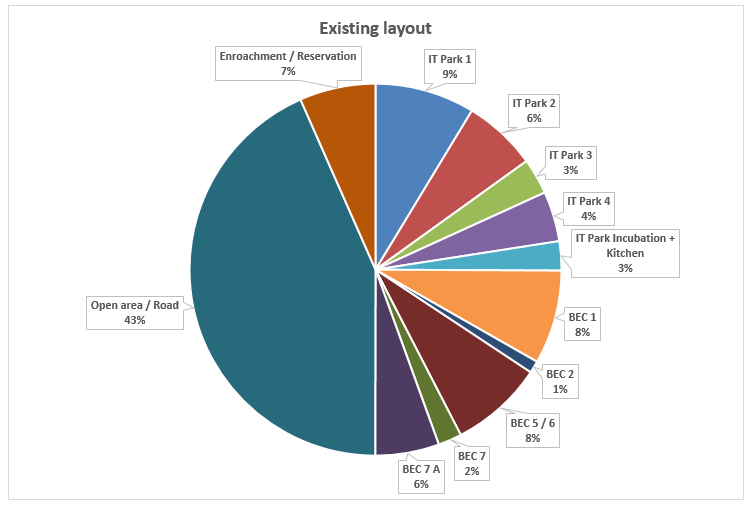
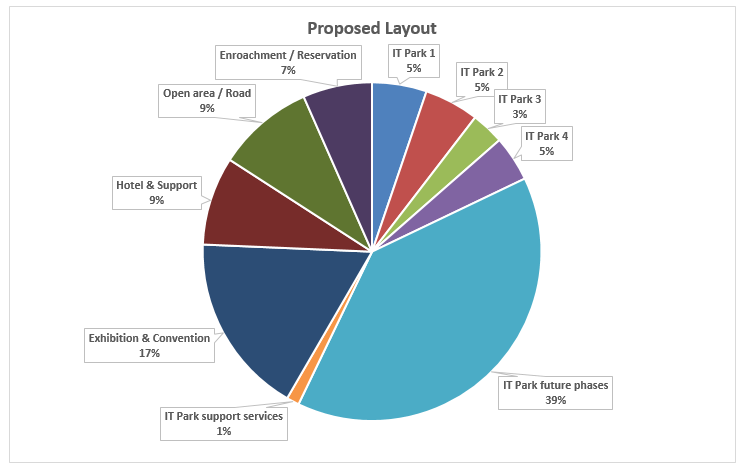
Building 1/2 is planned to be demolished and rebuilt. Current revenue contribution from these buildings isn’t much (~35 cr). Has management guided about the construction costs and prospective revenues from these two buildings once these are rebuilt? Have they provided sny timelines? I do not see much information on this in annual report, presentations, and result disclosures. Also, if this will happen at some point, we need to adjust the model based on these revenues going offline for a couple of years before new buildings come online. The logic behind doing this is obvious (correct me if i am wrong) i.e. better buildings with more floor space on the lines of Building 3 and 4. Currently Building 1 and 2 are occupying large ground coverage but contributing very little to the revenue. In comparison, look at building 3/4…smaller ground coverage but contributing much more meaningfully. What will be the game plan for Building 1 and 2 occupants? Will they be shifted to Building 4? Also, where are the funds for redevelopment going to come from? They have not included this in the original capex plan of 1500 cr. Just said this would be done.
While new exhibition center will be constructed, what will happen to the revenues from the existing exhibition center? Basically the existing buildings of BEC will have to be demolished as per the two maps (old/new) enclosed in the recent presentation. For instance, BEC Hall 1 is where IT Building 5 is proposed. Whereas, the whole BEC and hospitality wing will be on the left hand side of the map. I am not sure how they will manage to do it on an ongoing basis. New BEC is coming at the same place where the existing BEC sits. So won’t it result in a revenue hit? I read somewhere that mgmt denied revenue hit but i seriously doubt.
Other income - Mgmt has said that internal accruals will be used for capex. With the proposed 1500 cr for building 4, BEC and hospitality wing, their investments of close to 450-500 cr will be utilized in the new construction. Moreover, any new cash generated in next 3-4 years will be utilized in capex. So other income will reduce drastically in next 5 years. Other income last year was close to 42 cr. So, we need to adjust the model accordingly.
Do we have any clarity on Reliance center’s business model? Will the market expand or will the incumbent get hurt?
Q3FY18 revenue from BEC has lowered quite a bit, while those from IT has improved. Reg BEC, mgmt said some macros. Will traffic woes and related orders count as macros? Or there is something else which escapes the eyes? Don’t think it is seasonality as Dec has usually been the best qtr in last few years. Also, why has IT revenue increased? Probably renegotiated some leases?
Mumbai friends - are traffic woes temporary? Will things improve with completion of metro work?
Disclaimer: Exited Nesco in Q1 FY18. Started tracking again and would buy it back at some point.
Thanks for sharing. Interesting to note that as per the report, IT Park-4, which is the next growth trigger for company, is expected to complete by Dec-2018, and lease rentals expected to start flowing in only from Q1-FY 2020 i.e. 12-15 months hence. Till then, Company is expected to report subdued/flat performance
Interesting to note in key risk factors is the upcoming exhibition and convention centre in BKC by Reliance of 0.3mn sq ft. This could provide additional supply in the market and limit pricing power for NESCO.
Further report identifies the management as too conservative in terms of its development plans towards NBEC 1-4.
Pardon me for a very basic and amateuer question. Can someone guide me on the nature of the exhibition and convention business? Is it better than just outright leasing the premises? Are the annual revenues comparable or better than outright leasing the premises.
Came across an article on Livemint and a broker report from Nirmal Bang, highlighting the woes of the real estate sector at large.
Key takeaways: Recovery in the housing sector is at least 6-8 quarters away. The commercial real estate sector is much better placed at the moment and the demand should continue to remain going forward. I believe this bodes well for Nesco.
I think the word “Recovery” is critical here. How do you define it ? On Revenue basis, inventory basis, bookings basis ?? I am invested in some of real estate companies and during Q3 , 1st time sign of green shoots were visible over qoq and yoy bookings data. Yoy may be a demonetisation factor but qoq comparison post smoothening of seasonality can not be ruled out. However, this is just 1 quarter and need to be continued. Looks like on one side of table , bloodbath going on and on other side quality players have started to get benefit though calling out it a trend need few more quarters . This is the kind of inference I had going through concalls of these companies I am invested in.
And as you said commercial realty is in much better shape and there are genuine reasons for that . Residential realty is many times created ON black money , created FOR investment created BY fraudulents where as commercial realty does not suffer from these issues. So, unless the economy/core customer sectors do terribly bad or supply is highly skewed to demand in abundance , commercial realty tend to do better
As far as NESCO is concerned, it is a micro market debt free commercial real estate play. Most of these reports give broad based theme which may not be necessarily applicable to NESCO.
This is related to residential space while nesco is in commercial real estate. There is no slow down in commercial market, infact it is booming. Many large office deals have happened in real estate and valuations have been increasing each year. There is shortage of quality office buildings which are driving demand/valaution !
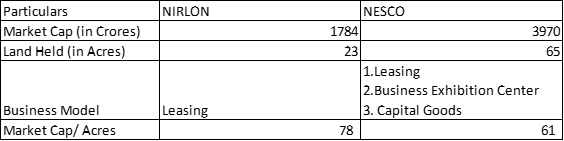
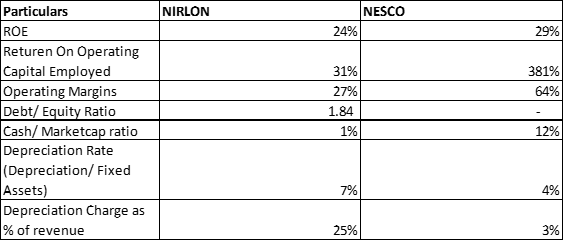
I did a comparative analysis to find out which among Nesco and Nirlon is cheap as i came to know that Nesco IT Parks and Nirlon knowledge parks are both side by side.
Key difference in their business are
Nirlon employs debt for constructing IT parks
Nesco has additionally Hospitality, Exhibition center business.
The following are my observations
I tried to compare the market cap of both the companies with the land held
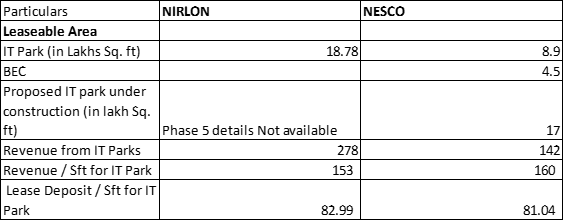
Average rent realisations, rental deposit received/sft for both Nesco IT park and Nirlon IT park are more or less in the same range
I have calculated some of the key ratios and noted the following
Nirlon as a company is using debt while Nesco is a cash rich company
Nirlon is following Wdv method of depreciation while Nesco is following SLM method
one thing which needs clearer understanding is Depreciation as % of Revenue is a lot higher for Nirlon vs Nesco- is it because of buildings of Nesco are old and Nirlon has capitalised borrowing costs there by capitalised amount is high.
Leasable area of building 4 of Nesco will be equal to entire current area that is leased by Nirlon.
Disclosure : Invested in Nesco
Attached Excel file Nirlon Vs NESCO.xlsx (12.5 KB)
U add 12 to existing 7 n almost equal to nirlon. However, with a 1.5 debt equity in a land based business changes whole equation which is evident in return metrics. Disc : not aware of nirlon ,invested in nesco