
In order to make successful investment, one of the key ingredients is huge market size opportunity and hence I keep looking for industries which are going through higher growth curve and market size opportunity is huge. One such industry I have recently come across is man power services industries.
I will try to capture some of the details about this industry. Currently, starting with a two components of this industry: security services and facility management.
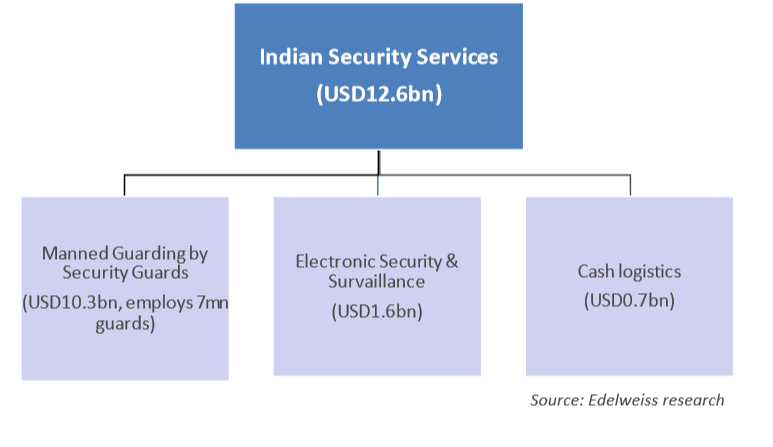
Security Management Services Market
The security services business is divided into 3 major streams:
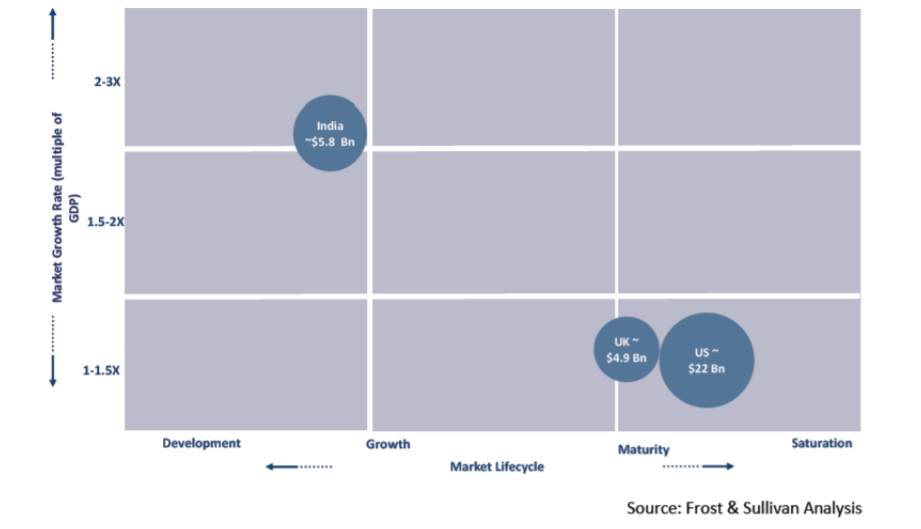
The security services market in India is witnessing high growth due to an improved economic environment, increasing concerns about crime, terrorism, inadequate public safety measures and urbanization. A comparative chart of the growth of security services markets in India, United Kingdom and United States of America is as follows:
The market for security services in India was 169.00 billion in Fiscal Year 2010 and grew at the rate of about 18.20% CAGR to reach390.00 billion in Fiscal Year 2015. The graph below displays historic growth of the security services market in India between Fiscal Years 2010 and 2015:

The security services industry usually works on a credit period of 60 to 90 days from date of completion of services. Many of the smaller operators pay wages only when they receive payments from the customers while most of the larger national players pay wages on a monthly basis. Therefore, the security company has to organize substantial bank loans or funds to meet monthly wage payments and service tax compliance. In addition, security services is a low margin, high volume business. All of these reasons make the security services industry a working capital intensive business. This operating model is not expected to undergo any evolution in the next few years. The primary costs for companies include manpower-related expenses including salaries, Employees’ Provident Fund (“PF”) and insurance.
For the organized sector, pricing for security services is largely dependent on the minimum wages prescribed in each state. Organized companies adhere strictly to the norms related to PF and Employees’ State Insurance Act (“ESI”) and these norms are directly linked to minimum wage payment obligations. According to Frost & Sullivan’s discussions with organized security service providers, pricing has increased at an average rate of 8.00% to 10.00% over the last five years. However, lately, there has been a significant increase in the wages by up to 50.00% in a few big cities including Bengaluru due to the higher cost of living, benefits to retain guards and cost of compliance with human resources and labour statutes. Since unorganized companies do not comply strictly with labour laws, their pricing is more market driven and is low. A more stringent enforcement of labour laws and the increasing cost of compliance will put pressure on the unorganized service providers and work in favor of organized companies.
The industry faces high attrition rates, but that does not mean the guards are exiting the industry. When a large contract is lost or expired, the guards already employed in that establishment will be absorbed into the payrolls of the company that wins or takes over the contract. This is a common business practice in the Indian security services market
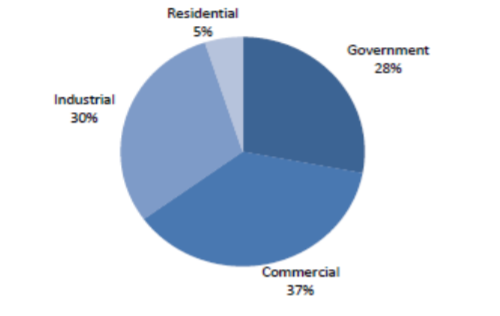
The chart below displays end-user classification for the security services market in India:

The primary end-user segments for security services are the IT and ITES sectors, industrial, banking, financial services and insurance sectors. Together, these segments constitute approximately 80.00% of the total business of organized companies and have adopted global best practices in terms of security services, with high quality control for deployed guards. Organized industry participants cater to these segments chiefly due to their clear emphasis on compliance.
The security services market is highly fragmented and consistent growth in demand has led to the entry and expansion of competition. The following chart displays the competitive landscape for the security services market in India for the Fiscal Year 2015:
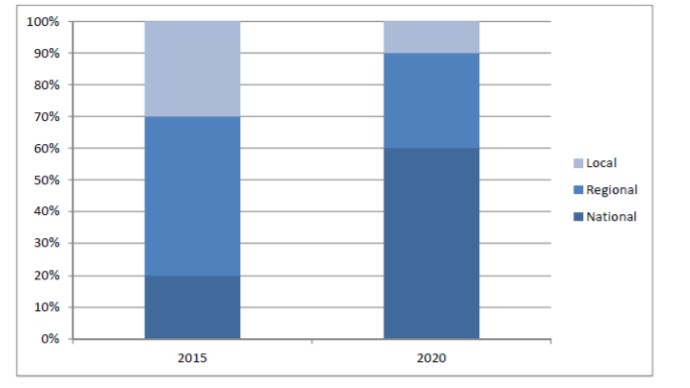
National operators are expected to increase their share of the security services market in India between Fiscal Years 2015 to 2020, as follows:
Several factors favor organized participants, including:
- Compliance Assurance
- Quality Assurance
- National Network
- Experience in Specific Segments
Key Demand Drivers:
- Increasing economic activity and GDP growth leading to need for improved security
- Growth in Wages
- Societal perception on threats and awareness on security
- Asset Creation – Real estate growth
- Asset Creation – Infrastructure growth
- Premiumization and hybrid solutions
- Government warming up to the idea, supporting private security sector
A case in point is Indian Railways.
(https://factsbeyondnumbers.files.wordpress.com/2018/10/103.png)
Also, there is tremendous scope for organized players to garner market share through economies of scale
The security services market in India is likely to grow at the rate of 20.00% between Fiscal Years 2015 and 2020 and achieve market revenues around `970,400.00 million, as follows:

Various players and market share:

Cash Logistics:
Cash logistics services comprise of three functions: ATM replenishment, cash-in-transit (“CIT”) and cash pickup and delivery (“CPD”), with service providers also performing bullion transit, cash processing and cash vaulting services.
Currently, ATM replenishment is the largest segment of the cash logistics services market. Companies deal with managed service providers (“MSPs”) or banks directly to provide ATM replenishment or CIT services. The amount of revenue by functions in the cash logistics industry in India for Fiscal Year 2015 is displayed in the chart below:

The following table displays the degree of outsourcing in cash handling operations across banks:

The table below presents key operational data for the top five cash logistics companies in India:

The cash logistics market in India is estimated to grow at a CAGR of 17.80% between Fiscal Year 2015 and Fiscal Year 2020. The majority of this growth will be driven by the growth in banking sector. As the economy moves towards using less cash, competition is expected to become stiff, leading to further consolidation of the market. Market revenue is projected to increase as follows:

Even though demonetization led to a growth road block to this industry, slowly industry is coming back to normal

Electronic Security Market
Electronic security services involve the installation and commissioning of security systems, products or equipment along with operations and maintenance (“O&M”) services. Electronic security systems include CCTV, alarm systems, access control systems, and other safety related systems such as fire alarms, automatic fire suppression systems and other electronic equipment installed for security purposes.
Electronic security services are provided by large private security companies such as G4S, SIS, and TOPSGRUP who provide both product installation and O&M services. There are several layers in the value chain of this industry, including original equipment manufacturers (“OEMs”), distributors, and systems integrator who compete with the private security service companies.
The electronic security services market in India was estimated at 24,300.00 million in Fiscal Year 2011 and recorded growth at a CAGR of 25.60%, reaching a value of60,500.00 million in Fiscal Year 2015. Demand is driven by increasing awareness about safety, and investments in public and private establishments
The market share by end-user type for Fiscal Year 2015 is displayed below:
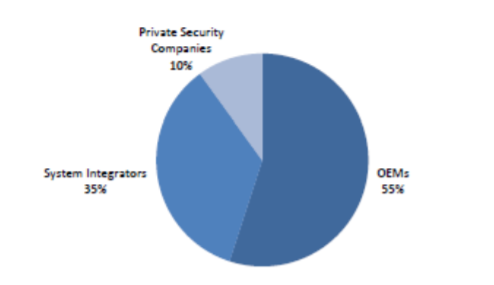
Competition for electronic security services market can be divided into three tiers of competition:
- Large OEMs: that possess system integration and service capabilities dominate the market. With large office networks and distribution capabilities, these OEMs negotiate large contracts with the government or with corporate establishments. OEMs deal with end-customers directly instead of going through systems integrator.
- The second layer of competition consists of distributors and system integrator with installation and O&M capabilities. There are several unorganized companies in this layer of competition. Due to low entry barriers in the market, small players are able to offer products at comparatively low prices. There are more than a hundred companies across India that cater to small regional pockets.
- Lastly, private security companies form the smallest share of the market. These companies offer electronic security services as extensions to their security services. While currently very few private security companies offer electronic security services, they are regardless growing to be an important segment of the competitive structure. As they build competencies in product installation, system integration, and service portfolios, they are able to compete effectively with the large OEMs and dedicated system integrator.
The competition scenario for electronic services in India for Fiscal Year 2015 is displayed in the following chart:
Industry Growth Forecast Rapid urbanization, increasing governmental investments and various technology advances in the domestic market are expected to provide a promising future for electronic security services market. The electronic securities market is projected to grow at a CAGR of 26.60% between Fiscal Years 2016 and 2020, to reach `196,800.00 million by Fiscal Year 2020, as shown in the chart below:

Facility Management Industry:
Facility management refers to the outsourcing of services and functions which are considered non-core activities for a business. In order to improve building maintenance and the efficient operation of facilities, coordinated effort between people and spaces is required. Facility management services can broadly be classified into two types, namely:
hard services: including mechanical, electrical and plumbing maintenance, asset management strategies, planned preventive maintenance services, short-term repairs, heating, ventilation and air-conditioning (“HVAC”) issues, among others; and
soft services: including cleaning and housekeeping, pest control, catering, gardening and landscaping, security services, office support, mail room support, guest house or service apartment management, laundry, production support, among others.
For Fiscal Year 2015, hard services accounted for 40.00% of the market share of the overall facility management services market and the remaining 60.00% share is from the soft services market. Cleaning services contribute around 50.00% of the total soft facility management services market, followed by pest control and other soft facility management services (such as office support, gardening and landscaping, laundry & guest house management, food and pantry services) at 20.00% and 30.00% share, respectively
Market Size and Historical Growth Opportunities
For private sector participation in key sectors of the Indian economy opened up post liberalization, in 1991. By 2000, the economy witnessed a burgeoning business potential from IT and ITES services industry which not only found a strong foothold in the country, but also drove the need for investment in the real estate sector – both commercial and residential segments. As a result, the total facility management market has grown at a CAGR of 16.00% over the last five Fiscal Years. The following chart shows historical revenue from Fiscal Year 2010 to 2015:

End User Segments in India Demand for facility management services is consistently growing with increasing awareness among end-users. End users include offices, hotels, hospitals, malls, residential spaces, the automobile industry, the pharmaceutical industry, electronics, food and infrastructure development. The majority of growth is expected to be driven by growing demand from the commercial sector. Largest facility management companies in India include:

‘Tier 2’ companies have an annual turnover of between 100.00 million to1,000.00 million. They are nationally recognized brands that offer multiple services, have experience of handling medium projects and have regional and state level presence. There are approximately 50 to 80 Tier 2 companies.
‘Tier 3’ companies have an annual turnover of below `100.00 million. They are a locally recognized brand that offer single services and have experience in handling small and medium projects (often as sub-contract work), as well as having state and city level presence. More than 300 companies belong to this ‘Tier 3’ category.
Competitive factors include: integrated service offerings, local market knowledge, retention of skilled workforce, statutory compliance, brand reputation, financial strength, ability to adopt advanced technologies and preventive maintenance techniques.
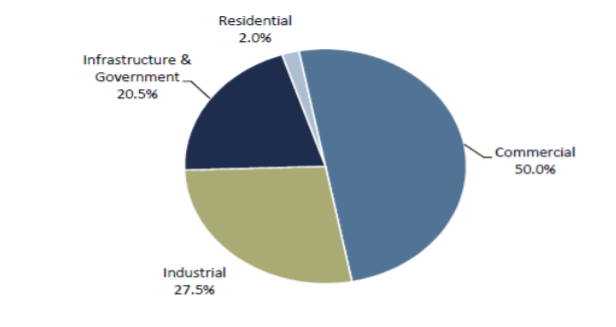
The following chart displays the market potential for organized players by end-user segment in India for the year 2015:

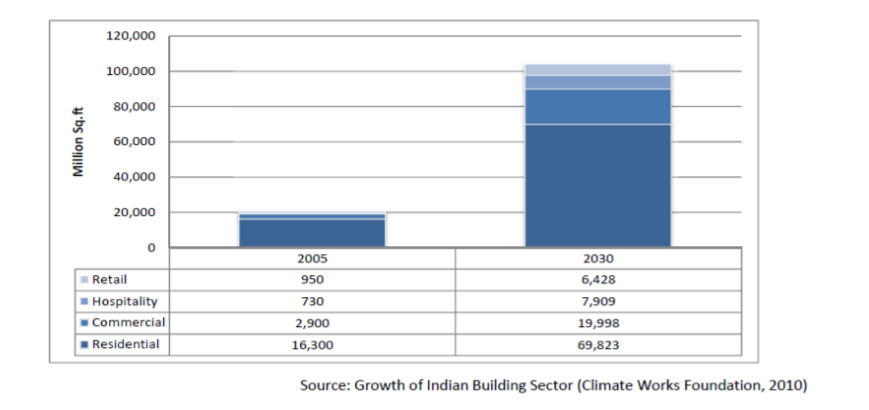
Industry Growth Forecasts The graph below shows the growth of total building stock in million square feet by Fiscal Year 2030 across different user segments such as retail, hospitality, commercial offices, and residential. Coupled with the growth of total stock that is expected to touch about 100,000.00 million square feet by Fiscal Year 2030 and rising tendency to outsource.
The total facility management market in India is estimated to grow with a CAGR of 20.30% between Fiscal Years 2016 and 2020. The market revenue forecast from Fiscal Year 2015 to Fiscal Year 2020 is depicted below:

Hard Facility Management Services in India
Hard services cover building repairs or the operation and maintenance of mechanical, electrical and plumbing systems. Skilled labour is required for both monitoring and maintenance. Examples of services covered include: HVAC systems, boilers, pumps and fire hydrants, lighting systems, fire alarm and detection systems, access control and CCTV systems, building management systems (“BMS”), elevators, switchgears and transformers, back-up power systems, general plumbing, water and sewage treatment and utilities management. Historical revenues for hard facility management services are as follows:

The following chart depicts market share by end users in India, for Fiscal Year 2015:
The following chart is a competitive assessment of the hard facility management services market in Fiscal Year 2015 and as projected for Fiscal Year 2020:

Industry Growth Forecasts The market for hard facility management services is expected to reach 103,714.00 million by Fiscal Year 2020 from40,000.00 million in Fiscal Year 2015 at CAGR of 21.00%. New business opportunity areas affecting the growth of the overall facility management services market include energy management and the remote management of buildings. In many cases, facility management companies include basic services such as energy audits in their portfolios to gain first-mover advantage – energy management services are now also being included in hard facility management service contracts. facility management companies that are well established and aware of the building needs are in a better position to capitalize on the growing demand for energy related services.
The analysis of building efficiency data through remote monitoring of buildings is gaining popularity in developed markets and is expected to make its presence felt in India. Finally, vibration analysis for HVAC equipment is gaining popularity and is likely to be part of preventive maintenance. In the future, use of micro-renewables such as building integrated photovoltaic (“BIPV”), wastewater recycling, and waste to energy concepts will gain a strong foothold in the market and make buildings self-sufficient. These upcoming technologies are expected to have a major impact on the Hard facility management services market. In addition to this, the green building movement in India has increased the opportunity for Green facility management services. Offering energy performance contracting and sustainable strategies to improve building efficiency are some key areas of opportunity for organized facility management companies.
Cleaning Services Industry in India
Cleaning services refers to housekeeping or janitorial services that improve and address health and hygienic concerns. The cleaning industry is considered a separate segment within facility management because of a major focus on hygiene and better care required in certain end-user verticals.
Market participants offer services in three broad categories, namely, standard, specialized, and green cleaning. Standard cleaning includes house-maid/domestic cleaning service, work place and wash room hygiene, carpet and floor care, window and façade cleaning, and vacuuming and upholstering, to name a few. Specialized cleaning services involve cleaning requirements in healthcare, municipality (road and highway cleaning), and industrial cleaning. Finally, green cleaning is the usage of non-toxic or organic cleaning solutions (having low or zero Volatile Organic Compounds (“VOC”)), primarily driven by the growth of the green buildings industry in India.
Driven mainly by the growth of the real estate sector, the cleaning services market accounted for 30.00%, that is, 30,000.00 million of the overall facility management services market in India for Fiscal Year 2015. The cleaning services market grew at 19.00% CAGR from12,570.00 million in Fiscal Year 2010 to reach `30,000.00 million in Fiscal Year 2015.
The cleaning services market comprises of two service delivery models: contract based and on-demand.
Increasingly, India is adopting labour -based contracts with costs dependent on the number of workers provided. These contracts are partly the result of an increase in labour costs due to inflation.
High attrition rates add to the burden, and small companies find it tough to mobilize resources and provide fixed labour counts. Although evolving, square feet based contracts are not popular in India. The on-demand services market currently accounts for just around 5.00% to 10.00% of the overall cleaning services market. The model is mainly designed to satisfy the immediate and speedy requirement of city-centric working community households and is aimed at people working and living in the IT corridors. These on-demand services are mostly catered by several start-up companies (such as Housejoy and Urbanclap).
Commercial establishments such as offices, banks, retail outlets, hotels, healthcare and education, among others, contribute to 50.00% of the market for cleaning services. Rates of outsourcing in this segment are quite high, and most users opt for IFM contracts bundling hard services and technical equipment maintenance. Most big service providers in this space have entered into regional contracts, involving all offices in the region under one contract.
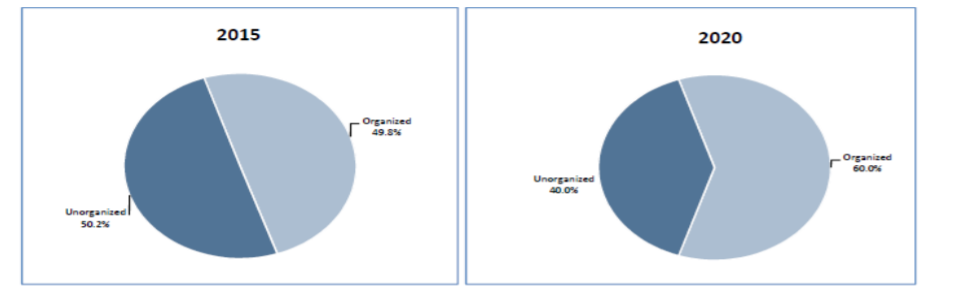
Organized players accounted for 56.00% of the market for Fiscal Year 2015 and are projected to account for 65.00% of the market by Fiscal Year 2020. Some organized players include Bharat Vikas Group (BVG), Updater Services (UDS), ISS Facilities Services, A2Z Group – Infra Services, Dusters Total Solution Services (DTSS), Krystal Integrated Services (KISPL), Property Solutions India Private (PSIPL) and OCS India. Many stand-alone companies also execute cleaning services on contract- and on-demand basis. Recently, many of these have added other peripheral services such as painting, interior fit-outs, and pest control services.
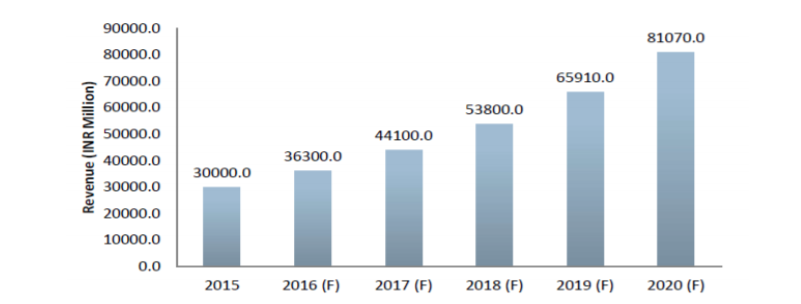
The market for cleaning services in India is projected to reach `81,070.00 million by Fiscal Year 2020 at a CAGR of 22.00%, as follows:
Pest Control Industry in India
A labour -intensive market, pest control services are driven by a growth of economic activity in the country. The overall market for outsourced pest control services in India grew to `12,000.00 million in Fiscal Year 2015, at a CAGR of 8.50% from Fiscal Year 2010, as follows:

Industries such as food and beverages, pharmaceuticals and airports account for 40.00% to 45.00% of the market, while small-medium commercial enterprises (“SMEs”) such as restaurants, hotels, educational institutions and residential areas account for the remaining 55.00% to 60.00% of the market. On-demand services are more popular with residential and SME segments. Annual maintenance contracts (typically once in four months) are the norm
Organized players account for about 37.00% of the market.
The following diagram shows a competitive assessment of the pest control services market between 2015 and 2020:

Meanwhile, many unorganized players still use banned substances such as dichlorodiphenyltrichloroethane (“DDT”) and methyl bromide (for fumigation) which are considered harmful. Food processing companies in India are required to comply with third party audit requirements such as AIB International and British Retail Consortium (“BRC”) food safety standards. Many small pest control companies in India are not able to meet the stringent requirements of these compliances.
The overall market for outsourced pest control services in India was 12,000 million in Fiscal Year 2015 and is expected to grow to21,140 million by Fiscal Year 2020. Rising economic activities, growing urbanization, increasing middle-class population and growing awareness of hygiene and sanitation among end users further increases the demand for pest control services. The increasing middle class population in India has a growing intolerance for pests and associated diseases. The demand for higher hygiene standards continue to rise in public areas and following the government’s ‘Clean India Campaign – the Swachh Bharat Mission’ that will impact the pest control services market in India.
Key Risks Associated with Business:
- Susceptible to criminal litigation and labor laws-based litigations
- Susceptible to labor union related issues
- exposed to service related claims and losses or employee disruptions that could have an adverse effect on our reputation, business, results of operations and financial condition
- Our businesses are manpower intensive and our inability to attract and retain skilled manpower could have an adverse impact on our growth, business and financial condition. Attrition is as high as 80% in unorganized sector and hence scalability is a key challenge
- Wage revision can be a potential risk to profitability as companies may not be able to pass the cost to customers
Overall Summary:
- Tremendous growth opportunity


- Highly unorganized industry even though there is a market shift happening towards organized
- Highly labor intensive industry with very less barrier to entry
- Wafer thin margins and economies of scale is key
There are multiple players listed in this space including security, facility management and other sub industries of manpower services industry:
- SIS
- Teamlease
- Quesscorp
- Apollo Sindoori
- Karya Facility
Data Sources:
This is more of compilation of DHRPs, ARs and Research reports and will be followed by some company analysis in this space