
Screener.in is a wonderful source of information for company financial data. Often, we also use key non-financial data ( i.e. data points not available in financial statements and not available on screener.in) like production & sales quantity, capacity & utilization, order book and order inflow, loan disbursements etc. Such information is scattered in annual reports, IR presentations, conference call transcripts, press releases etc. It is very useful in understanding a business and building conviction.
Until 2011, companies were required to disclose some of this information in Schedule VI of annual reports. This requirement has been done away with as companies argued that this is key information that helps them build a competitive advantage and disclosing that would hurt them so MCA did away with this requirement. This itself shows that information is really useful.
Since 2012 many companies have stopped disclosing key non-financial data while others disclose partial information in director’s report, management discussion & analysis, segment reporting, schedule MGT-9 etc. Recently companies have started disclosing key data in IR presentations and press releases but information disclosed often has a positive bias. e.g. if NPAs start rising, companies will only disclose NPAs as % of assets and that too for last 2 years instead of a 5 year trend. IR presentations can also discontinue publishing a piece of information if it is not positive. Such omitted information has to be dug out from somewhere else and can make or break an investment decision. sometimes having a set of numbers for several years for companies in the same industry in front of you in one place can help build insights into the industry. Experts read a lot and assimilate this information and use their sixth sense to draw valuable insights. For rest of us without a sixth sense, we will need a spreadsheet.
IR presentations and press releases provide a data point about new and latest information but as investors we are more interested in knowing how this new data point fits into a long term trend and how does it compare with similar information from peers. Often, when such information is viewed in the context of a long term time series or in comparison with peers, its interpretation can change. Such perspective can only be achieved if we have enough data points going back several years for at least a few companies in each industry.
Individually, I am sure we collect key non-financial data for the companies that we have invested in and maintain some kind of a spreadsheet. Collectively, we track hundreds of companies. This thread is an initiative to build a common database of key non-financial data using crowdsourcing approach simply by using a Google Spreadsheet that we all can update. Here is a link a Google Spreadsheet that I built using the information I have collected so far.
Screenshot below shows the the format in which data is organized.
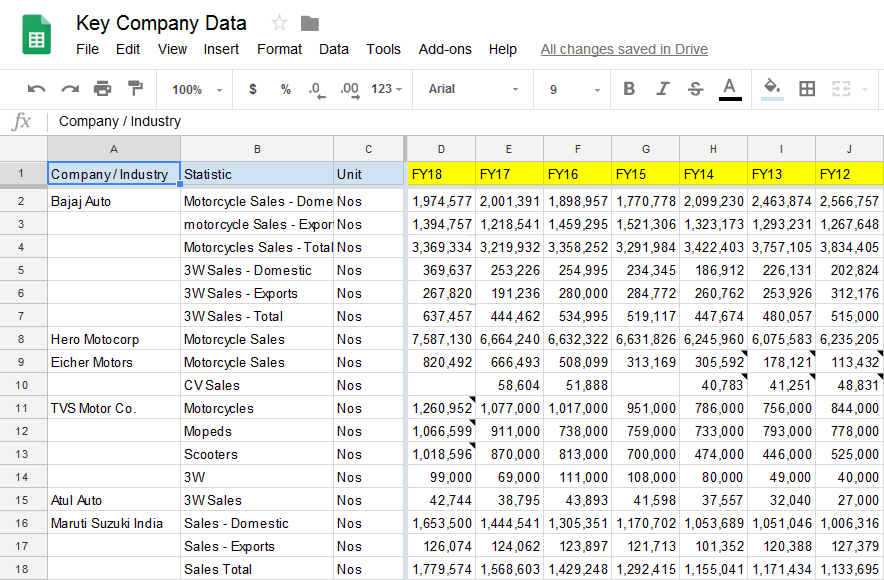
Column A contains the name of company, column B contains the statistic, column C contains the unit of measurement and column D onward contain data point for each financial year. All information presently in this sheet is sourced from annual reports, IR presentations, conf call transcripts and press releases of respective companies.
Capex sheet contain capex plans announced by companies. I just started building this sheet so there is hardly any data there but capex plans is a very useful information so it is also being captured here.
Link above is for read-only access. If you would like to contribute your time and efforts in building this database, PM me with your gmail address (do NOT post your gmail address here) and I can give you edit access provided you agree to follow these housekeeping rules:
Housekeeping rules for maintaining the data
- If you have privileged access to some information (e.g. paid subscription), you should not post that information here. This sheet should not be used for data piracy. This sheet should contain only public information collected by the members themselves. Source of the information (including a link to the source) should be disclosed in this thread.
- Information should be extracted only from first-hand and official source (i.e. annual reports, company presentations, press releases, conf call transcripts, exchange fillings, IPO prospectus etc) and not from second-hand sources like analyst reports or newspaper and magazine articles, blogs, tweets etc.
- Single data points are not useful. Unless you have data points for at least 4-5 years or comparable statistic for 2-3 companies in an industry, do not post that information.
- One-off data point will be lost in time. Unless the data point is published every year, do not post such information.
- This sheet should contain only data series. No analysis or ratios. You can create your own Google Spreadsheets and use IMPORTDATA formula to link data from this sheet for your own analysis.
- This sheet should contain only non-financial data. If a data point is available in financial statements, do not add a series here. This is necessary to limit the number of data series for each company to 5.
- Finally, I reserve the right to delete your updates and revoke the edit access if any of the rules are violated.
This initiative is similar to open source software built by the IT community which has proven to be very useful for software professionals all over the world. Similarly, we can use the power of collaboration to build an asset over time that will help us become better investors.
