Investr.co.in: A Stock Screening System

Yesterday in one of the discussion threads about stock screening systems, I happened to mention the screener developed by me. I was surprised with the interest shown by this community! So I thought of making a separate post about it in case people have any questions, clarifications or suggestions.

Here is the link to my screener: http://investr.co.in

Investr gives a company personalized weighted SCORE based on company’s last 3 years’ and last 5 quarters’ fundamental performance. It also highlights, with green and blue bands, companies that are trading at attractive valuations. Investr also reports whether or not a company’s top-line and bottom-line growth is consistent and if a company is trading above or below its 30 day moving average. All this information is supported via beautiful and intuitive charts.

I created Investr.co.in to answer the following 3 questions:

  • Is a particular company, fundamentally better than another?
  • How are the current valuations of that company?
  • Can I trust the company’s growth consistency and buy the company at current market price?

Investr helps you “narrow your focus” so that you can focus on few good companies for a further detailed investigation.

Why should you use it?

We all differ from each other when it comes to deciding which fundamental parameter is more important than others. Some people prefer stocks with high growth and high PE while others prefer stocks with low PE and high dividend yield. Investr lets you assign weightages to the parameters of your choice so that you can discover "your type" of companies.

Investr comes with 3 pre-defined settings: “Growth”, “Value” and “Fixed Income”. Users who want full control can use “Advanced Options”.

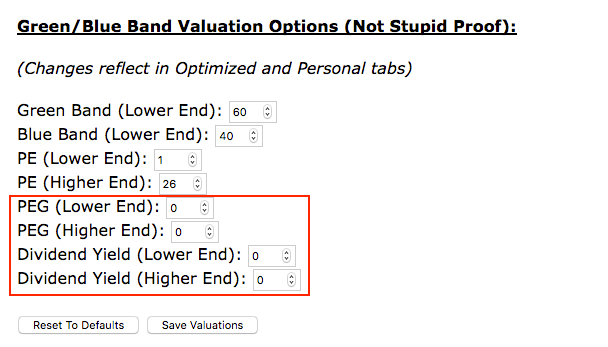
Not just valuation setting, every aspect of InvestR is customizable. Users can set the range parameters for the green and blue bands, tolerance limits for the various searches and more by changes the values in the Settings page.

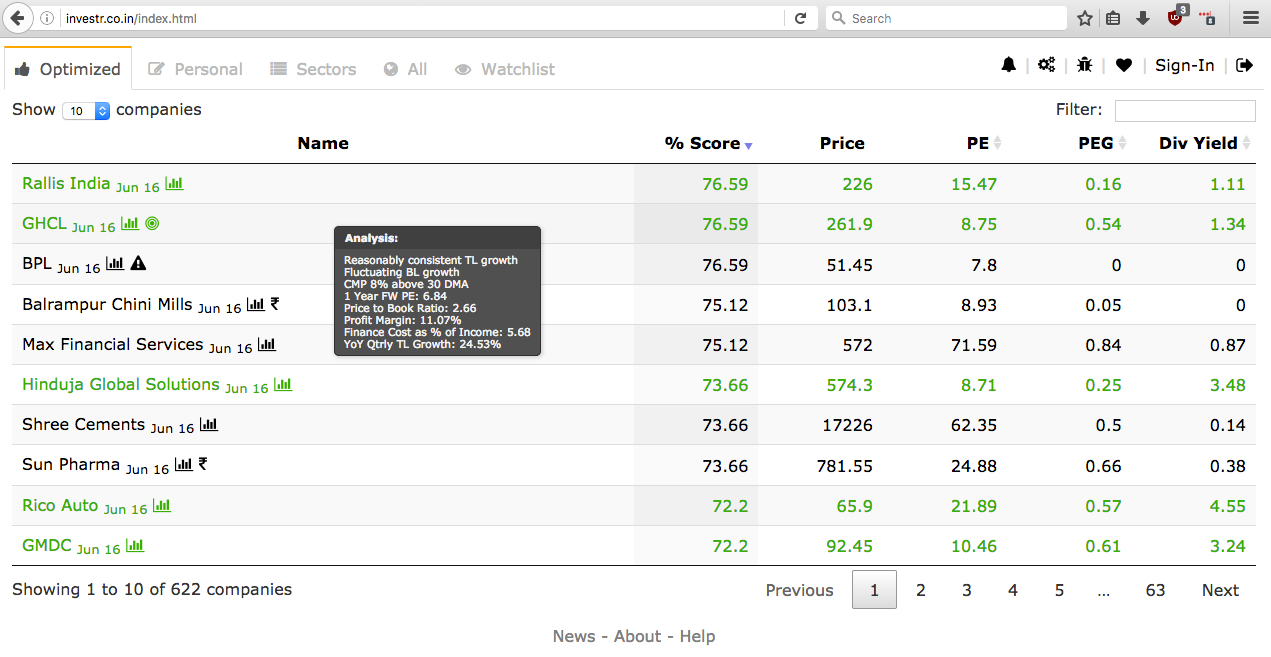
Investr tracks more than 600 companies that account for 97% of total Indian market capitalization. Apart from getting names of the companies with highest (and lowest) scores, you can search Investr to find the ratings and valuations of your favorite company. You can sort companies by their PE (Price to Earning ratio), PEG (PE to Growth ratio) and Div Yield (Dividend Yield). Searching for companies on Investr is ridiculously fast. You can search for companies by their name, NSE ticker, sector or sub-sector. You can create a “Watchlist” of your favorite companies and search for them. You can also filter in the highlighted companies by searching for “/green”, “/blue” or “/all” (without quotes but / included).

The tab labeled “Optimized” with a “Thumbs Up” icon next to it, scores companies using optimized weights. If you want to have a look at fundamentally strong companies without setting your personal weight preferences, then I suggest that you use the optimized weights. I use optimized weights tab 90% of the time.

I have added lots of tooltips across InvestR to provide quick help. These help tooltips can be disabled in the settings page.

How is the score calculated?

The scores are calculated in 3 steps. In the first step YoY, QoQ and TTM growth in fundamental parameters like total income, net profit, earnings per share, profit margin and dividend yield is plotted on a bell curve and given points.

In the second step, points given in the first step are weighed based on the weights given by the user for each fundamental parameter. And in the third and final step, a percentage score is calculated based on the total weighted points and maximum weighted points that are possible.

Optimized scores use predefined weights.

Sign In

Signing into InvestR is optional. All aspects of the site will work without signing in. But if you want to access your setting customization and watchlist across devices then signing in using your Google ID will make your customization portable. Signed in users can also opt in to receive an email when stocks in their watchlist trade below their 30 day moving average. Signed in users will also be able to click on the “heart” icon and make it beat! When a user clicks on the heart I feel loved for the effort that I have put in creating this tool! NOTE: I hate spam just as much as you do, so you will not receive any email from InvestR unless you opt in for it.

How frequently is the data updated?

Data on Investr is updated daily at 9:30am, 12:30pm, 3pm and 4pm IST. The name of the latest quarter that is included in the calculations is mentioned besides the company’s name. (Note: Stock prices on Investr are NOT live.)

I understand that accurate data is extremely important for making decisions in equity investing. I take great care in making sure that the data on Investr is accurate. At the same time, it is difficult for a single individual to verify all the details of more than 600 companies. Please bring any data anomalies that you find to my notice.

Note: If a company has reduced its face value and split its shares in the middle of the financial year, then it might lead to inconsistent dividend yield calculation.

Disclaimer
This is the part where I say, information provided on this site is purely to draw your attention towards companies that need further detailed personal investigation and this site does not give “tips” for buying and selling stocks.

Contact

I am a software engineer by education who quit my programming job few years back.I am a medium/long term investor who loves to code! You can mail me at: contact@investr.co.in

Here are come screen shots:

Main Page:

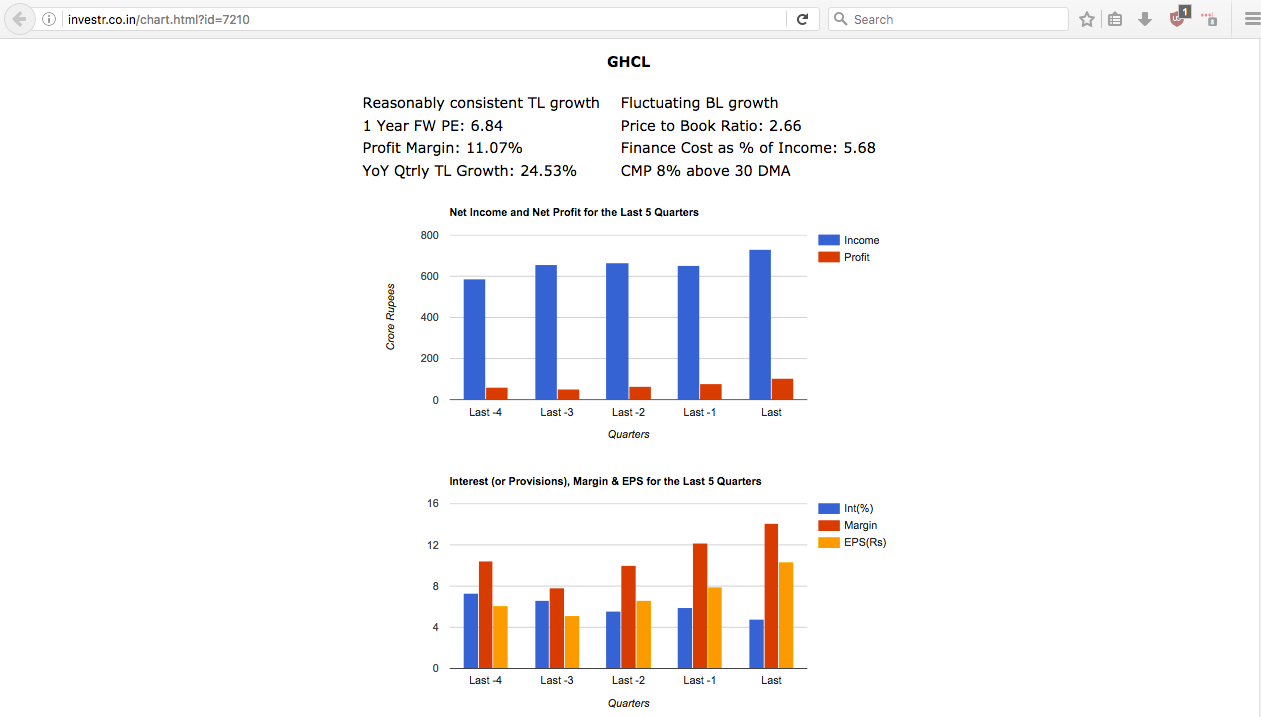
Company’s Bar Chart:

Sector Based Comparison Chart:

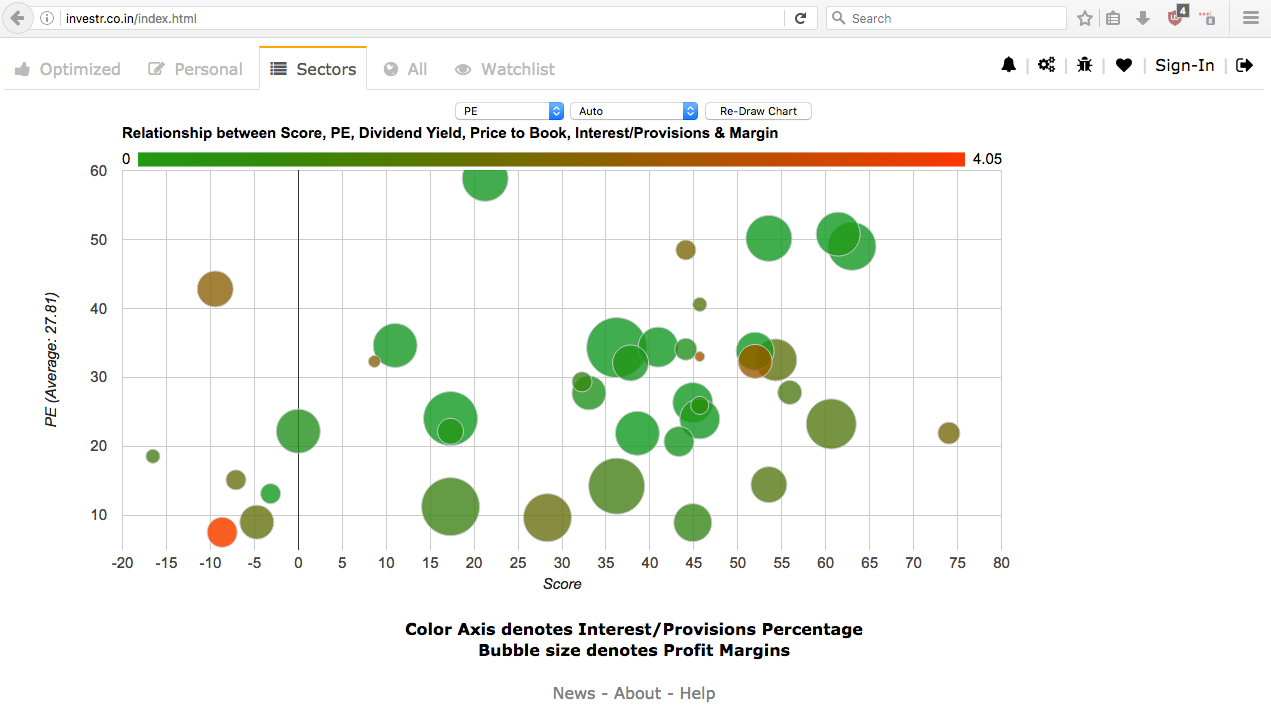
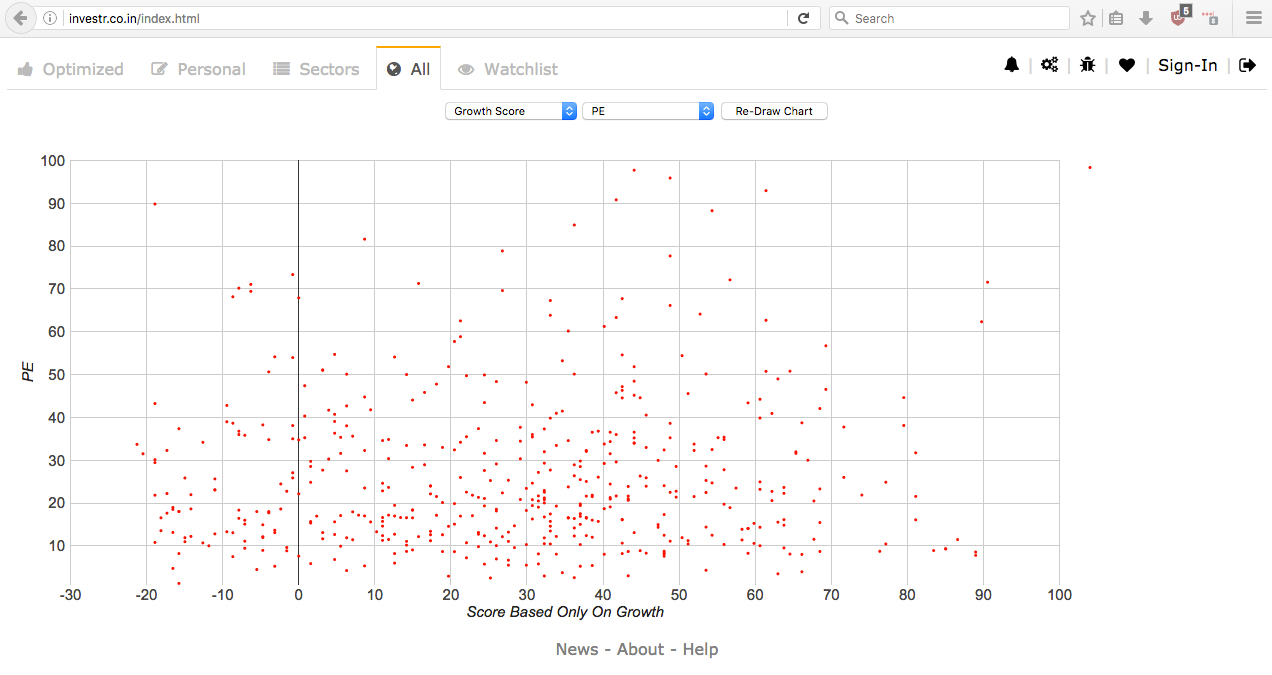
All Companies In One Chart:

21 Likes

I received few emails saying they searched for some company and it was not found. In such situation you can either mail me or add a comment here. I will add it.

Hi Investr,
Great Screener…it will be good if you could add Time Technoplast
Regards

Added Time Technoplast.

Thank you for the appreciation!

Thank you…:slight_smile:

Great tool!!! Must appreciate the hardwork… Still learning…

Thank you!

Please do read the Help and About sections to get maximum benefit by using various search tags.

Try and experiment with combining various search tags.

1 Like

hi investr,
thanks for your great initiative and hard working effort . Really hats-off :ok_hand:.
i just have a small confusion .
The PEG value is showing very much different from Scanner and InvestR .
for example , Avanti feeds , in scanner its showing 0.13 but in InvesteR its showing 4.81 .
could you plz have a lookinto it .

regards

Thank you Debjit for the appreciation.

My PEG calculation is: PE/Growth,

Where growth, is the EPS growth of last year (FY16) vs TTM (last four Qtrs).

Some sites use growth numbers for full year i.e. FY 16 vs FY 15.

For Avanti feeds, if you observe, TTM EPS is 35.77 and FY 16 EPS is 34.68 … small growth. If I had used FY 15 vs FY 16 growth then the PEG values would have been lower

Generally Q1 is a difficult quarter, so an PEG might be high after Q1 on InvestR because I use TTM EPS.

I believe in using the most recent numbers, better safe than sorry.

You will also see that, the I calculate finance cost as, interest paid as a percentage of total income. I do this rather than use the standard debt equity ration because I can get the latest finance cost every qtr but most companies dont publish their debt equity ratio every quarter.

Excellent Investr !!!
it was missed in my observation .
thanks for your detailed clarification , much appreciated .

Regards

1 Like

Yes one more thing.

You can use the “Tolerance” options in the Setting page and set a higher limit for PEG (or any other parameter).

This fine tuning on tolerance is based on your experience with good companies and will keep changing as the financial year progresses and stock price movement.

Then you can search for companies like Avanti Feeds (and Avanti Feeds itself) when you search with the tag: /all

1 Like

Thanks Chirag for the wonderful screener. There are some discrepancies in PE/PEG calculation of V-guard. In screener.in it is 43.29/1.89 respectively and in investr.co.in it is given as 4.3/0.27? Thanks again for the effort you are putting in and sharing with others!

Hi Saji,

Thank you so much for bringing this to my attention. The PE discrepancy was because the stock had split and I needed to update the new share number in the system which is 10 times more. It is now fixed. There is a new value for PEG too.

As for the PEG:

You will see some difference for PEG across systems based on what growth number people consider. My PEG calculation is: PE/Growth,

Where growth, is the EPS growth of last year (FY16) vs TTM (last four Qtrs).

Some systems consider FY 15 vs FY 16 growth. Some try to do some forward looking calculations.

Generally Q1 is a difficult quarter, so an PEG might be high after Q1 on InvestR because I use TTM EPS. I believe in using the most recent numbers, better safe than sorry.

You will also see that, the I calculate finance cost as, interest paid as a percentage of total income. I do this rather than use the standard debt equity ration because I can get the latest finance cost every qtr but most companies dont publish their debt equity ratio every quarter.

You can use the “Tolerance” options in the Setting page and set a higher limit for PEG (or any other parameter).

This fine tuning on tolerance is based on your experience with good companies and will keep changing as the financial year progresses and stock price movement.

Then you can search for companies like VGuard/Avanti Feeds (and VGuard/Avanti Feeds itself) when you search with the tag: /all

Thanks again for pointing out the share split discrepancy and helping make the system better for everyone! :slight_smile:

I have implemented a new search tag for finding companies that have a “diamond” after its name. A company is marked with a diamond if it is looking great on the following 3 parameters:

  • Good fundamental growth (Good TL, BL and profit margin growth and low finance cost)
  • Good medium/long term valuation (PEG and PE values)
  • Good short term price (CMP less than 30 DMA)

You can search for such diamond by using the search tag: /minefor

So basically now you can /minefor diamonds! :wink:

NOTE: If the search filter does not return any rows upon searching with /minefor then it means that there are no diamonds based on your setting parameters. Try tweaking the parameters in the settings page.

IMPORTANT: Note that a diamond company does not mean that you go ahead and buy it. Some companies (like Welspun India) might show a diamond because of some recent events that have not been factored in their financial statements. I also strongly advise people to check the volumes and price volumes data for the companies.

I hope you like this new feature and discover many diamonds! :slight_smile:

Dear Invest R,
is it possible to introduce a price-volume break out i.e. increase in price along with 3 to 5 times increase in the average volume of preceding 1 or 3 months. This will help understand the Fundamentals along with technicals.

Just spent few minutes and I’m already impressed. Glad to see something new. Really liked the data shown when we hover over a stock.

1 Like

Dear Prasad,

I have been thinking of creating a price volume break out notification system for quite some time now. It may not be a part of InvestR because investR is a fundamental screening system and not technical.

I will announce it on this thread if I get to coding it!

Thank you!

2 Likes

Nice Work.

Keep it up…

1 Like

That will be great…

New Feature

To get filtered in the /all, /blue or /green searches the company should satisfy the following 3 conditions:

  • Score should be higher than the numbers mentioned in settings
  • PE should be in the range mentioned in settings
  • Div Yield should be in the range mentioned in settings
  • PEG should be in the range mentioned in settings

This feature affects the Div Yld and PEG aspect.

Instead of having fixed DY and PEG values in settings, I have made them more dynamic.

Now you can set the values for DY and PEG to 0 (zero)

With this settings, DY and PEG go in “auto mode”. Which means when these 4 values are 0 (zero) system will dynamically return true for any company where DY is greater than PEG!

This settings will help because:

  • Now you don’t need to explicitly keep changing the values of DY and PEG
  • You will be able to catch companies with a littler higher PEG but with really high DY
  • You will be able to catch companies with low DY but really low PEG

Of course you can always put fixed numbers of your choice if you don’t like the “auto mode”