I have added support to search/filter based on market capitalization: /largecap, /midcap, /smallcap.
So now you can search for mid-cap pharma companies that are trading below their 30 day moving average with the following search: /midcap /pharma /price
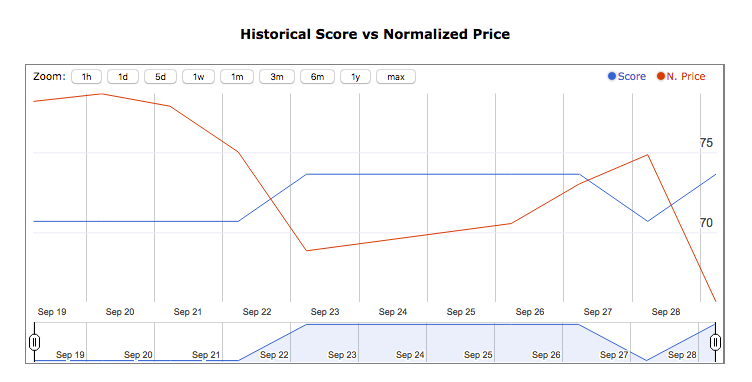
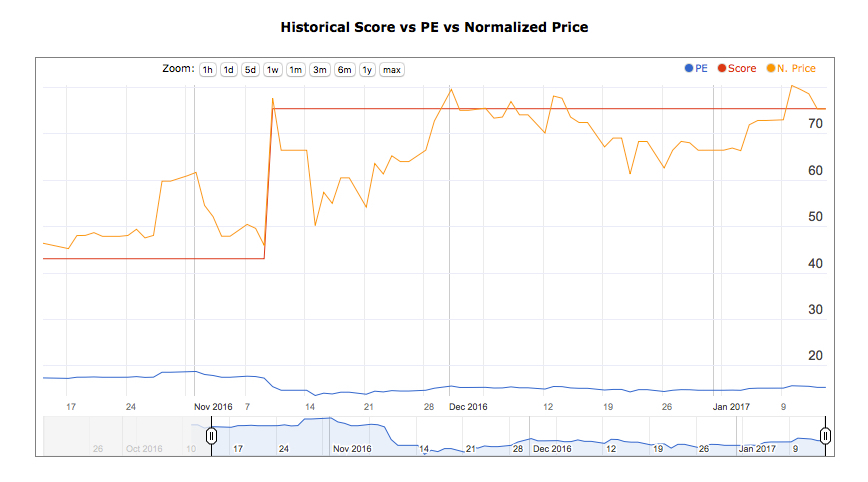
Clicking on besides a bar char icon besides the company’s name will open a detailed chart page that now has a timeline chart that scores historical scores along with the fundamental parameters of a company.
Note that, As the score is a combination of fundamentals and valuations, in the short term, a fall in stock price might increase the score a bit (couple of points) as the valuations become cheaper and vice-versa. But big changes to score will occur after the quarterly results as a change to the fundamentals of a company has a stronger effect on score and over a period of an year or so, price should move in sync with the score.
Historical score database is updated at 5:30 PM IST on weekdays.
Considering that we are approaching the Q2 result season, I believe that this feature will be very helpful in tracking a company’s performance.
PS: If you cannot see the new chart then please force refresh the page as the old cached page might need to be flushed out.
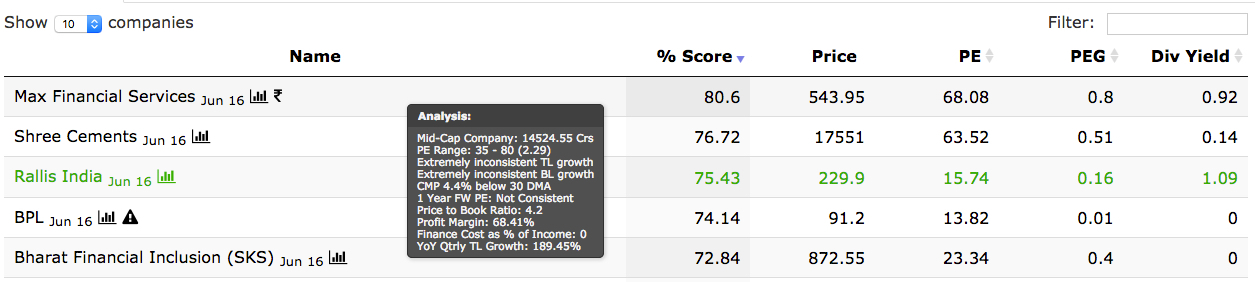
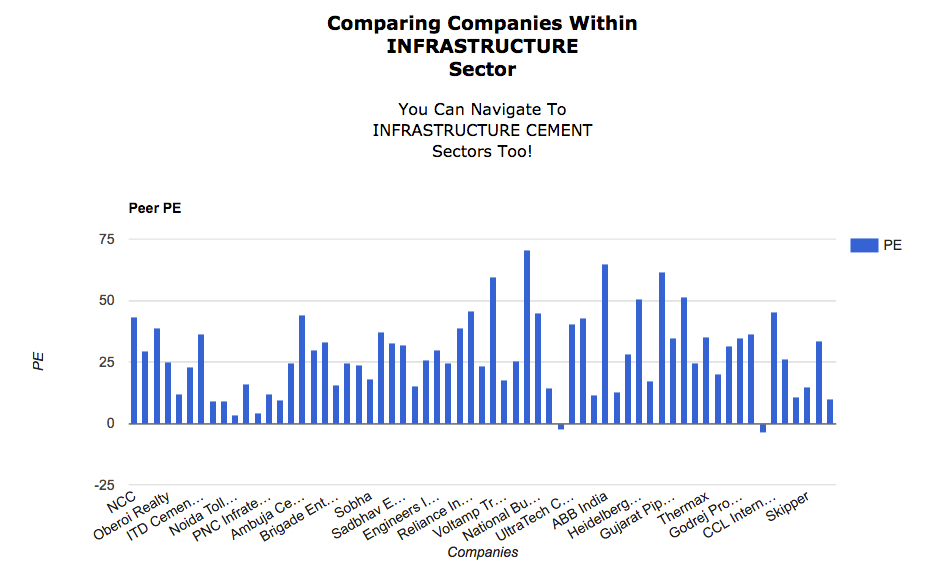
As you are aware companies trade in their own PE band based on how the market values the sector of the company and the company itself. If we observe a company over multiple years we can see that there is an average-approximate lower and higher band for every company and the company’s PE stays within this band for most of the time. When the PE of the company falls below the lower end, it comes up again rather quickly and when the PE of the company rises above the higher end, it comes down again rather quickly. Hence it makes sense to track these higher and lower bands to see how the company is currently valued.
It is also nice to know the High-PE/Low-PE ratio. Companies with a ratio close to 1 can be considered more consistent valuation-wise. I created a histogram and found 1.5 to be a good boundary for consistency. Which means that companies for which the ratio is between 1 and 1.5 can be considered consistent.
All this information is available in the “Analysis” tool tip and on the charts page.
I understand that users might be interested in knowing ALL the companies that over valued or under valued wrt to PE. So I have made search/filter tags for the same.
/pelow : Search for companies with current PE BELOW its “approximate-average-lower-end-PE below which the stock does not stay for a long time”.
/pehigh : Search for companies with current PE ABOVE its “approximate-average-higher-end-PE above which the stock does not stay for a long time”.
/peconsistent : Search for companies for which the high and low PE does not vary too much.
So now you can find companies that are consistent both fundamentally as well as valuation wise by using the filter: “/consistent /peconsistent”!!!
Of course, when a stock gets re-rated based on its performance the High/Low PEs ranges will not be valid and time needs to be given to see of the stocks settles down in the new range and creates new High/Low PE ranges.
So the beauty of my system is the score are NOT fixed! Score are based on “weights” of different fundamental parameters. And each user is free to choose weights based on their risk profile. Weights can be set in the “Settings” page and the score on the “Personal” tab will reflect the change.
As for data:
I get the stock price from Google Finance.
Old yearly/quarterly data I have have got from MC.
And I update the latest quarterly results manually as and when the results come in.
I see that TVS Srichakra publishes its “Consolidated Results” ONLY on years basis. Its quarterly results are only “Standalone”.
To maintain, data consistency (as I compare TTM data to last years data), I need the company publishing consolidated results to do so on quarterly basis too.
As a result I will not be able to add TVS Srichakra.
Personally I am not very comfortable with the book values calculation done by the companies, except banks, and hence do not give a lot of importance to price to book value ratio of companies (except banks).
As a result I do not plan to store and display historical book values of companies.
Please note that, unlike many other screening sites, InvestR works on the growth of 12 parameters (TL, BL, EPS, profit margin, finance cost, div yld etc) that I can get EVERY quarter from the profit/loss statement of the company.
So I calculate the score (which is the center of the system) based on the growth of these basic parameters.
Thank you,
Chirag
Edit: Forgot to add. The reason I don’t add ratios and information that is available on other sites is because … that info available on other sites we can always look it up there! I want InvestR to show info that is not available on other site … which is the customized percentage score based on an individual’s risk profile.
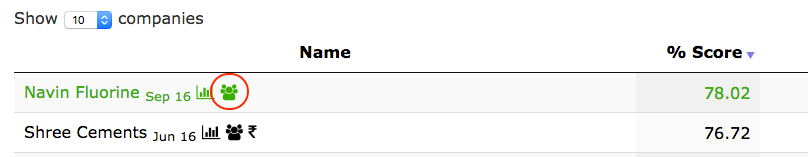
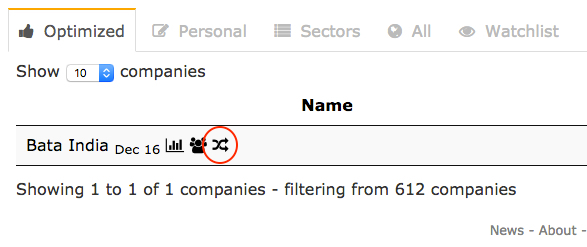
During the result season, it is possible that even after all our due diligence, few of our companies don’t come out with better results. Either the growth falls or the margins dip. During other times it is possible that the stock of our well performing company becomes overvalued and we would like to book profits in it. In such situations sometimes we might be interested in better opportunities. I have tried to ease this search with “Replace Company” feature to InvestR.
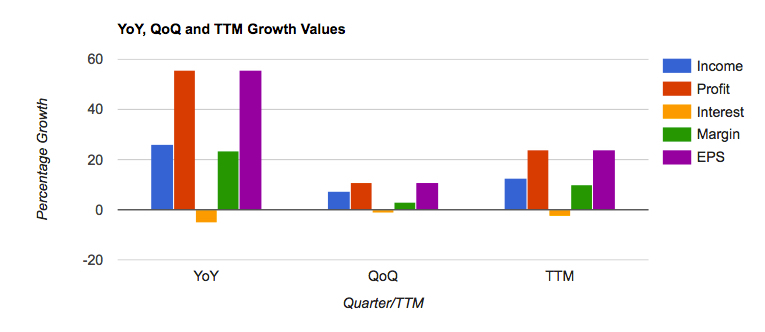
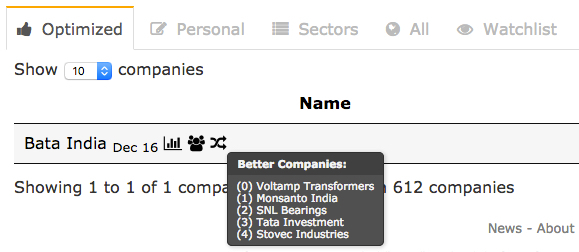
Upon hovering over the “Replace Icon” one can see companies that are better than the selected company wrt the following parameters:
Quarterly YoY growth of TL, BL and EPS
Quarterly QoQ growth of TL, BL and EPS
Yearly TTM growth of TL, BL and EPS
Better profit margins
Higher dividend yield
Lower PE
These values also have a 20% tolerance range.
It goes without saying that, one needs to analyze the companies returned as “better” for consistency, valuation amongst peers and any other current news flow about the sector and the company before making any final decision.
@investr - Happened to stop-by at the website. I understand you have done most of it by your own - single handed by converging two of your interests together - Love for coding and zeal for investment.
I spent most of 2016 working on InvestR. Now I update the qtrly result and add features as and when required. I am happy that you liked my work.
As I had developed the tool for my personal use, here are some tips on how you can use InvestR:
Best way to start with InvestR is to read the About and Help pages and the various tool-tips that I have put on the page (tool-tips can be disabled in the settings page once you are familiar
with the site).
InvestR is highly customizable. Both weights and tolerances can be changed to your specific needs but if you don’t have time to do the customization then you can use the Optimized score and default tolerances.
Then you can try the various search tags. Search tags can be combined!
For example:
/largecap /tlgrowth /margin /price /consistent
will show large cap companies with YoY qtrly topline growth greater than 10% AND profit margin greater than 10%, AND with consistent growth AND whose price is less than their 30 day moving.
/peconsistent /pelow /consistent
will show companies whose PE range is small and whose current PE is less than the lower band PE and with consistent result.
If you don’t want to spend time in combining multiple search tags then you can just go to the Gems tab and buy the stocks listed there.
When I say buy, I mean you have to slowly accumulate them. I.e. If you want to put 25,000 rs in one company then you should buy 5000 rs of stocks at one time and buy them spread over multiple days or after every 3%-5% fall in price. Please note that stocks listed in the Gems tab can stay where they are or fall over a period of 2-3 months. So one needs to be patient. Considering InvestR is fundamental analysis tool investments made with InvestR’s help should be held for 9 to 12 months (unless the score falls drastically … i.e. goes below 20 or if the valuations become very expensive because of rapid price rise).
NOTE: Sometimes a company can appear in the Gems tab because of a recent company specific negative event. In such cases exercise caution. In any case please do your due diligence before making any investment.