Banking Industry is vital to any capitalist economy. It converts small savings into debt and equity capital that fuel major investments to take the economy to the next level. While this forum has excellent information about individual companies, sometimes an industry level discussion is beneficial to all investors as industry level analysis is essential for anyone investing in any company.
Since banking is a commodity business, finding the best bank in terms of efficiency, costs etc is important in making an investment decision. I was unable to find reliable industry level data even from RBI that is useful from an investor’s perspective.In absence of a industry level data, I decided to dig up some data for major banks and prepared a peer analysis so that banks can be compared with each other before making an investment decision.
Following charts presents the data for some of the largest banks in India in terms of assets or market cap. These charts are prepared using standalone number that contain only the core banking operations and exclude other non banking operations like security and insurance etc to make the data comparable.
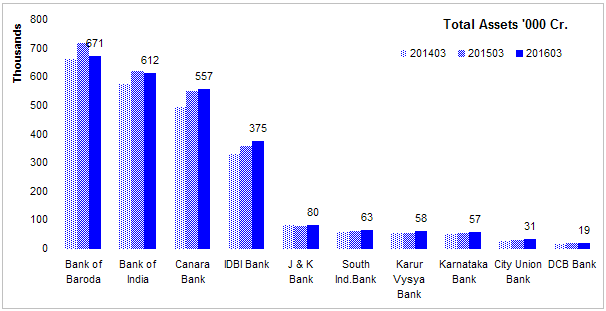
Size - Chart below shows some of the PSU and private sector banks and size of their balance sheet. SBI is bigger than top 5 private sector banks combined.
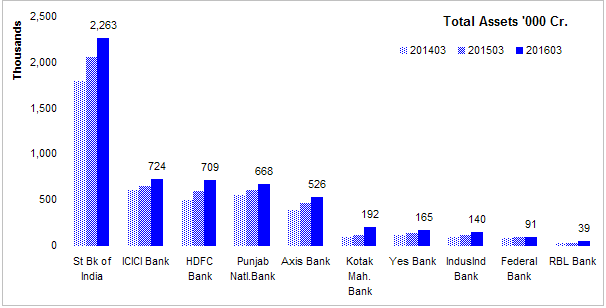
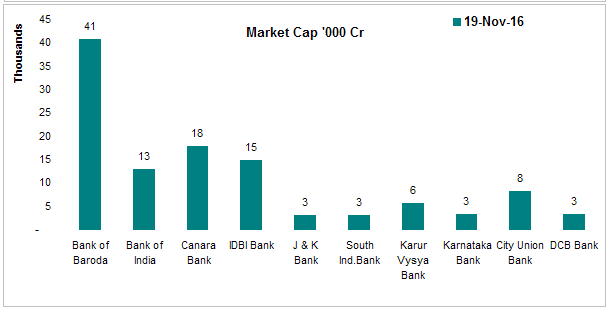
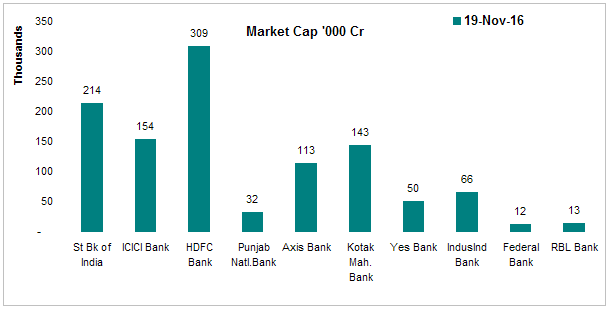
Higher assets does not automatically result into higher market value.
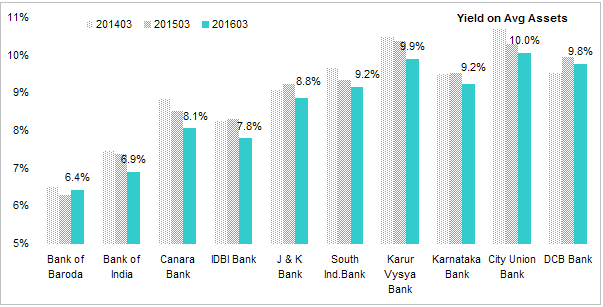
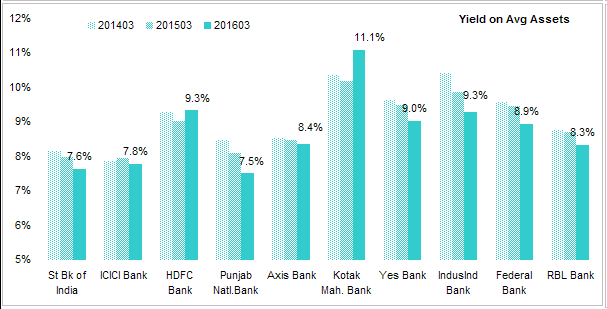
Yield on Avg Assets - Most banks in India are basic Savings and Loan institutes that borrow from public and lend to public, corporates and government. Each of these borrowers have a different risk profile. Banks in this analysis lend to all three but at varied proportions and risk profiles. Large banks have comparatively lower yields implying that they are offering reduced interest rates for wholesale customers. Another reason is they also have lower cost of funds.
Kotak tops with chart while big PSUs (SBI, PNB) have lowest overall yields.
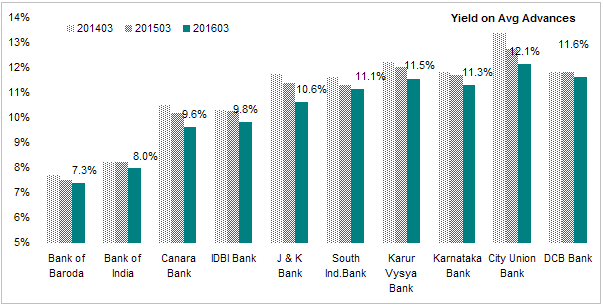
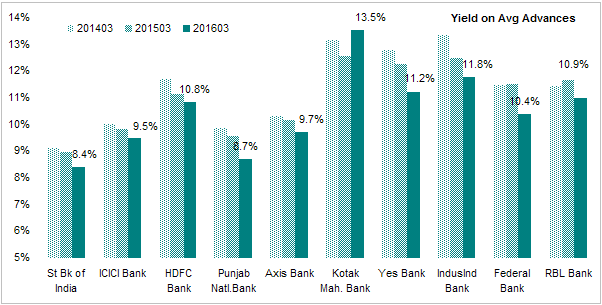
Yield on Advances - Since banks hold a significant portfolio of govt securities in which they are just price takers, Yield on advances is a better measure of how bank is lending. Advances are the loans made to private borrowers like general public and corporates.
Here, difference between large and medium size banks is more visible. Kotak, Yes and Indusind have higher yields than their larger peers.
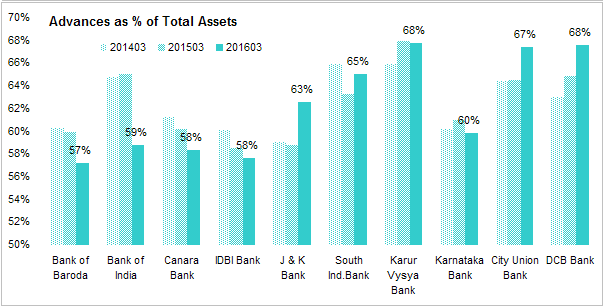
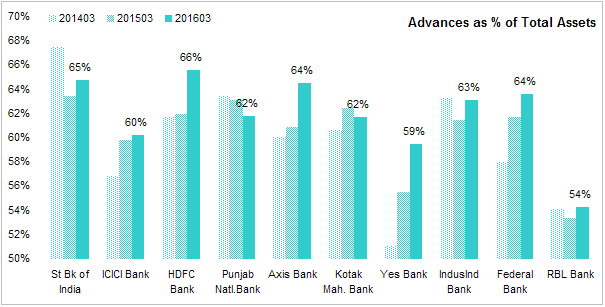
Advances as a % of Assets - Banks have to invest 25% of their portfolio in govt securities. Depending on perceived credit risk, banks choose to lend to corporates. How much assets banks are parking in govt securities market is an indication of overall credit risk in the economy.
Over last 3 years, PSU banks have curtailed their lending to private sector due to rising NPA while private sector banks have filled the gap by increasing their lending at attractive rates. Yes Bank has made the most change from govt to private sector just when economic growth was picking up over the last 3 years. Whether that was a co-incidence or a strategic decision is not known, the result is it has lower NPA ratio than others.
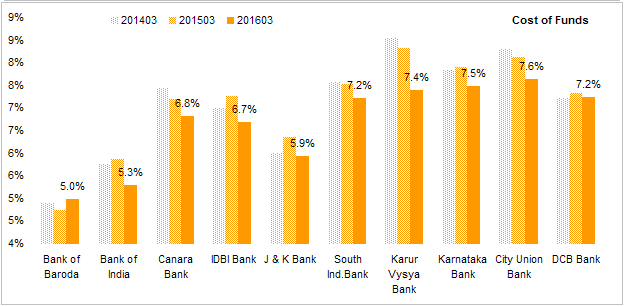
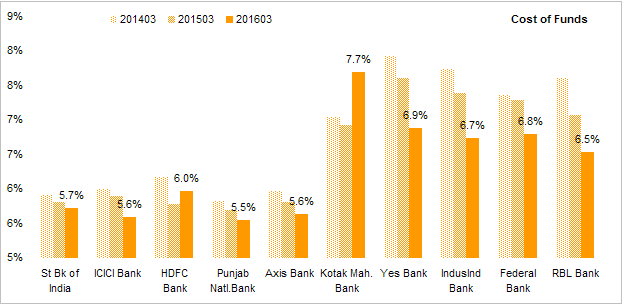
Cost of Funds - Banks have access to public deposits and that is a big advantage. Banks have the lowest cost of funds compared to NBFCs, HFCs etc. Larger banks have a definite advantage over here while medium size banks are fast catching up.
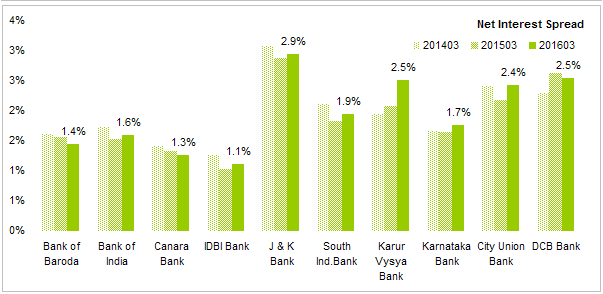
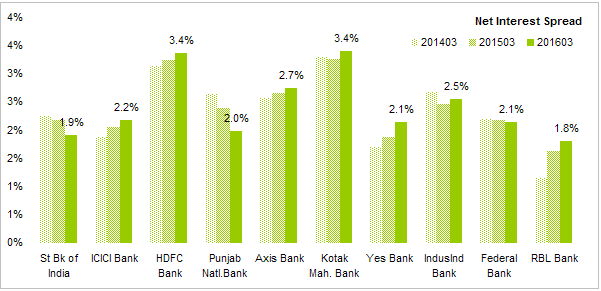
Net Interest Spread - This is the difference between the interest rate that a bank earns and interest rate it pays to its depositors. HDFC and Kotak tops the chart while PSUs are that the bottom.
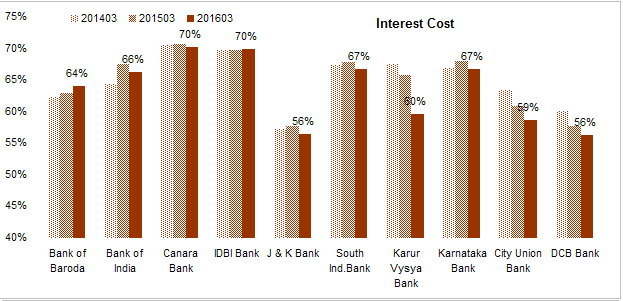
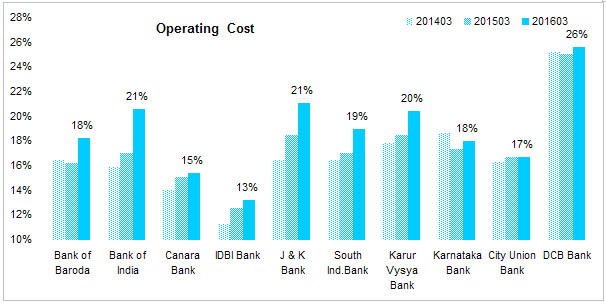
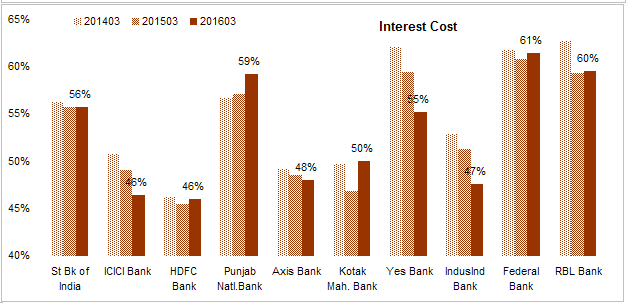
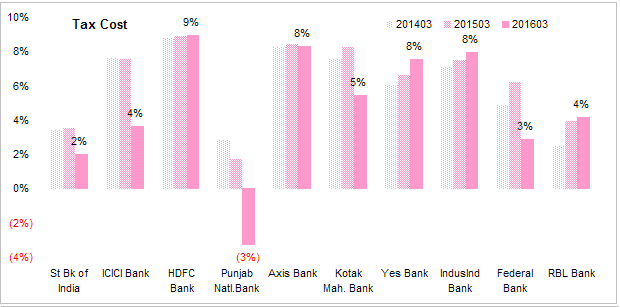
Next few charts compare the cost structure of banks. Total cost are divided into Interest Costs, Operating Costs Credit Costs and Tax Costs. Costs + Profit Margin should add up to 100%. All cost component are represented as % of Total Income.
Interest Costs - This is the biggest cost component. Although PSU banks have lowest costs of funds, they are not able to charge high interest rates to their borrowers thus their interest costs are higher than private banks. Private banks score well here with their low cost of funds and higher yields on assets, they are able to keep their interest costs low. HDFC tops this chart while ICICI Axis and Indusind are close. Yes bank is making progress but has some distance to go.
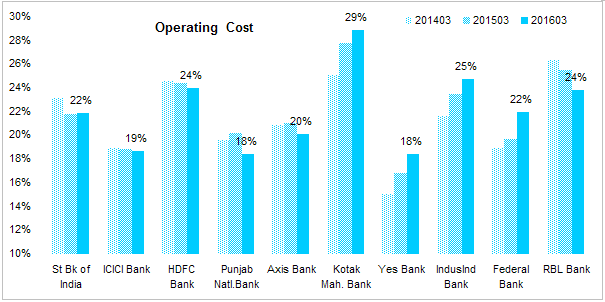
Operating Costs - This is total of all the costs except interest, provisions & write-offs and taxes. This is the cost of operating the branch network and backoffice operations. Yes bank has a lead here but its costs are rising.
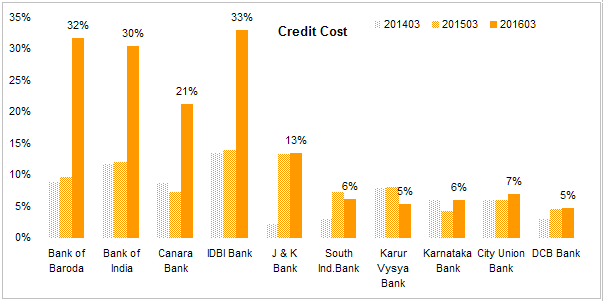
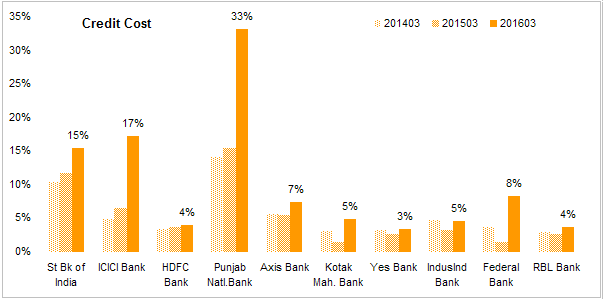
Credit Costs- This is perhaps the most important quality indicator. This is the amount a bank has to set aside to cover current and future loan losses. PSU banks have seen a sharp rise in this cost. ICICI is also looking like a PSU bank now. Yes bank tops the chart with lowest credit cost.
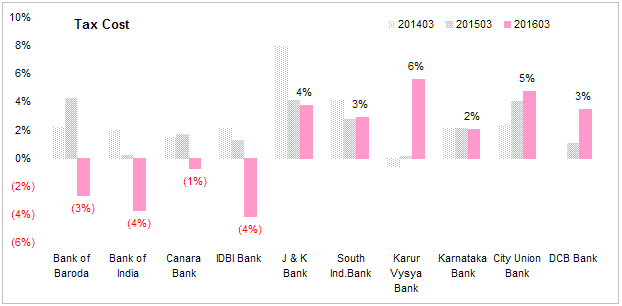
Tax Costs Since banks don’t get any tax sops, tax costs should converge to average over time. Banks who have made large provisions have reported lower tax costs.
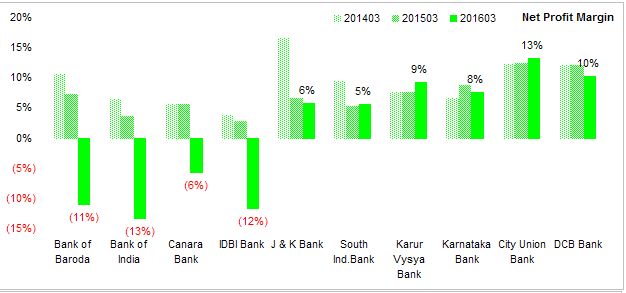
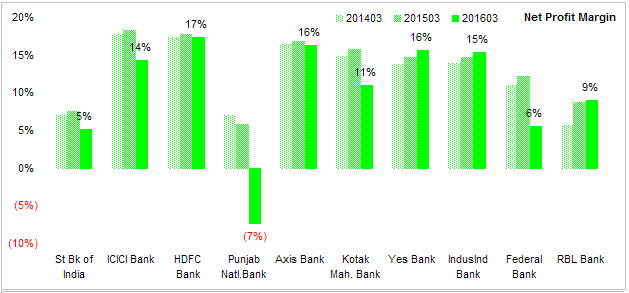
Net Profit Margin This is the amount left after all costs are paid and provisions are made. Private sector banks are a clear standout with HDFC topping the chart. Yes and IndusInd are close. Axis has seen its profitability decline this year (2016-17). PNB has posted loss due to surging NPAs.
Shareholder Return Ratios
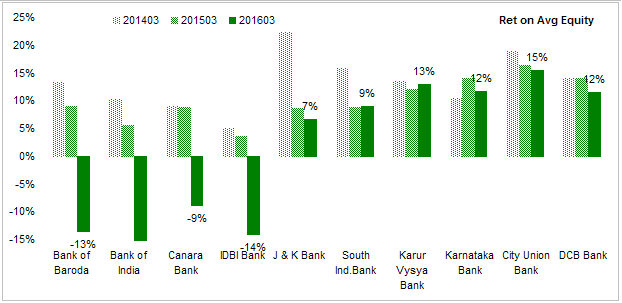
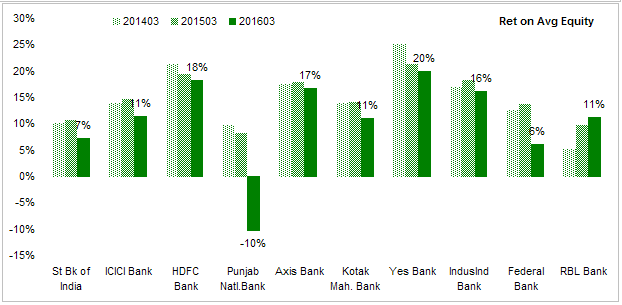
Return on Average Equity - The best shareholder return indicator. ROE of the industry has seen some decline due to higher NPAs in recent years. Banks like Yes and HDFC have posted some decent numbers. PSU banks should be happy to earn a single digit ROE. That will make them better than many Maharatna PSUs.
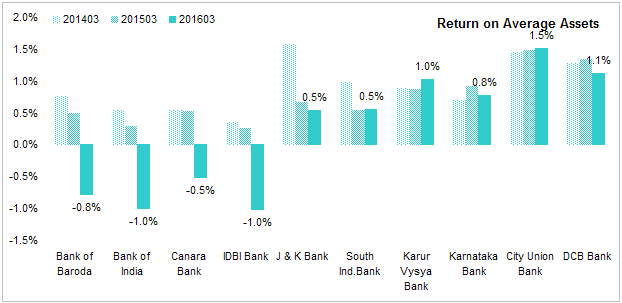
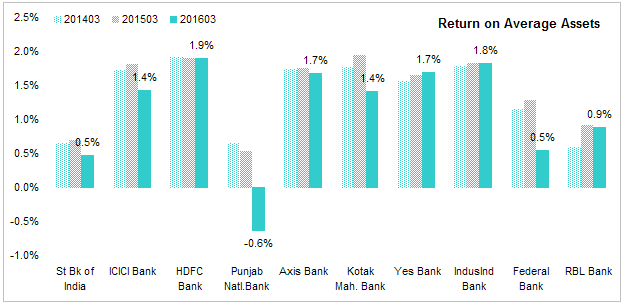
Return on Avg Assets - A bank can earn high ROE by leveraging its equity with debt but in the process it is increasing it risk also. Return on Avg Assets measures profitability without the effect of leverage. HDFC and IndusInd are the top 2 banks in the metric.
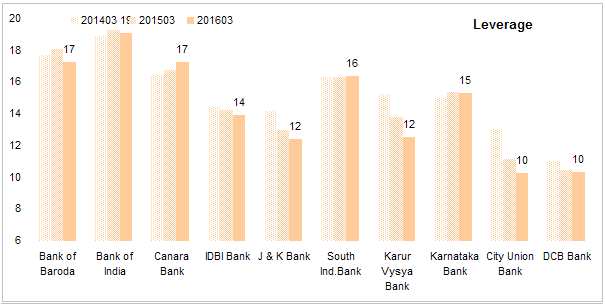
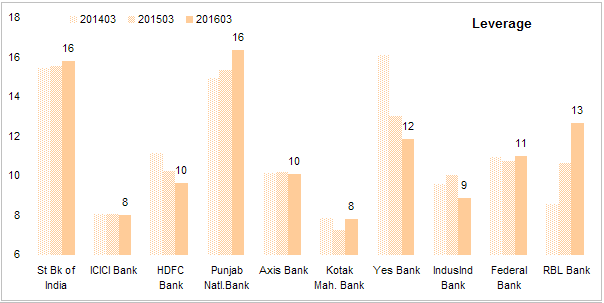
Leverage - Banks are highly leveraged. Leverage is one of the most important risk indicator of a bank. This is the total assets/ total equity. Even if a few loans default, bank’s equity can be wiped out. PSU banks with their implicit govt backing are the most leveraged. This is the classic moral hazard of govt guarantee. PSU bank managers will lend recklessly without fear of bankruptcy as in the event of a crisis they will get bailed out by the govt. Private sector banks have no such luxury. They are cautious.
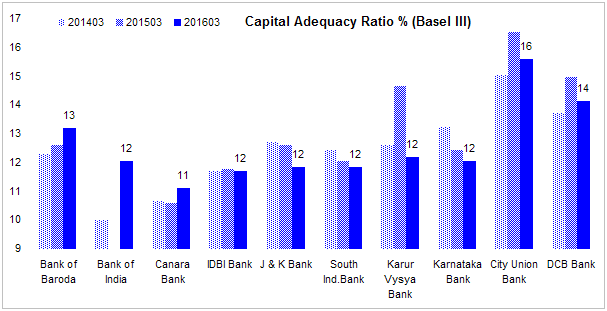
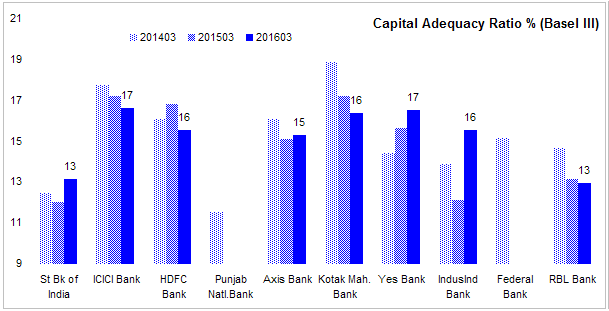
Capital Adequacy Ratio - Since a bank holds significant % of government securities, a true picture of risk is the equity as a % of risk weighted assets where govt assets are considered (credit) risk free and assigned a lower risk weightage. Housing loans also carry a lower weight. Banks in India are significantly above the Basel III requirement of 9%.
Non Performing Assets
Banks routinely get into trouble when borrowers default. Credit appraisal is one of the key skill that sets a good bank from a bad bank.
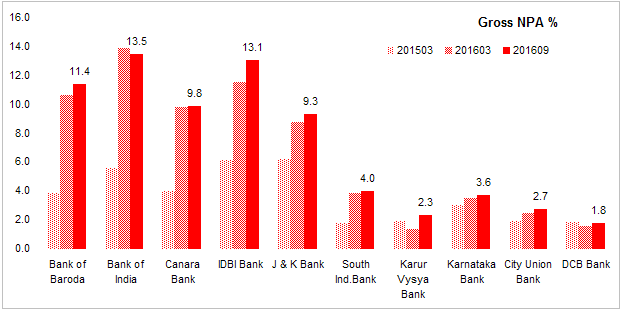
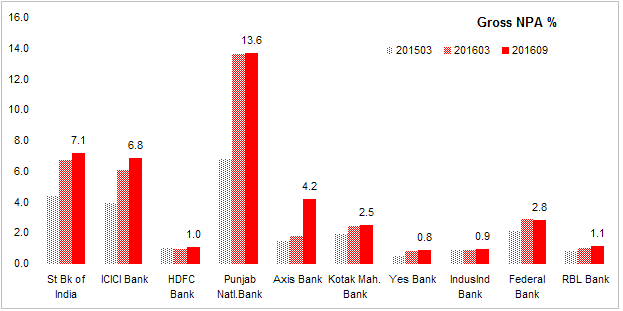
Gross NPA % This is ratio of assets classified as non-performing to total assets of the bank. PSU banks have seen a surge in NPA in recent years. ICICI is just as bad in getting credit risk wrong and Axis is following the lead of ICICI.
Yes, IndusInd and HDFC have managed to keep their NPAs low even when others are struggling.
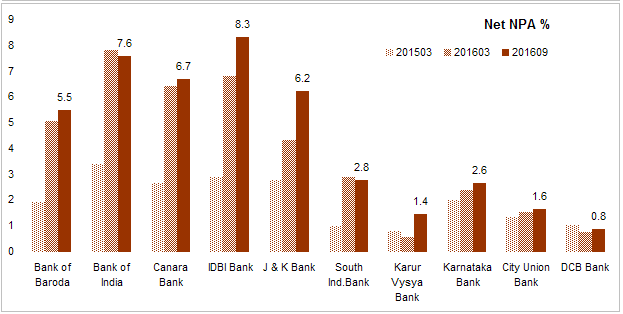
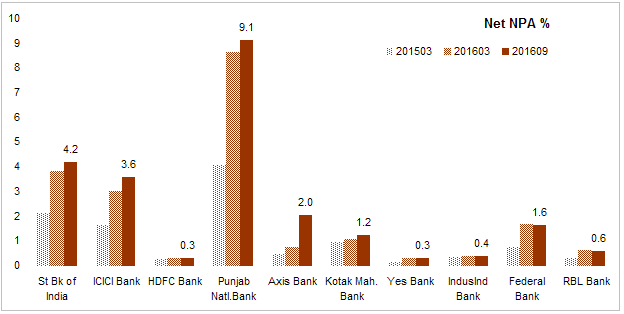
Net NPA % Banks set aside some of their profits to cover the losses on loans they made each year and also when they anticipate loan losses to exceed their previous estimates. This is called provisions. Net NPA is the Gross NPA minus the provisions. This is the number that shows how much bad loans have not even been provided for. Should these loans go bad, bank will take a hit on its profits.
Technically this number should be close to zero as banks are suppose to provide for loan losses but banks are generally optimistic and think that bad loans will turn good (and some of them do) but quiet often they have to make a catch provision.
PNB, SBI and ICICI are sitting on huge pile of bad loans while Axis is seeing its loans are going bad a fast rate. IndusInd Yes and HDFC are the best banks here.
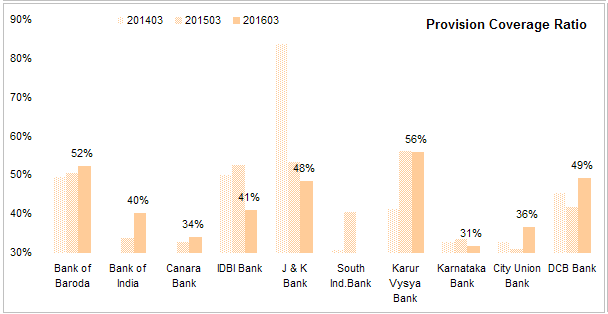
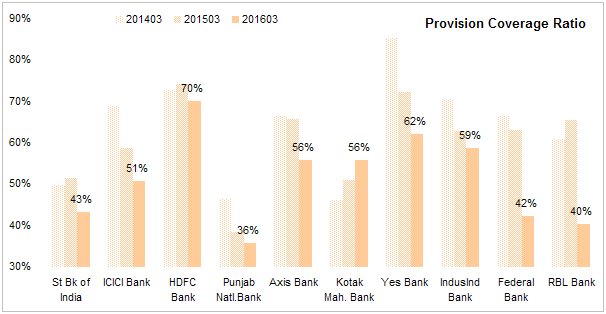
Provision Coverage Ratio - This is the ratio of provisions to gross NPA. This shows how much of the bad loans are already provided for. Ideally this ratio should be close to 100% with international standard is at 70%. Only HDFC meets that standard. PNB despite making huge provisions, is still under-provisioned. ICICI is also fast losing its provision cover.
Valuation
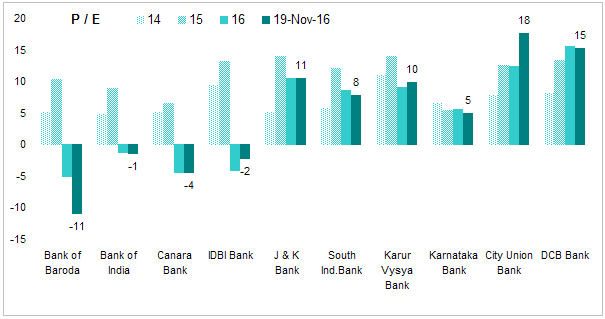
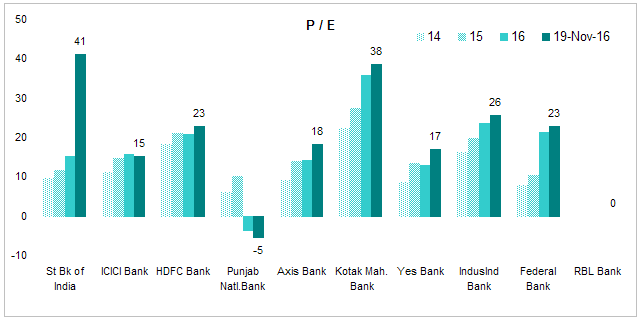
Price to Earnings Ratio - most popular price multiple. This ratio is calculated using annual average price divided by year end consolidated EPS. PE for 19 Nov 2016 is current price divided by TTM consolidated EPS.
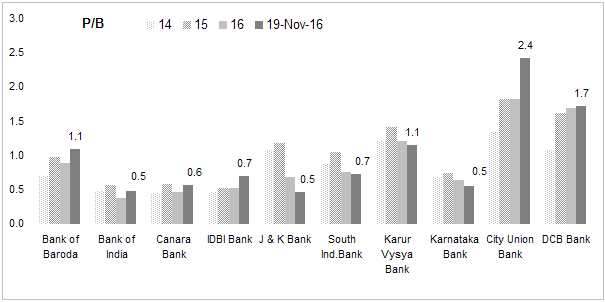
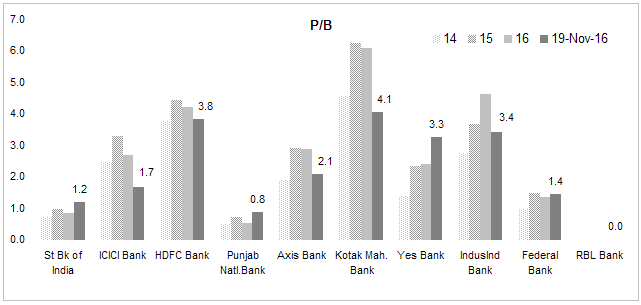
**Price to Book Value ** - Banks are generally valued using PB rather than PE as equity base determine how much a bank can scale its operations. This is also calculated by taking annual average price divided by year end book value per share. PB for 18 Nov 2016 is current price divided by TTM BVPS.
Conclusion - HDFC scores well in most of the metrics while IndusInd is close second. Kotak also score well but its numbers are skewed by acquisition of ING Vysya Bank. All 3 banks are also highly valued by the market so there is not much margin of safety. Yes Bank is making good progress and its valuation is also fast catching up. ICICI and Axis are losing their position among the highly valued (in terms of P/B) due to their poor performance in recent years. Market never valued PSU banks highly and many are selling at deep discount to book value indicating market has no confidence on whats in their books.
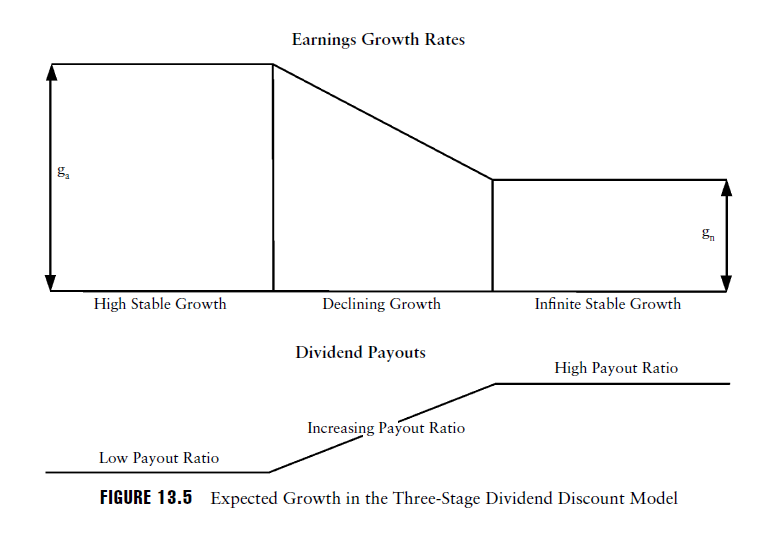
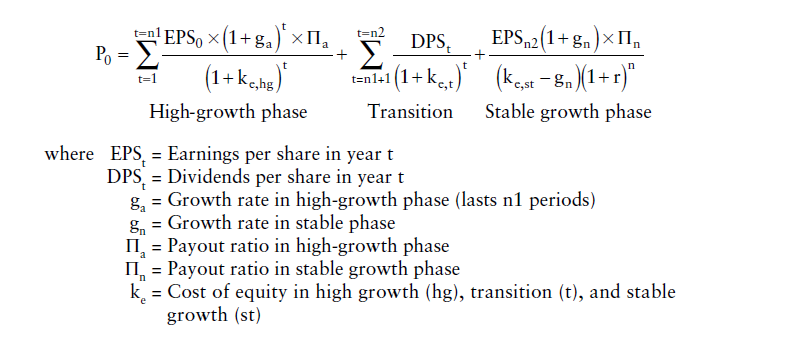
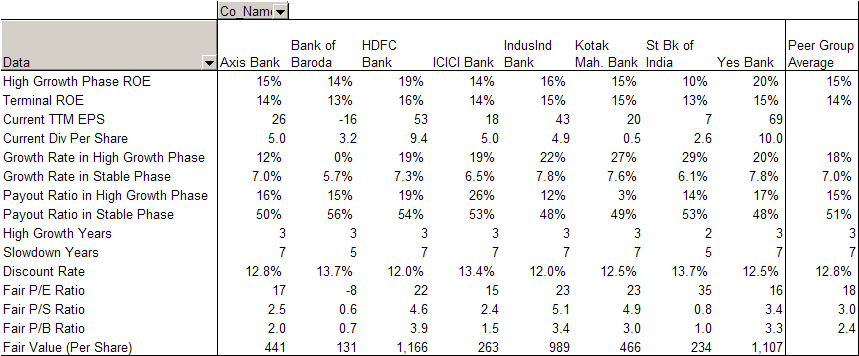
This is already a very long post. In another post I will include fair value calculation of these banks.
Disc - Invested in Yes Bank.