
Is there an arbitrage opportunity. Buy Capital first @ 673 vs. 723 (13.9 x 52-IDFC Bank)
.
am I missing something here?
disc. Tracking not invested
Is there an arbitrage opportunity. Buy Capital first @ 673 vs. 723 (13.9 x 52-IDFC Bank)
.
am I missing something here?
disc. Tracking not invested
One year old article on IDFC
A few more articles on IDFC over the years.
Even I have been tracking the prices for a month now thinking it is an arbitrage opportunity but the price difference has remained almost the same. If it were an arbitrage opportunity it would have disappeared by now. Not sure what I am missing though. May be experts here can shed some light
Disc: I am invested in CAPF
The Competition Commission of India (CCI) has approved the merger between IDFC Bank Ltd and Capital First.
http://en.brinkwire.com/213328/what-hasnt-happened-in-past-50-years-will-happen-in-next-five-v-vaidyanathan/
A very indepth interview with V. Vaidyanathan
CAPF is now trading at 1.5X trailing Capital/ Book value. Capital is at 3900 Crore and Market cap is at 6100 Crore. Isnt this being too pessimistic? Thoughts?
Results announced
More than 40% growth yoy, more than 10% qoq. I don’t see any NBFC or pvt banks performing that well except for may be RBL Bank. IDFC bank is dragging it down otherwise Capital first deserve to trade atleast at a price of 1000.
The -ve is that Its provision/writeoffs are at around 18% of total income, while for BajajFin its at 8%.
Its come down to 2.3 p/b and 20 p/e. Business in an ROE expansion mode. Its ROE expected to be in line with other great NBFCs, 18-20%. IMHO The stock certainly deserves good multiples, were it not for the IDFCB merger.
Is there a chance the merger could fall through?
Disc. interested
Could someone help me understand:
AUM is ~27K cr, GNPA is 1.62% meaning ~437Cr non performing loan.
Then how come FY18 Provision is 641Cr and why NPA is still 1%?
Am I missing something?
Thanks in advance!
1.62% is left after the provisioning
Thanks @abhishkjain2626
Is it? As per my understanding Net NPAs = Gross NPAs - provisions. And GNPA goes down only after write-offs. No?
Provisions are done each quarter. It is possible that the provisions made in Q1, Q2 and Q3 were written off by the end of Q4 of FY18. So total provisions for FY18 ((Q1+Q2+Q3+Q4) may end up being lower than the GNPA post write-offs by the end of Q4.
Correct me if my understanding is wrong. In case of Loan write off we need to provide ( provision ) for the entire loan . In case of Net NPA = Gross NPA - Provision. Is this understanding correct ?
A simplified explanation (there are various nuances and caveats in actual scenario), but trying to present basic case:
Say a loan of 100 becomes NPA. So gross NPA is 100. Say bank takes provision of 20% in year 1. Hence provision is 20 and net NPA is 80. In year 2, it takes 20% more provision. So provision is 40 and net NPA is 60. Gross NPA is still 100. If bank continues same provision policy then at end of year 5, provision is 100, net npa is zero. Gross npa is 100. In year 6 when it writes off the loan, there is no additional provision since it is fully provided for already in year 5. So there is no additional P&L impact when it writes off in year 6.
If for some reason bank decides to write off the loan in Year 3 itself, then it has already taken provision of 40 in Yr 1 and 2 and hence has to take provision of 60 in Yr 3. In this case, NPA at end of yr 2 was 60 and this is fully written off with the impact of 60 being felt in Year 3 P&L statement.
Till the time of write off, the Net NPA figure is included in Loans outstanding. Once it is written off, it goes off from loans outstanding as well as from net NPA figure and NPA %.
Situation becomes a little complex when the loan becomes NPA in year 1 and is written off in Yr 1 itself. My guess is that CAPF is doing this (or, has a higher proportion of such loans; i have expressed this concern earlier in the thread). They aggressively write off loans so that Net NPA number that gets reported appears low. However, they aggressively book new loans also, since they have to show growth. This is like running on a treadmill which increases speed every minute (ie. loans getting written off) - you have to keep running faster (keep booking new loans) just to be in the same place. The analogy i had given earlier was that of a bucket with a hole that is getting larger. You have to keep increasing the pace at which the bucket is filled just to ensure that it remains full.
Broadly speaking, look at yoy and cagr of income growth, pat growth, loan growth and write off (or provisions) growht and you will get the picture. Efficient lenders have pat cagr always higher than income cagr and loan growth cagr. Write off (or provisions) cagr should be much lesser.
Thanks @sammy11 & @pranav_pratap
If I add back the write-offs then GNPA is ~5.35% which is higher than 2017. Attaching my calculation, let me know your views:
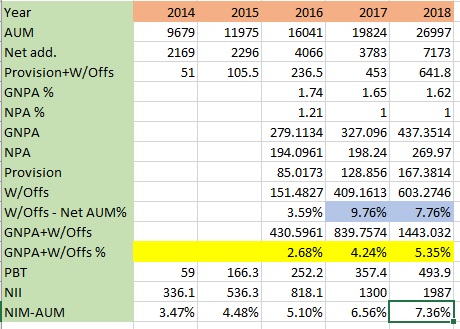
GNPA.xlsx (10.6 KB)
Can you explain what are trying to look when look the GNPA + w/offs? What do you wish to visualize/interpret about the business with the metric?
Thnx
I wanted to check how bad the loan book is & how much risk it carries. GNPA @1.62% didnt give a clear picture due to write-offs. And as @sammy11 had given an analogy, wanted to check if the hole in the bucket is getting bigger and weather it is manageable or not.
Also, wanted to check if the company becoming prudent in loan disbursement or not. And as “W/offs - Net AUM%” declined in FY18, it is a positive sign.
Disc. Invested.
@prashbglr : great efforts in compiling the table for getting a comprehensive view. Please see below comments:
I guess “W/Offs” are understated in the above calculations. “W/Offs” done during 2017 should be calculated as below:
“W/Offs” (during 2017) = “Provision”(end of 2016) + “Provision+W/Offs”(during 2017) - “Provision”(end of 2017)
"W/Offs"(2017) = 85.0173 + 453 - 128.856 = 409.1613
While in the table it is showing as 324.144 write-offs done for 2017. Similarly it is significantly off for 2018 as well.
I guess you subtracted the year end “Provision” from yearly “Provision+W/Offs” to derive yearly “W/Offs” done for the year without taking into account the fact that there were “Provision” Outstanding at the beginning of the year as well.
GNPA+W/Offs% calculation should be done on write-off adjusted AUM. Currently calculations are adjusting numerator (GNPA) for write-offs but denominator (AUM) is not adjusted net-off write-off. So, it doesn’t really convey the correct asset quality picture.
Can you look into these points or share the excel version so that we can analyze in detail.
Post that, it will be good to derive insights from this data.
Thanks @h_nazkani for reviewing the data.
#1. I am not sure if it is correct. “Provision (end of 2016)” has already been made on 2016 GNPA, so remaining NPA is shown in NPA(2016). And further provisions were made on those loans in 2017 if not writen-off which is part of “Provision+W/Offs(2017)”. So I dont think we need to add it again.
#2. I agree, I have corrected the data in original post and shared the excel also.
Thanks!