Decent return ratios (for a PSU), Div yield, zero debt are all positives.
This might be an indirect way to play the PSU Recap theme.
Risks:
PSU risk - probably already in the price.
Receivables to the tune of 5700 Cr (Mcap of 22k Cr). Cash conversion cycle hasn’t deteriorated in the last 5 years so the receivables are in tune with sales.
Disc: Tracking
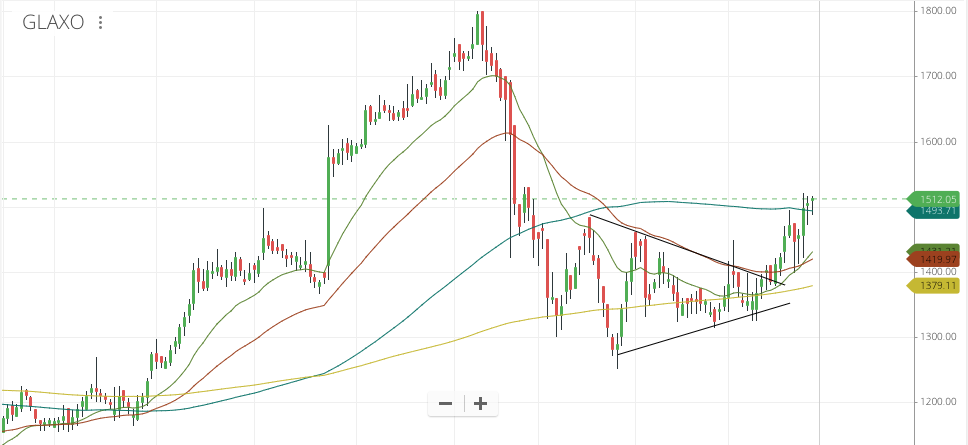
@HIMSHAH - I did check GE T&D but liked Siemens better from my cursory glance. Glaxo had an interesting setup few days back around the 200 DMA and a fellow boarder here had a position. I think it could have a pullback and consolidation before continuing the move. I don’t own it.
Thanks @phreakv6, for the response.
I own ABB shares as part of Esop allotment and some qty bought in year 2013-14. Not any significant portion to my overall PF. The reason not making it part of core PF, is being it is well discovered blue-chip company, not able to grow in double digits on secular basis barring few years where Capex is on its peak.
I believe some companies are good to work, and some are good to earn ( I mean to say by investing in it), ABB in my opinion so far belonged to the 1st category at least for last decade.
However if we look at the recent management commentary they are very much focusing on asset light kind of businesses where valuation and scope for growth are much better and visible. I don’t know ho much time it will take to reach their aspirations to delivery results, and how much practically it is possible to transform the company in that directions.
Looking at this change happening at the ground i’m thinking is it wise to invest into ABB to take advantage of future value unlocking if it all happens? At least it is declared that ABB will buy back its shares with the money (80% of total deal value) they get from sale to Hitachi. This may give some earning boost to its share price in short term I believe.
On Qualitative basis there seems to be some positive triggers in place ( major acquisitions in 2017 B&R, GE Ind. Soln (though not so good as market perceived), more focus on Ultra fast chargers for EVs, Robotics, Data Centers, IIoTs etc.,) but I need to see the charts on technical basis, if any kind of accumulation happening by known informed investors to catch up the higher potential if any?
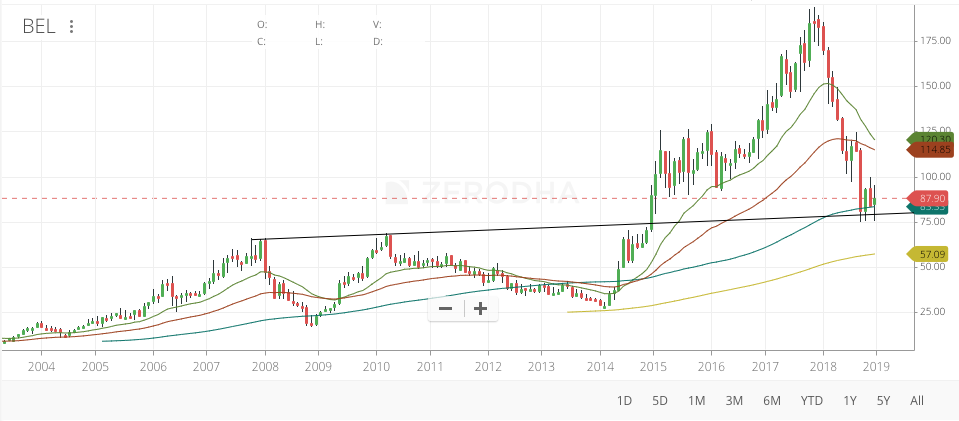
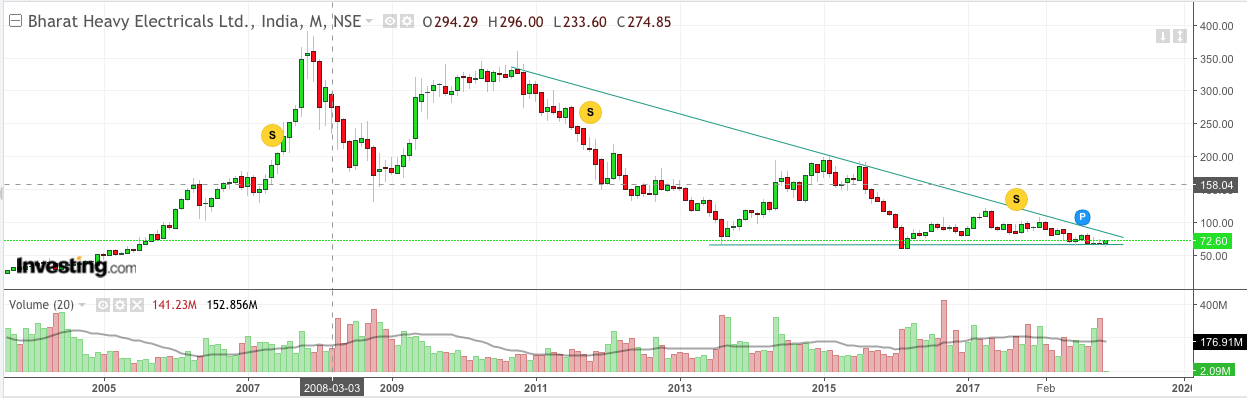
But usually market knows something we don’t and maybe that’s what is in the price? The article posted above about defence PSUs was very helpful in understanding BEL’s depressed valuation. Maybe there’s something like that here as well? Does anyone know?
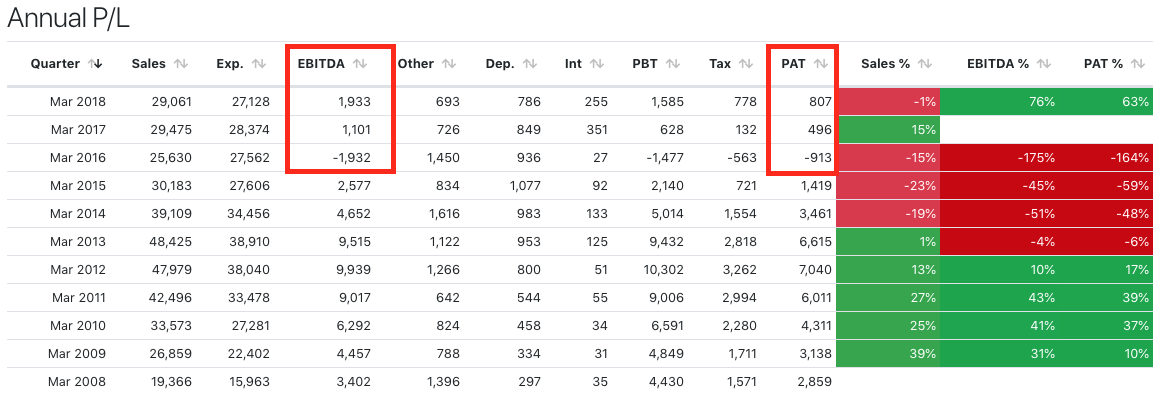
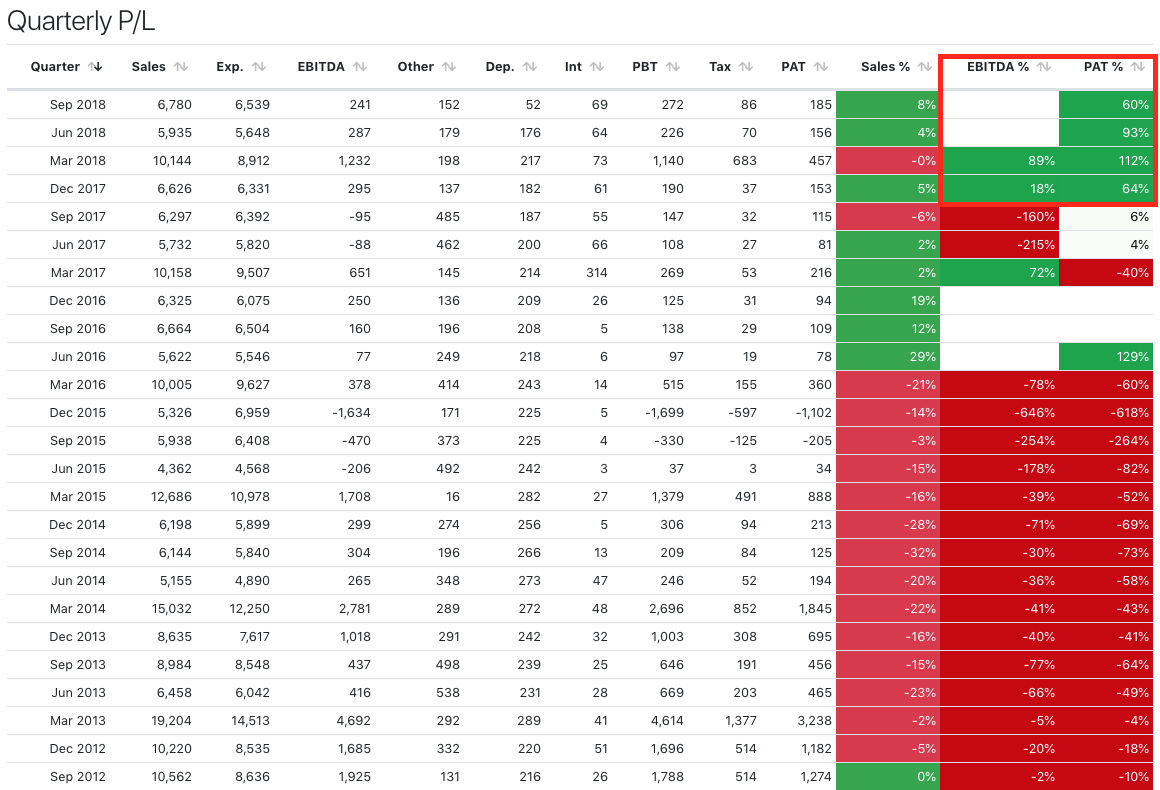
But what I found interesting is that under the Modi govt. BHEL has bled badly. From around 7k Cr PAT in FY12 and FY13 to current levels. Would a change of govt. be good for BHEL? Can this be an anti-incumbent trade? Just thinking aloud.
BEL , their was some news that as per agreement with govt after 2020 their margin will be capped so profitability will be impacted.so it was hammered down. more details u can search from net. i had read the news but dont track it
I don’t think any PSU will provide long term value creation, unless privatized. They may provide decent trading opportunities from time to time due to extreme pessimism. But these business are exactly opposite of quality stocks, underperformance is a rule for them.
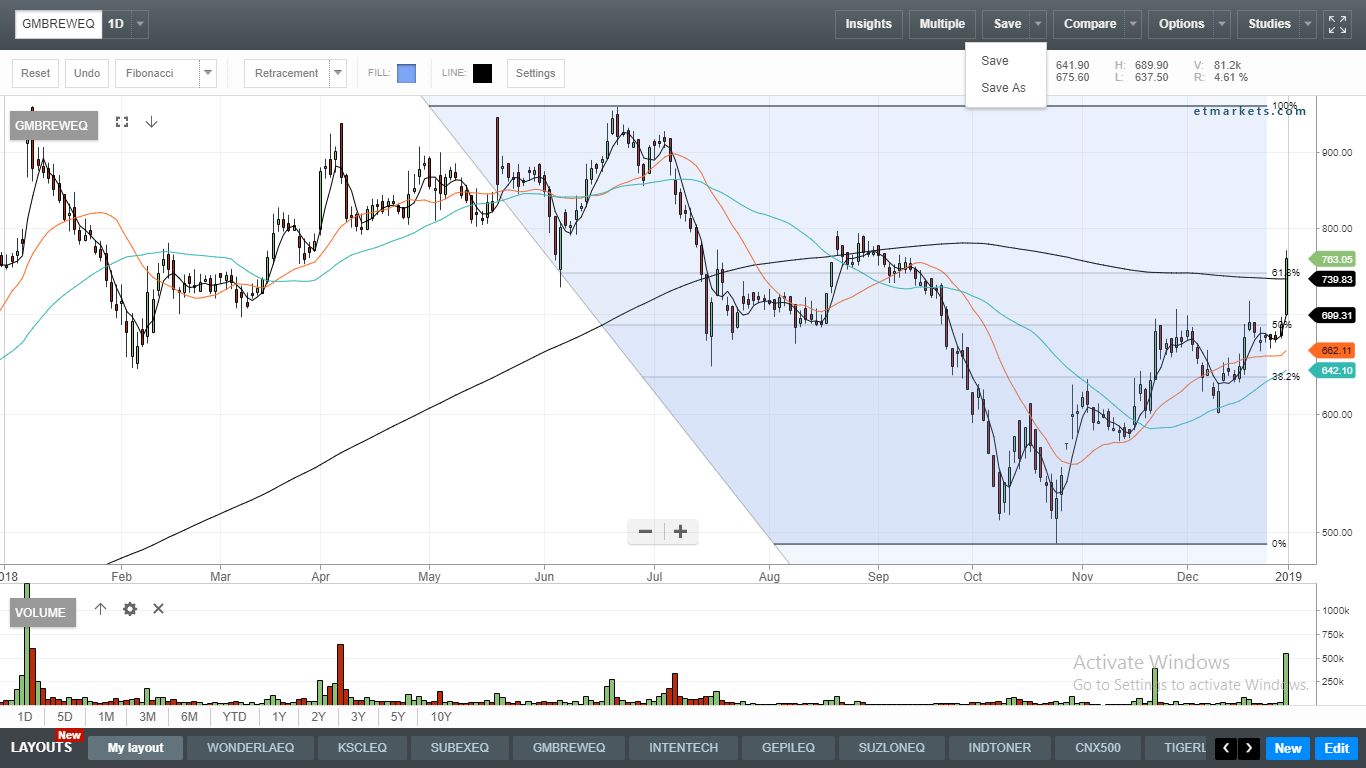
GM Breweries stages a breakout on huge volumes precisely at the confluence of the 61.8% retracement and 200D moving average.
Had outlined my thoughts in the GMB thread for the same. I think country liquor is good category to be in, there is a lot of untapped pricing power being a very cheap alternative + there is a vast difference in the quality of country liquor of the past and today. Several wine shops near my area have put boards that they too also keep “desi”. Will post a snap of one of them.
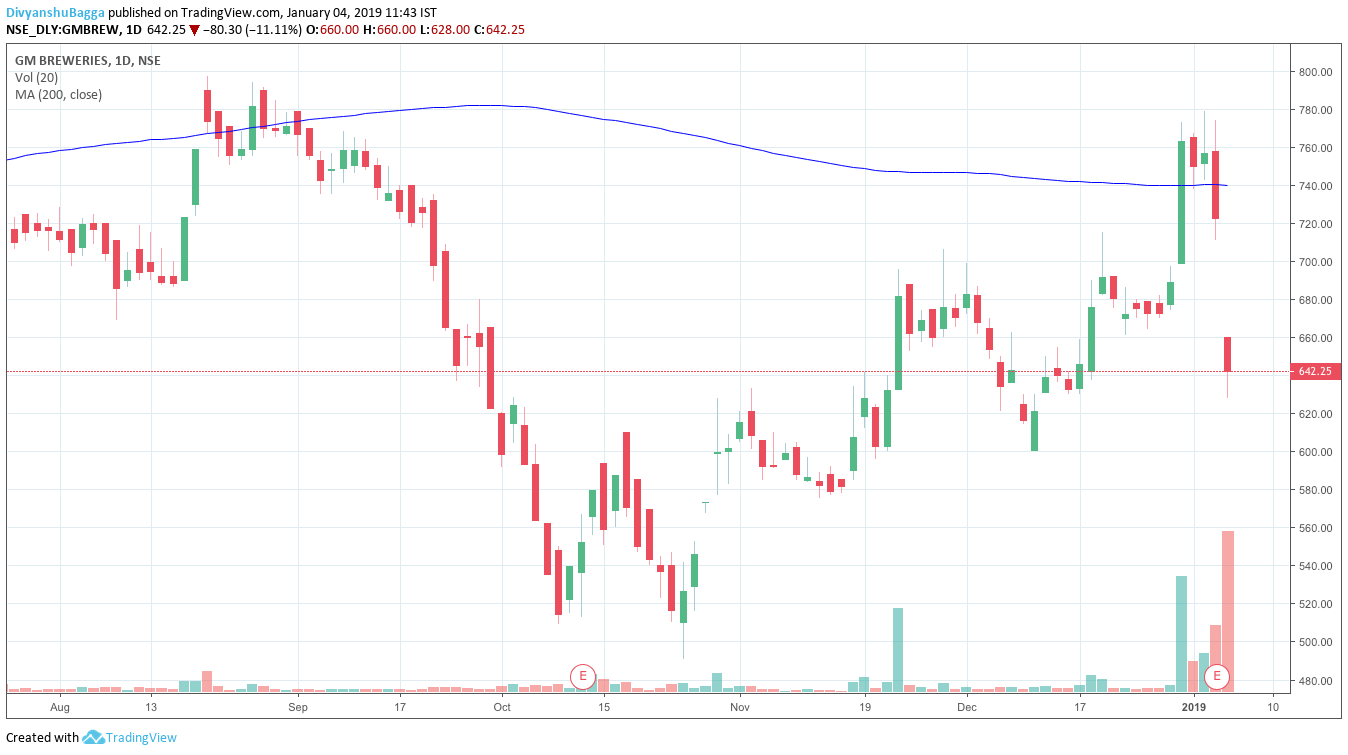
Don’t know about its fundamentals but the chart doesn’t make me feel bullish. You may see large volume as sign of demand, but i see it as of supply. Yes, price increase does mean the volume was driven by demand, but if it is getting good matching supply it may be hard for the stock to sustain a markup. The stock is well below it’s all time high and yet so many are eager to sell. This feels like a buying climax instead of start of a new trend.
The investment is based on fundamentals and not technicals. As mentioned earlier, I have posted my thoughts in the relevant thread. The volatility in the stock prices is due to the volatility in the margins as its main raw material rectified spirit is a commodity. However, it has managed to constantly increase prices over time and I have posted the trend for the same.
The technical chart is to suggest buying points should one be interested in the business and is looking for suitable entry.
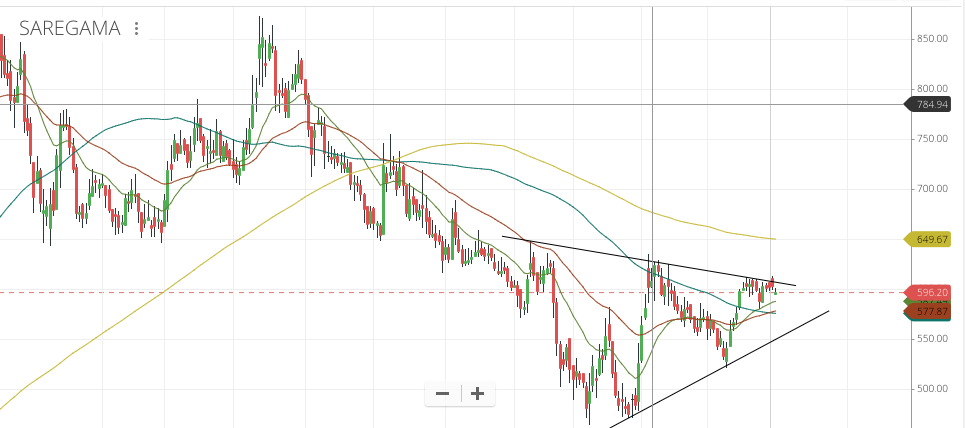
Saregama - Looks to be consolidating in an ascending structure. May retrace but should get to higher levels before Q3 numbers I think. Review count on Amazon by month points to a very good Q3 for Carvaan.
@phreakv6 Thanks for all the enlightening posts of blending technicals with fundamentals. Can you please provide some details on how you shortlist the stocks for your analysis? Do you use any specific fundamental+technical screener? Is it based on specific EMA crossovers or stocks near 52 week highs which you have in Quant of your website?
@santhozp - Right now bulk of the work is manual. Sometimes I find stocks in fundamental screens and then observe them for good entries (and of course exits) and sometimes I pick stocks that are on a 52 wk high or low or have had a moving average crossover (esp 200 DMA/WMA and sometimes even 100month moving avg) and have lately started using RSI and MACD as well which seems to work really well when combined with trend lines. I am adding more steps in terms of scoring the setups (how long has the trendline held, how many touches etc.) to improve accuracy. (Backtesting is also on the wishlist). Using fundamentals helps me avoid complete duds and using technicals helps me avoid bad entries/exits. The amount of work involved is still way too much I think which is why I am in the process of automating everything as it seems to be working reasonably well.
@phreakv6 - Thanks for the revert. Just to pick your brains a little, in your experience, which EMA crossovers and over what period (D/W/M/Y) give you a good buy or exit signal?
Also, are golden cross and death cross reliable indicators of upside or downside, in your experience. Thanks.
@optionswoptions - EMA crossovers, especially on the daily are not very reliable if you aren’t used to observing hundreds of charts per day. The reason I say this is that a sideways market will have a lot of EMA crossovers which are just noise (even golden/death cross). You have to differentiate a trending market from a sideways market to make sense of crossovers. Death-cross especially is very helpful in such cases (Saved me in Suzlon at 18 levels). Golden crosses on the daily work really well in markets like 2017 where the trend shifts to higher gear.
Otherwise I think long-term moving average price crossovers like 200 DMA or when price takes support on a 100 WMA or 200 WMA (or even monthly EMAs) are very good buying opportunities. A 10-30% pullback is very likely in these cases and since these are usually beaten down anywhere from 30-50%, the downside risk is usually minimal, if substantiated by value derived from fundamentals.
In current markets, this is the strategy that is working really well. When the market starts to trend higher, it will be time to look at 52 wk highs and just simply ride the trend like it happened in 2017. So it is very important to know what sort of market we are in. Right now it is the pullbacks that are working in short timeframes (2-3 months) but you can achieve a lot of capital turns with your trading capital and churn out cash, like the sort of businesses one would love to invest in. Digressed as usual.
Yes, its a breakout that didn’t last long in hindsight ofc Raw material fluctuations having played spoilsport.
If one had traded the breakout then he would have certainly been on the wrong side of the trade. But I wouldn’t label it as a buying or selling climax as failed breakouts are expected to occur more often than not and there is no reliable way to know in advance if a breakout is going to fail.
As investors however one should welcome these failed breakouts provided ofc the fundamentals remain good
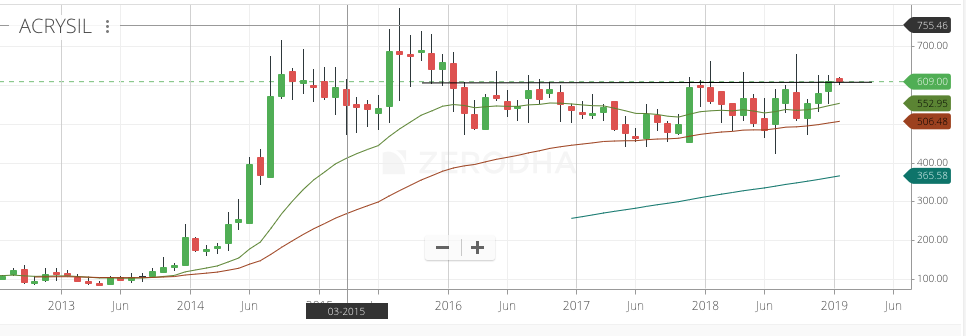
Acrysil - December close was the highest close in 3 years, since Dec 2015 and the first time it has closed above 600. Not so coincidentally, the stock has been split and should be going ex-split on the 11th. Hopeful for a breakout here.
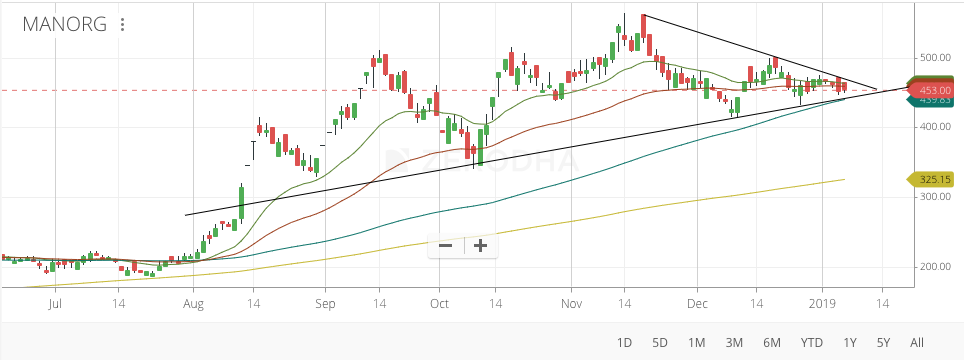
Mangalam Organics - Close to the downward trendline and close to the support trendline as well as the 100 DMA which should act as additional support. Breakout or break-down imminent. The stock is out of ASM from next week. Hoping for a repeat of VIP Inds where there were adequate opportunities for accumulation around 400 levels when it was under ASM and took a different trajectory when liquidity was back.
If we are using technical analysis then we have to identify the kind of markets we are trading in. If its a roaring bull market as it was before Jan 2018 most breakouts usually work and all you need to do is to find out stocks going past resistances, bullish patterns like flag, cup and handles, stocks fresh 52 week highs or fresh all time highs and get into them and enjoy the ride.
The current market as phreak mentioned is more a sideways market with small cap and midcaps in downtrends. In these markets its ideal to focus on stocks having bottoming formations like double/triple bottom, base formations post big corrections and positive divergences in momentum indicators, ending diagonals, or triangles at bottoms and so on and so forth. Here too if one is having a trading mindset, there will be times to have a definite sell plan post successful patterns because if and when next downmove happens these bottoming formations might be violated.
Some stocks which might be forming a base are petronet lng, powergrid, jk tyre etc. Invested in these names recently as techno funda bets.


 Raw material fluctuations having played spoilsport.