If we are using technical analysis then we have to identify the kind of markets we are trading in. If its a roaring bull market as it was before Jan 2018 most breakouts usually work and all you need to do is to find out stocks going past resistances, bullish patterns like flag, cup and handles, stocks fresh 52 week highs or fresh all time highs and get into them and enjoy the ride.
The current market as phreak mentioned is more a sideways market with small cap and midcaps in downtrends. In these markets its ideal to focus on stocks having bottoming formations like double/triple bottom, base formations post big corrections and positive divergences in momentum indicators, ending diagonals, or triangles at bottoms and so on and so forth. Here too if one is having a trading mindset, there will be times to have a definite sell plan post successful patterns because if and when next downmove happens these bottoming formations might be violated.
Some stocks which might be forming a base are petronet lng, powergrid, jk tyre etc. Invested in these names recently as techno funda bets.
True. Main problem in market at present is that their.is no follow up. All money is running after top a grp.shares. so most of break out falls and selling starta at every rise
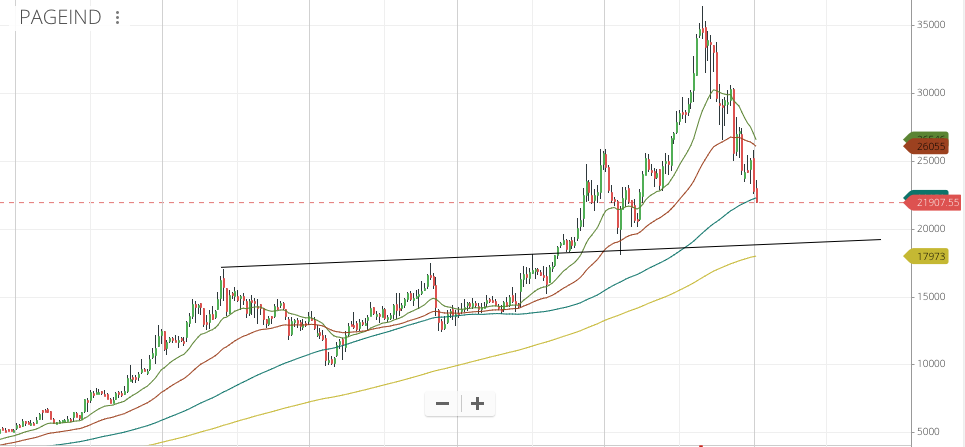
Seeing daily chart it seems that breakout is evident but when looking at weekly chart it’s not so obvious
As you said we should wait for signal from weekly chart like 100 WMA and 200 WMA.how to look both charts?
Page around 100 WMA and also breached 22000 which I had thought was fair value. Currently down 40% from the top. Not sure if the fall will be arrested here though.
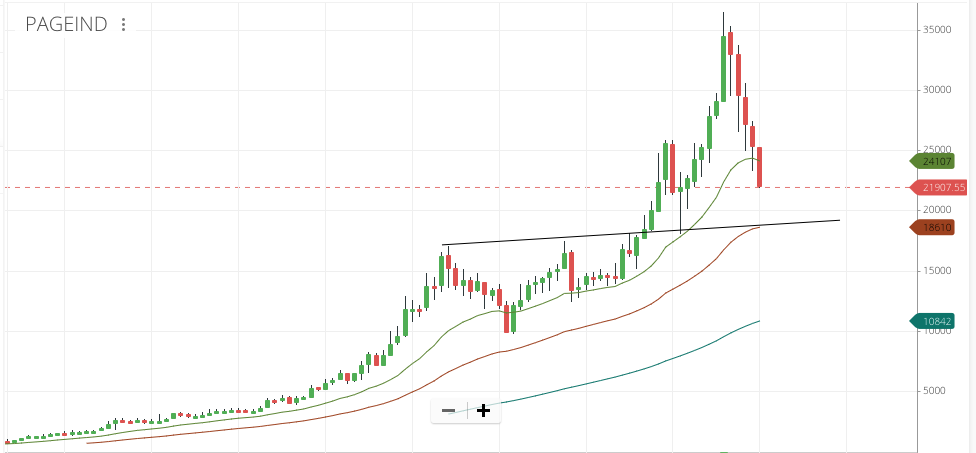
Monthly chart shows 50 MMA and also the previous breakout support trendline around 18000. This would definitely be very attractive levels to buy and would also be 50% down from the top.
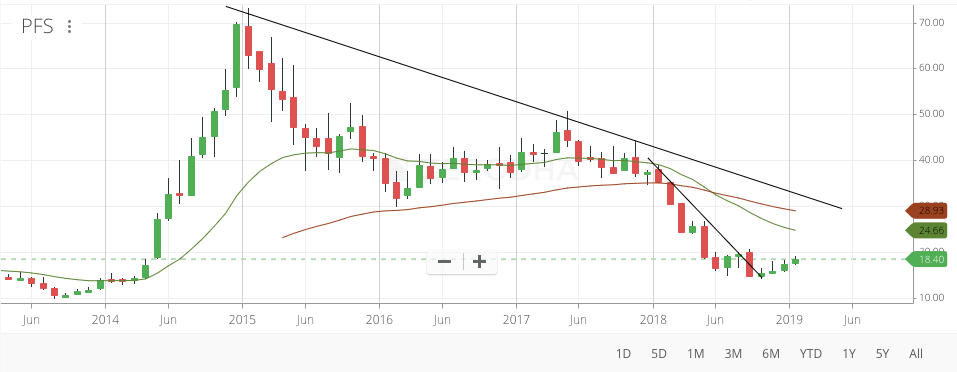
PTC India Financial Services (Monthly) - Even a pullback to the 4 year downtrend trendline could be a 40-50% upside. Fundamentally nothing to speak of, although it looks like PFS the parasite could have found a new host (SBI).
I haven’t been doing this long enough in different market conditions to say this is a better method than something else. I am learning empirically and seem to be doing alright for the effort put into the process. Maybe that question will be better answered 3-5 years from now, if I am still doing this.
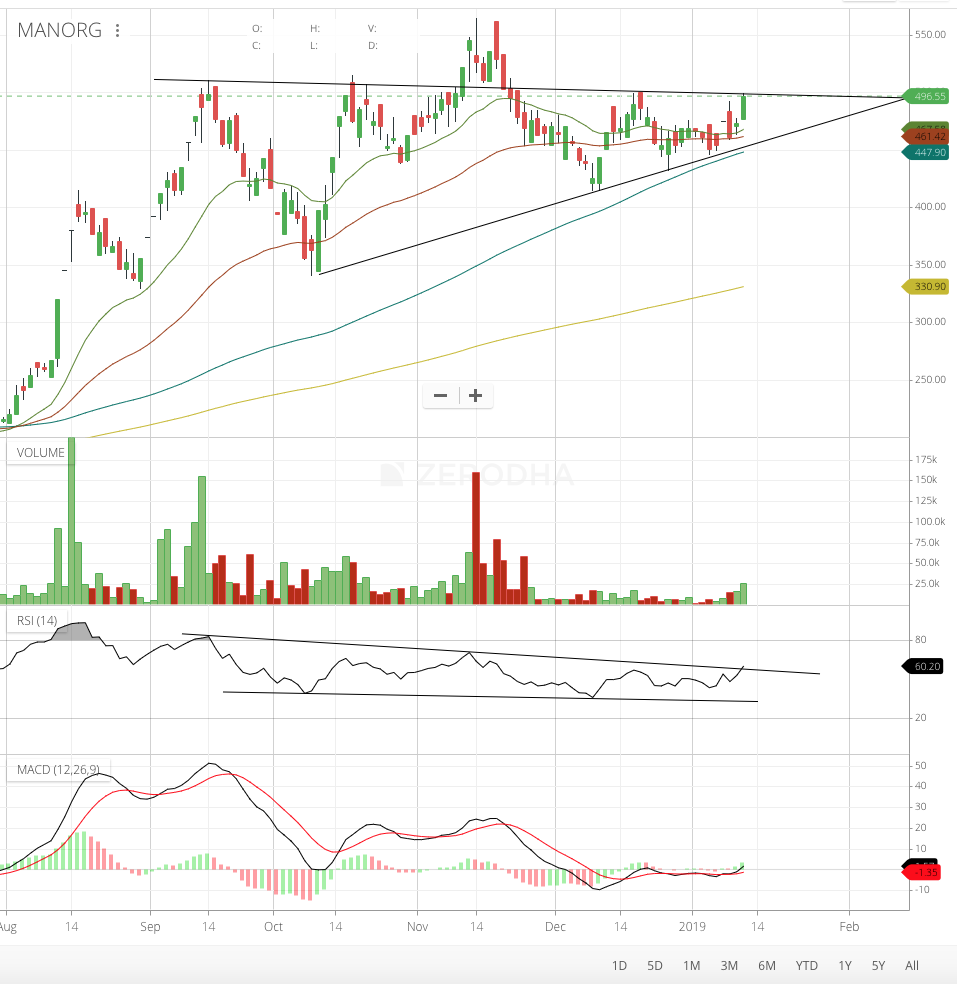
Mangalam Organics - 6th touch of the horizontal resistance trendline around 500 levels in 4 months. Flat to steadily increasing volumes this time. RSI appears to be breaking out of the wedge and is showing strength, allowing for the scope of an acceleration if there is a breakout. MACD crossover has taken place and the MACD histogram has been flat for awhile showing that the approach to the trendline this time has been least effortful (difference between 12 and 26 EMA is flat), all indicating a good setup.
Agree with your observation that the approach has been least effortful. If we look at the volumes, they have been steadily decreasing every time price approaches the 500 level, indicating lesser selling pressure as the price reclimbs. This supports the hypothesis that the stock is under accumulation.
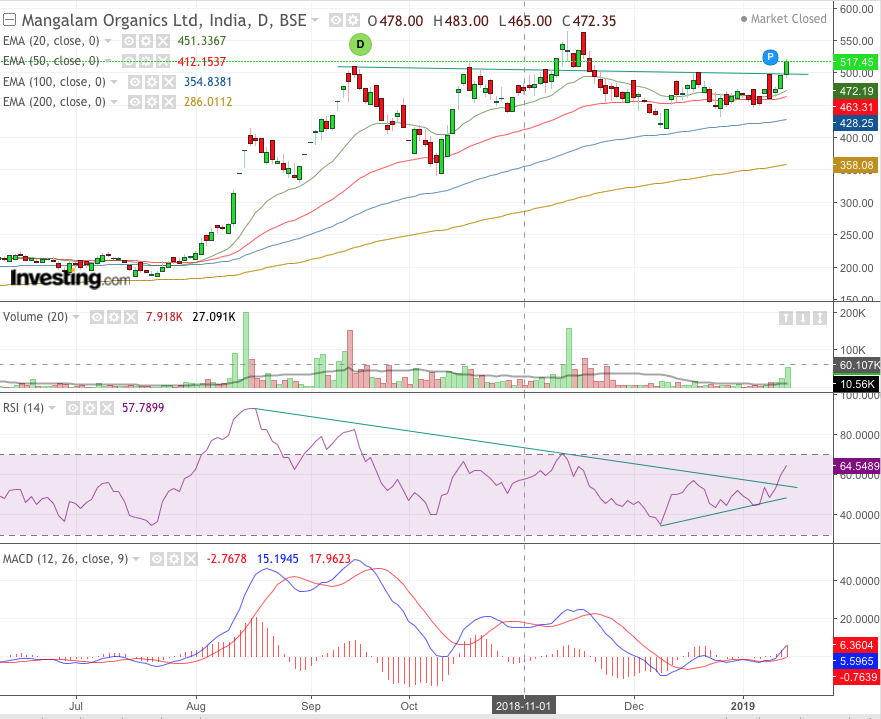
@edwardlobo - I used zerodha in the screenshot as you can see in the watermark. I have heard good things about tradingview from the people that use it. I find zerodha convenient for most things but it is highly inaccurate sometimes with OHLC and the prices are unadjusted as well so it is unusable in those cases. If you want to use tradingview without paying for it, I recommend using investing.com which anyway seems to use tradingview charts and its free.
The same chart I posted looks like this on investing.com. They allow saving templates and allow usage of multiple indicators without restrictions.
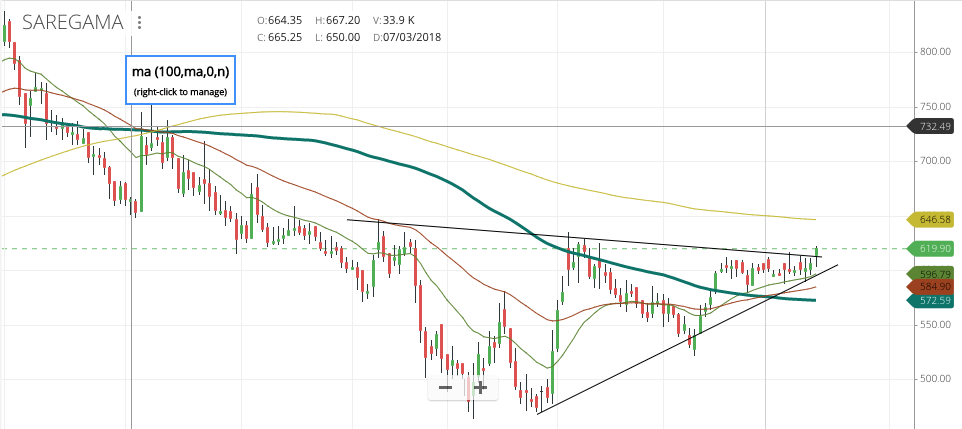
Saregama - Trading above the triangle today. Closing above 620 would confirm a breakout. I think results for Q3 should be quite good since it was the festive season. Reviews by month for Carvaan on Amazon as well points to a good quarter. Hopefully results wont disappoint.
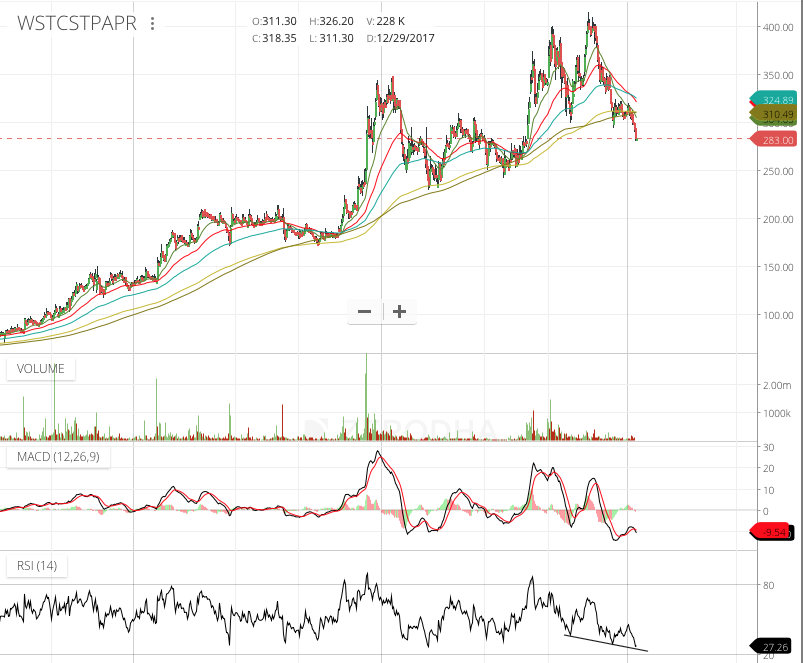
West Coast paper - RSI showing regular bullish divergence. RSI on the hourly is oversold. Promoters have been buying. Valuation appears cheap, probably nearing cyclical high but doesn’t look like there is much to lose.
I would agree with your analysis. More comforting or rather encouraging is the whole set up. Safari hasn’t corrected much and is maintaining the higher highs and higher lows pattern. The stock hardly seems to be affected by the small and midcap Carnage and hence can be called a out performer. The industry as a whole has tailwinds and almost all the players are expected to do well in the medium term. Technically as well as fundamentally this looks like a idea one should just ride on for couple of years .
Regards
Divyansh
PS…invested and forms about 10 percent of my portfolio . ( Technofunda bet )