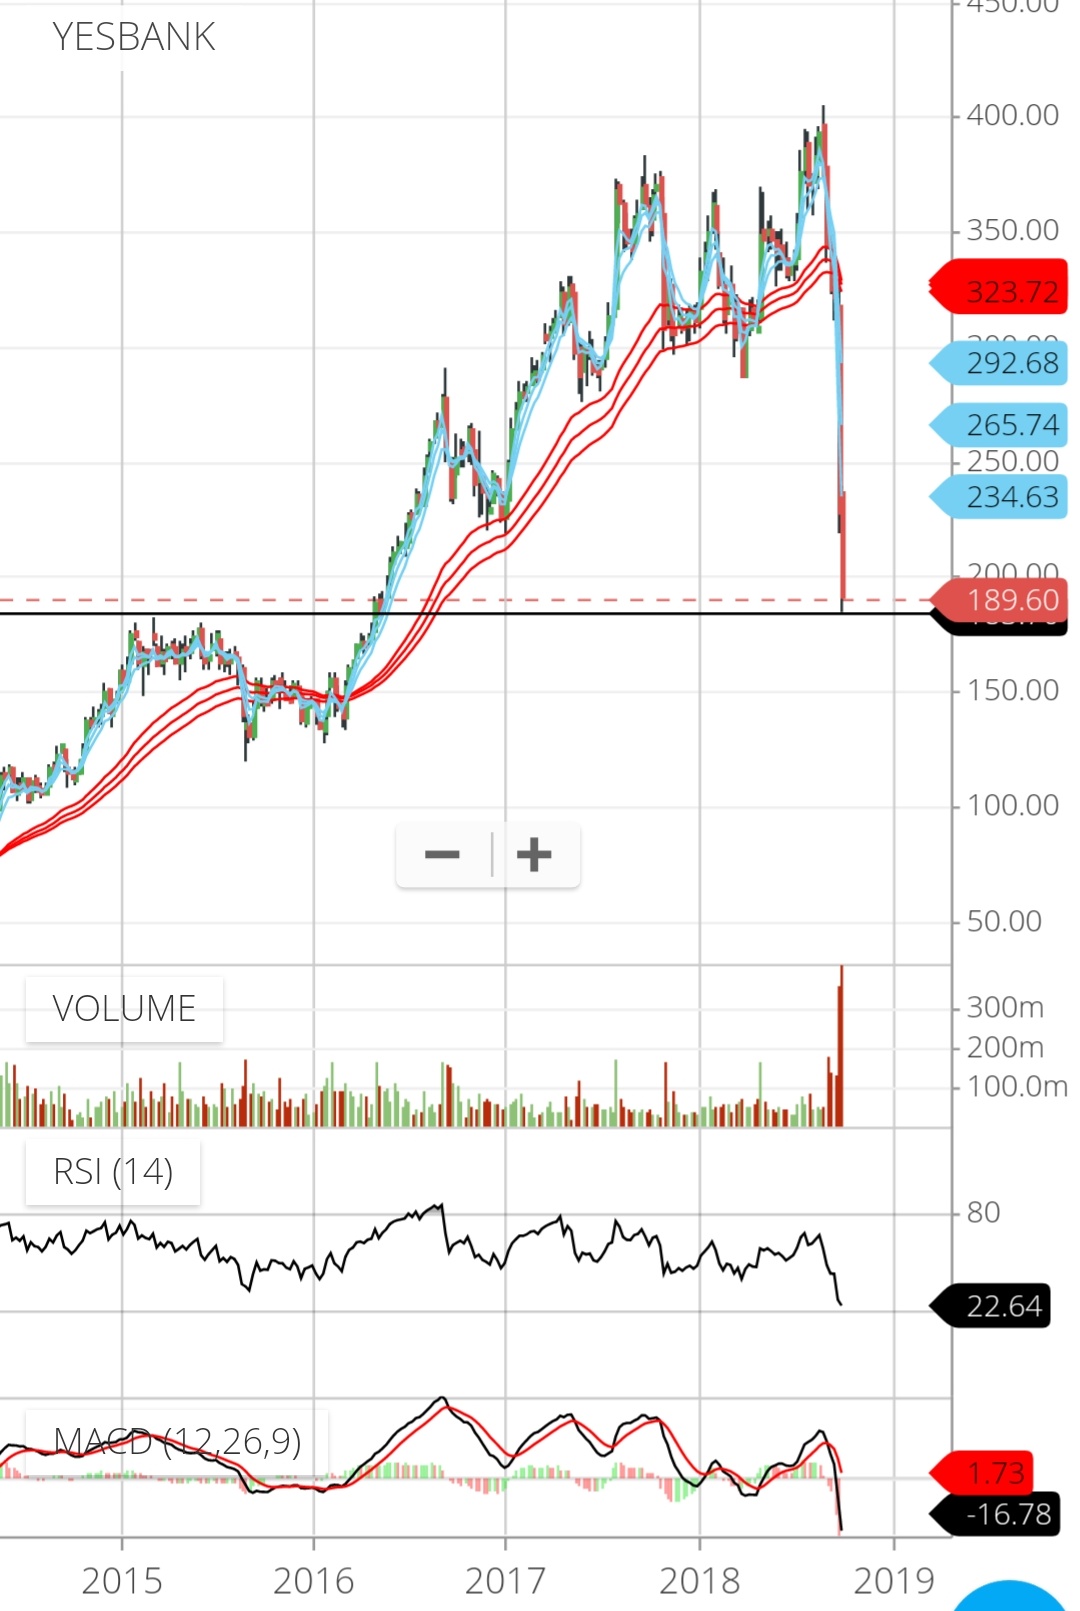
2 very similar scenario…
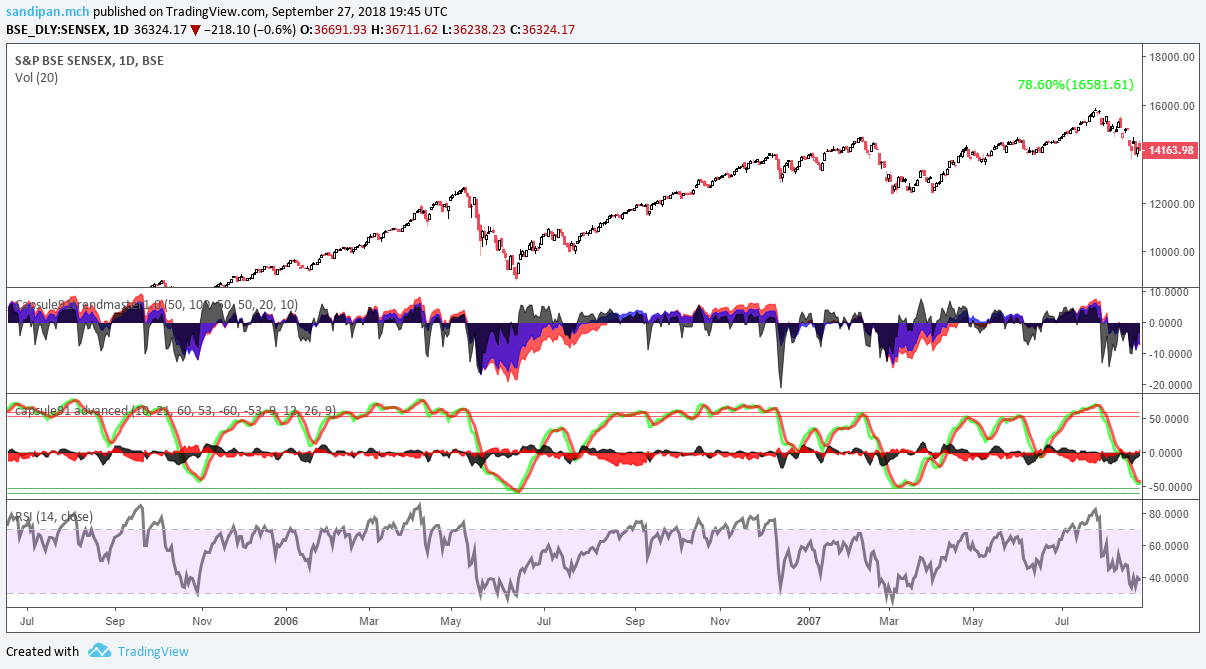
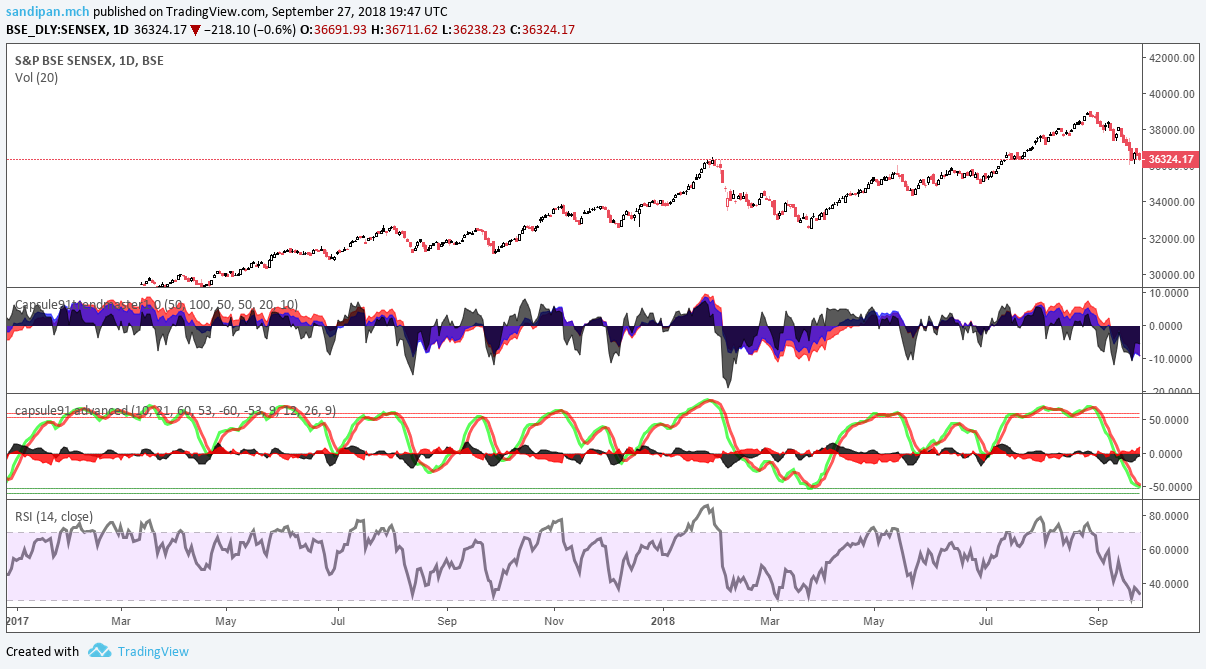
2007 is being virtually mirrored in 2018, in price action and in indicators, 3 of them
2 very similar scenario…
How is Sarda Energy and best steel logistics doing technically
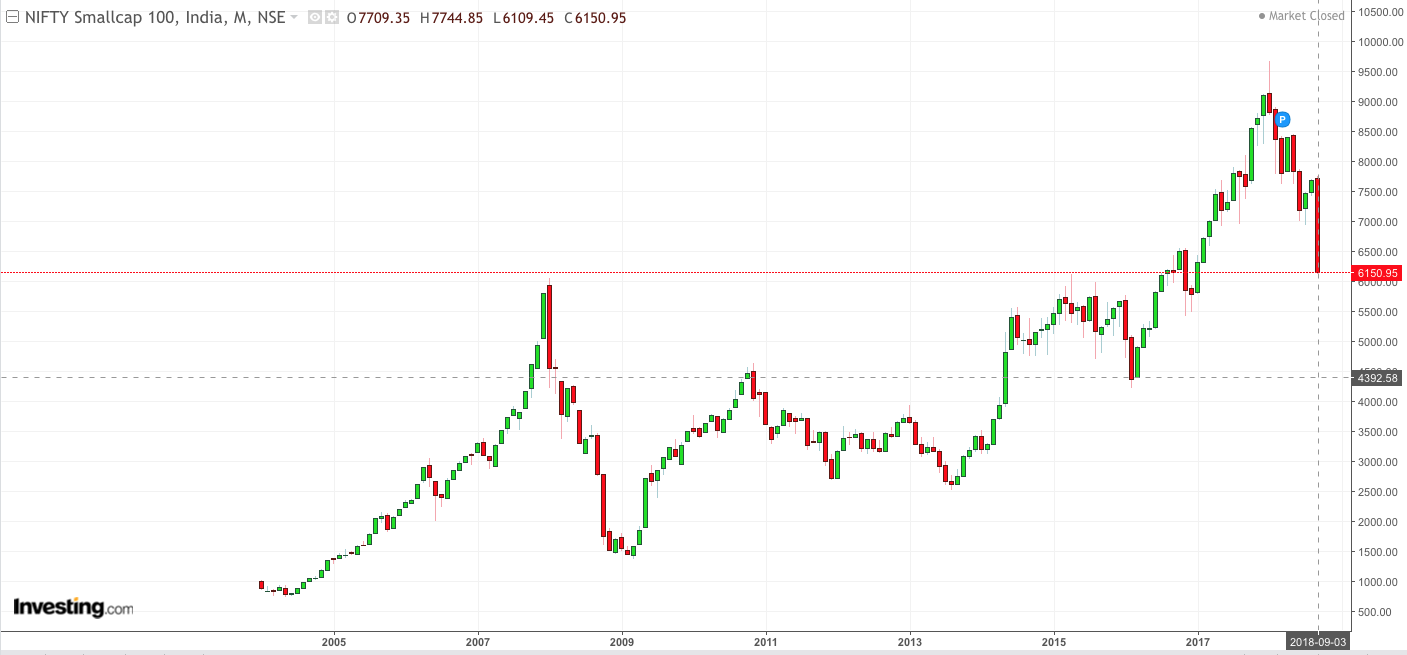
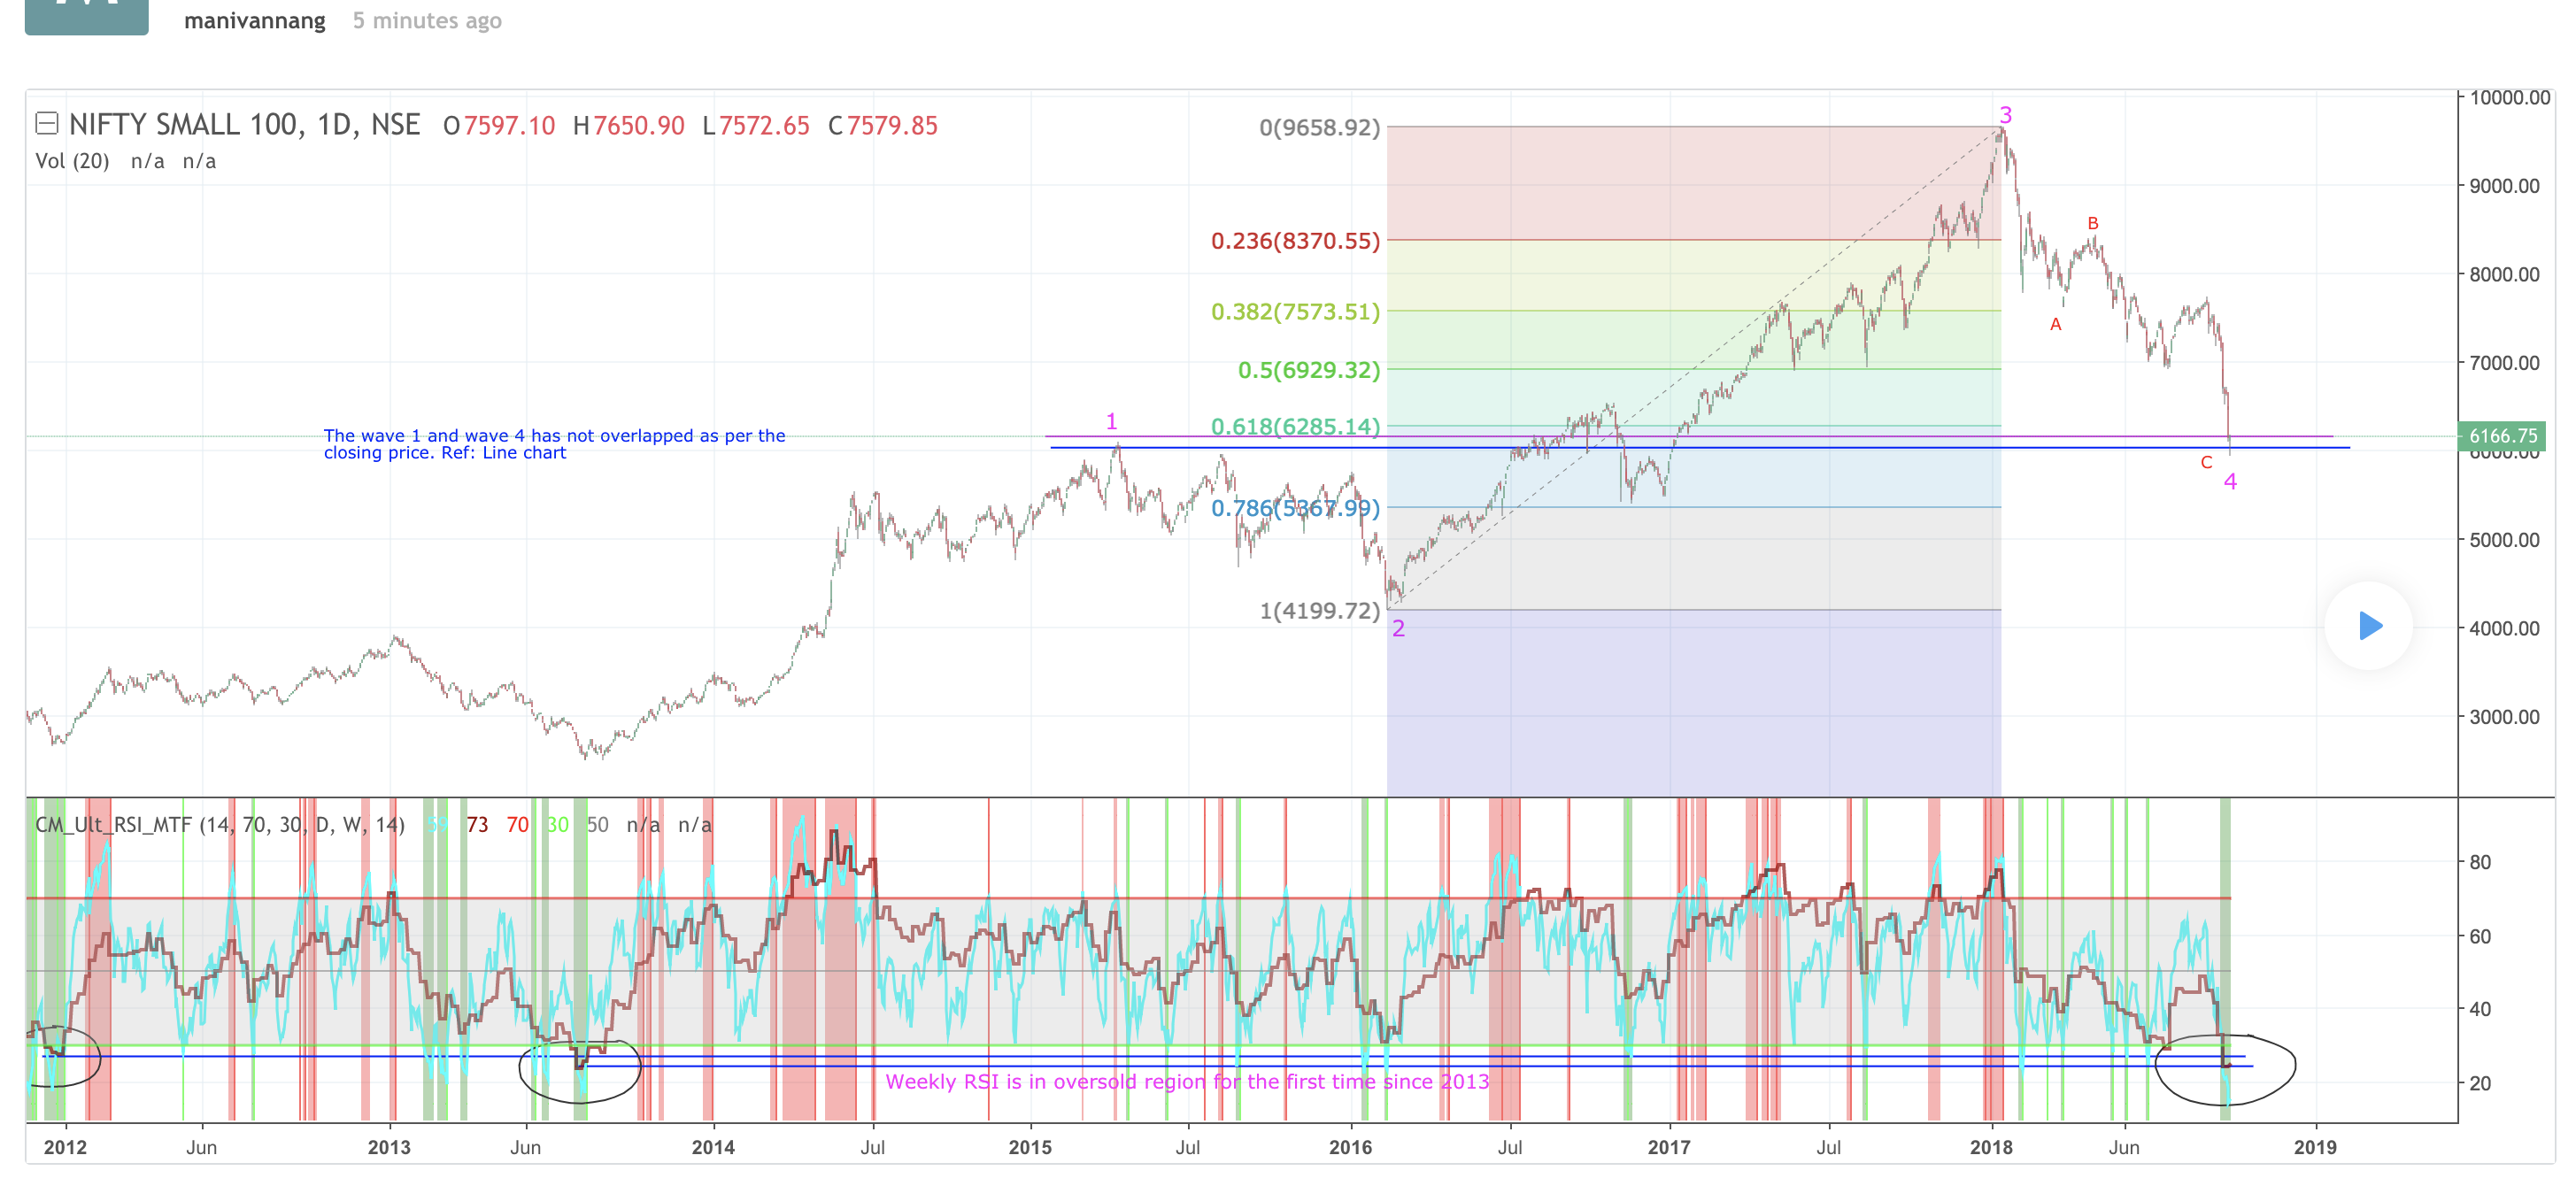
Smallcaps have run up from 3000 to 9000 - 3x since mid 2013 - 5 years. I think its normal to expect it to give up 50% of those gains to cut the froth. Charts as well show support around 5500-6000. Current correction is about 30%. Another 5-10% spread over next few months I think would be the most but there should be ample opportunities to observe strength and fish during that time. 2013 correction from Jan - Aug was 30% but that was not preceded by a bull run like the one we saw in 2017 so 35% is plausible.
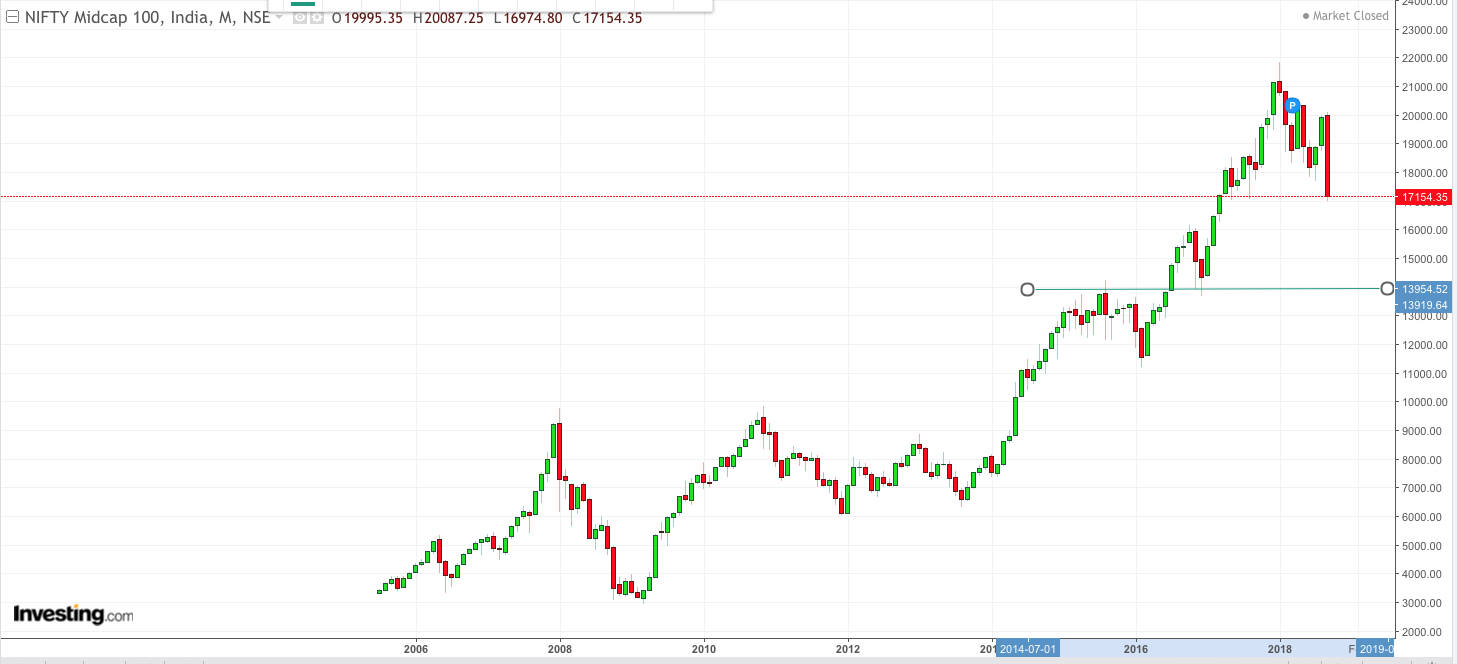
Midcaps I think will follow smallcaps although they aren’t there yet. Small caps usually set the trend for the market both on the way up and down. Midcaps have run from 7000 to 21000 - Another 3x like Smallcaps. If they give up 50% gains, they land up in that support line around 14000 (Currently around 17000) which means another 15% to go. I don’t know if we can assume similar risk for small and mid, so for the same amount of gains, assuming lower risk, the correction could be less than smallcaps. Not sure.
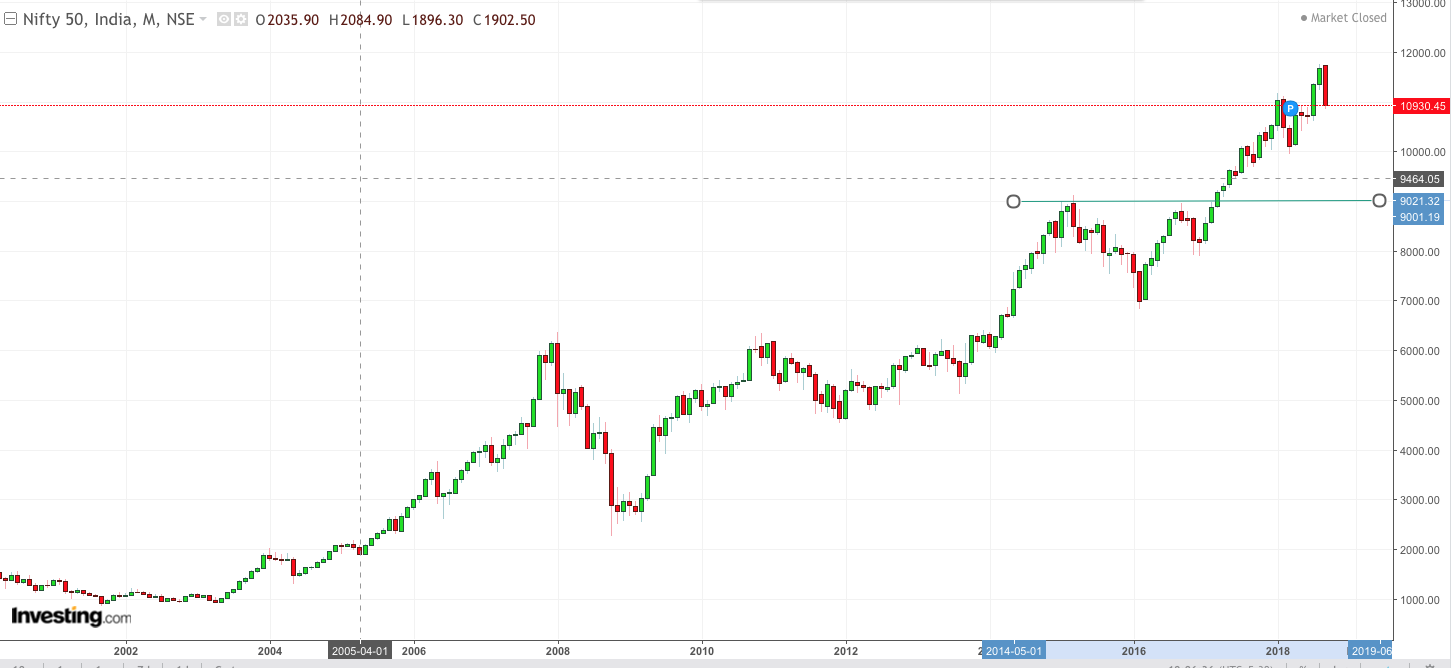
Nifty I think will fall the last when the broader market correction is ending. In the same period Nifty has moved from 5500 to 11800. If it gives up half its gains, it again will land around 9000. I highly doubt if that will happen though since the risk entailed is lesser here and so are the gains which means that a slow sideways/downwards movement till 10k in the next few months.
If all the downside gets priced in way before the elections, I wonder if we will see something like the late 2013 rally. Let’s see.
Disc: These are just random musings. I am no expert in technicals but like observing price trends.
There is one big silver lining to the smallcap correction. One thing I have observed in makets, whenever there is a sharp price correction, the correction duration is squeezed and the markets rise relatively quicker. It’s like bulls are slaughtered one by one vs bulls are slaughtered en masse… ![]()
There are exceptions to this like 1929 Dow crash, but in general the idea holds true.
For an investor, price correction is far less painful than time correction. To give an analogy, its akin to one large cut by a sword vs hundreds of cuts by a razor blade. In a big cut, one may lose a limb but if one is alive, one can always get up and fight, whereas in case of thousand cuts, one prevents sepsis in one wound, there is infection at another. As such we being mortals, can arrange capital, if lost; but how can we create time.
Thats why 2010-13 correction was far more painful than the 2008 one.
Just a stray observation.
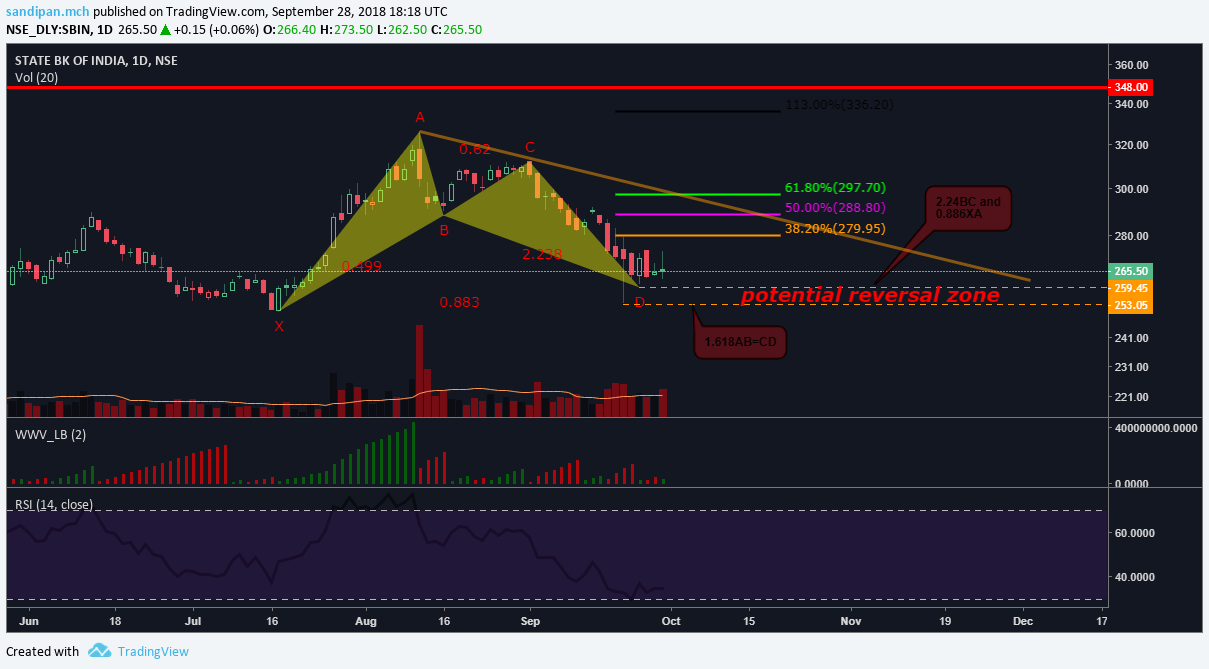
a bullish setup might be unfolding in sbin…
a bullish bat harmonic formation…
if the potential reversal zone is breached, it is invalid
rising crude, rate cycle bottomed out, currency depreciation, liquidity issues… so on and so forth, it has been talked too much now that it has become a cliche…
the macros have deteriorated no doubt…
indian and US election oncoming…
i dont think any way this correction is going to be short lived…
specially in the small caps …
the market sentiments might have been damaged beyond repair for some coupe of years…
technically there is one more motive wave is left to form, but the question is what is go to start an impulsive rally…
just an oversold condition and everyone is scared and no one is recommending these spaces, a perfect setup where institutions buy, then again, if the stocks were in strong hands and they are buying, the fall we saw would not happen…
i guess is, we will form a base, and should form a good base, 2008 ended with a 6 month base atleast…
what i am specially concerned about is the frothy valuations in the us market… the FANG stocks have been thrown into redistribution after having butchered…
once that starts tumbling…?
for now, i am looking forward to usdinr to soften , that might set some pace in the market…
several emerging market currencies have started distribution against dollar, rupee nd other asian currencies might do so too…
looking at even Lira, it looks very much topped out in the chart…
technically gold still looks very bearish, the biggest gold miners stock like barrick have started showing the initial signs of accumulation…
although others like, goldcorp ,newmont, kinross etc, are enjoying markdown post distribution…
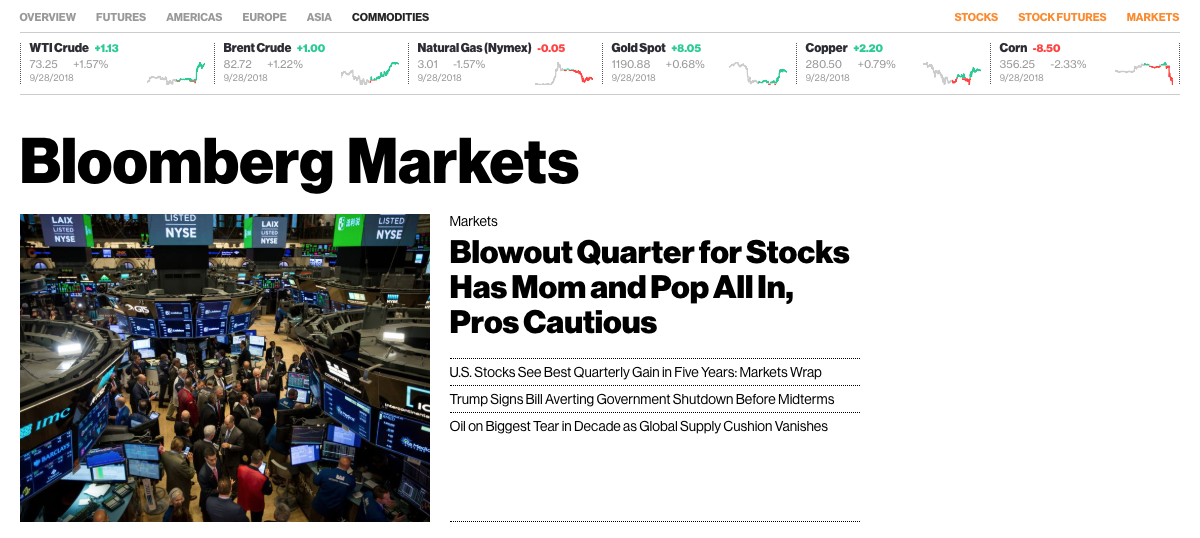
The headlines in the US markets are very reminiscent of what was happening here late last year/early this year. Unlike last few years where “globalisation” was the theme and major markets worldwide were moving in lock-step, now we are going to have different winners and losers, thanks to MAGA and Trump. Not sure how long this can go though since a lot of the world’s debt was taken up because of globalisation. The capability of economies to service this debt without globalisation is non-existent. Since we have largely stayed neutral in global politics, it might be business as usual for us but the China/US trade war impact could have long-lasting impacts that will play out in the coming years. We have been decoupled from S&P/Dow/Nasdaq for sometime now so an underperformance (not crash) there might be good news for us.
was casually going though the fin stock charts…
taking edelweiss as an example…
edelweiss is encountering too high volumes, post distribution…

this is very atypical,
the bid side of the order book in most of the big finstocks have to be heavy to generate this kind of volumes…
i think this will climax in a couple of weeks, and the operators will start buying to get the prices high and redistribute again
the buying interest in this counter is too sweet not to take advantage off and retail trap
if i was the operator, i would do the same any day…
the market fall should take a good breather in coming couple of weeks…
none of the pharma biggies even twitched a muscle in this fall…
any breather in the market, is going to make this space very interesting …
Let’s hope so. Created a position at Lupin @ 870 with a S/L of 840 during the market freefall. Let’s see how things pan out.
Do you really think operators can manipulate stocks like Edelweiss having 20k cr market cap. This high volume is also accompanied by relatively higher delivery volumes though it is not difficult to make out which group is more desperate among buyer or seller. My last purchase was at 170 last year. I plan to add again at those levels. Do you see any long term damage to the structure here?
@sumi00 , I believe @Capsule91 is not saying its operator driven but what he is pointing out that big investors are offloading their stake systematically.
Hi@capsule ji I m very impressed and intrigued by your techincal analysis
Could u guide me how to learn wyckoff analysis
Also please could you analyse Bitcoin techincally I shall be grateful to you
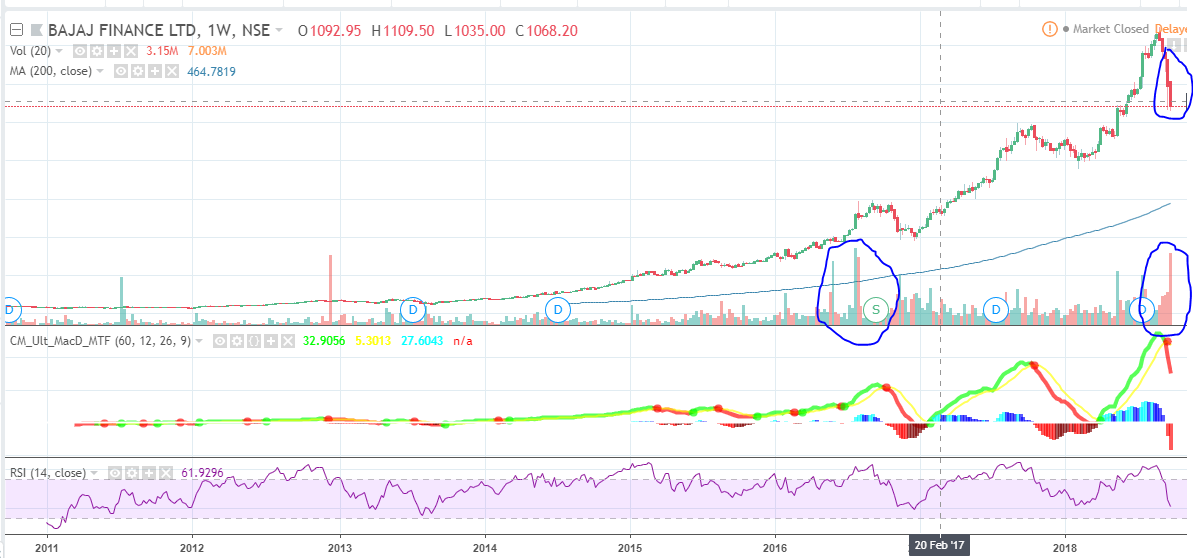
BAJAJ FINANCE:
During stage 3, the stock is no longer under extreme accumulation; instead, it is changing hands from strong buyers to weaker ones. Smart money that bought early when the stock emerged onto the scene is now taking profits, selling into final signs of price strength. As that occurs, buyers on the other side of the transaction are weaker players who know about the stock because it has made such a dramatic run and captured headlines. In other words, the long trade in the stock has become crowded and too obvious. This distribution phase exhibits a topping pattern. Volatility increases markedly, and the stock becomes visibly more erratic relative to its previous stage 2 trading pattern.
Earnings estimates that have been continually ratcheted up on continued upside surprises will be too high to beat at some point. A company cannot keep beating estimates forever. At some point earnings per share (EPS) momentum will start to slow. Either the stock price will anticipate that change, trading lower than it did before the actual earnings event, or there will be several quarters of slowing earnings growth (deceleration) and then a breakdown in the stock price.
Distribution phase Characteristics:
It seems Bajaj Finance has displayed this one characteristic on its weekly chart pattern.
Source: Trade like a stock market wizard
Smallcap is in oversold region, expecting a bounce back… If the crude and USD allows.
Disc: Not a trading reco.
Why smart money did not sell @ 2900 and selling now? If competition is getting decimated as RBI is trying to shut down 1500 NBFC’s- the leader will get stronger. Repeatedly the management has stressed that they can tackle higher interest rates.So just with the sentiment all of a sudden how come a market leader will collapse.
Crude at 85$…when will crude peak out? 100$ crude doesn’t auger well for most economies
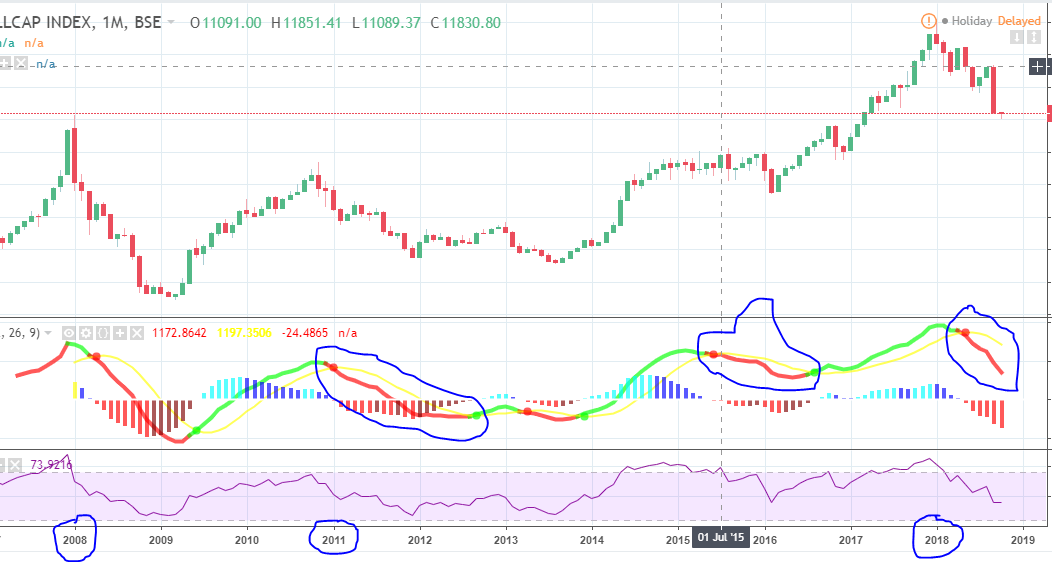
S&P BSE SMALL CAP INDEX: Monthly chart
The current momentum of selling is too strong and steep, similar to the last seen in 2008.
There have been two major negative momentum reversals from Jan 2008. One in Jan 2011 and other in June 2015. In both the cases, the momentum fall was not so steep but rather flat.
The current fall feels like a huge ball rolling off a cliff. It might need a much powerful external force to stop it or reverse its journey.
Just an observation. We might need other moving parts as well to predict the whole picture.
It is not about the business, it’s about the stock price.
The never-ending debate on valuations can be found in many threads. I guess no one has the right answer. But being a small investor one should work with the smart money and not against them. It helps in generating above-average returns. You can also take the help from seniors for estimating a fair value of Bajaj Finance.
87-89 is first decent resistance and then the big one between 98-100.5… and if crude at all comes to blow out then 106-109… this is max …honestly i do not see 100 getting breached at all, but blow out can take it to 106-109 and then possibly a big decline… but again…98-100 is extremely strong resistance… it could correct significantly from there itself… remember on long term charts, crude is making lower lows and lower highs…
are you revisiting your counts ? You seem to be expert in EW… i am just a price action guy. What’s your take on small cap index now?