
Could you please provide your reading of chart of Taal Enterprises Ltd.
Could you please share your view on ishan dye chemical chart
firstly as a disclaimer…
i am not very proficient in elliot waves, largely new to the concept…
correction if needed please mention…
time and again, what the headline indices are doing has baffled me, after all market leads the path…
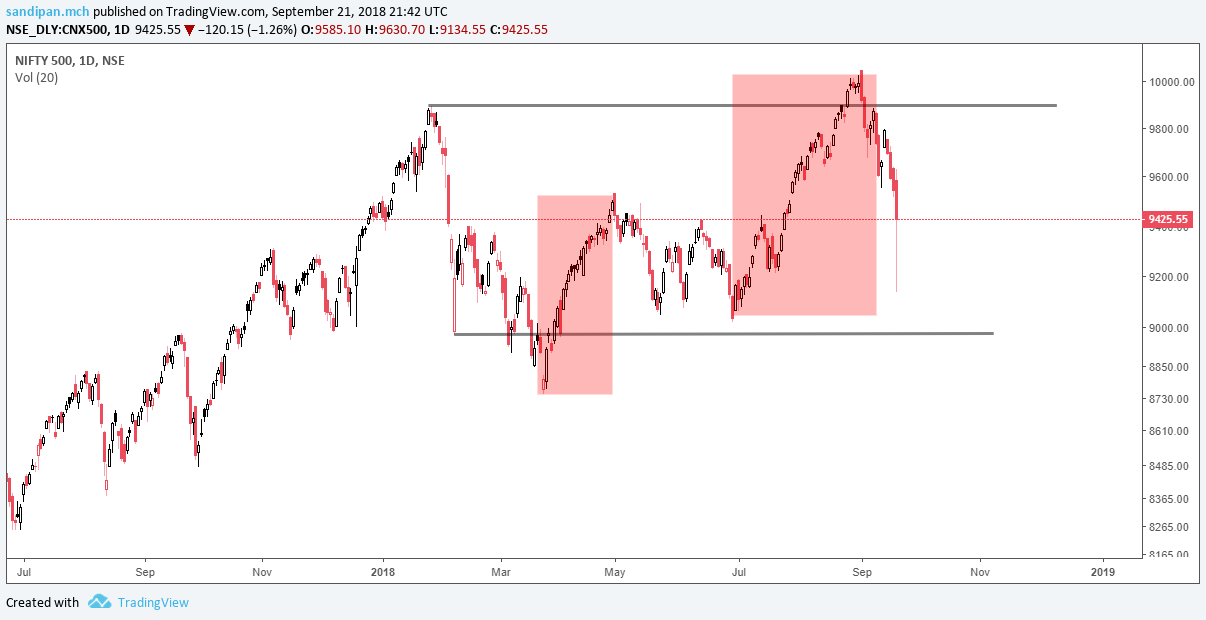
the basic confusion i had, was the small and midcaps were not delivering as nifty was and there has been a lot of divergence…
the basics of dow theory mentions all indices move in tandem…
also, the composition of nifty 50, the leadership stocks such as hdfc twins were looking horrible with wyckoff distribution , and its very unlikely to have a impulsive nifty with its leaders under distribution…
nifty50’s wave structure is such that eyes can easily get biased, while i turned to nifty 500,something was different…
as a conclusion, its a drastic thought, but i think in most likelyhood, nifty had been correcting all along along with mid and small caps… this is not a bull market rally…
this is rather what is a flat correction going on …
and the final leg of the correction is under way…
for reference on flats, i am using this good website link…
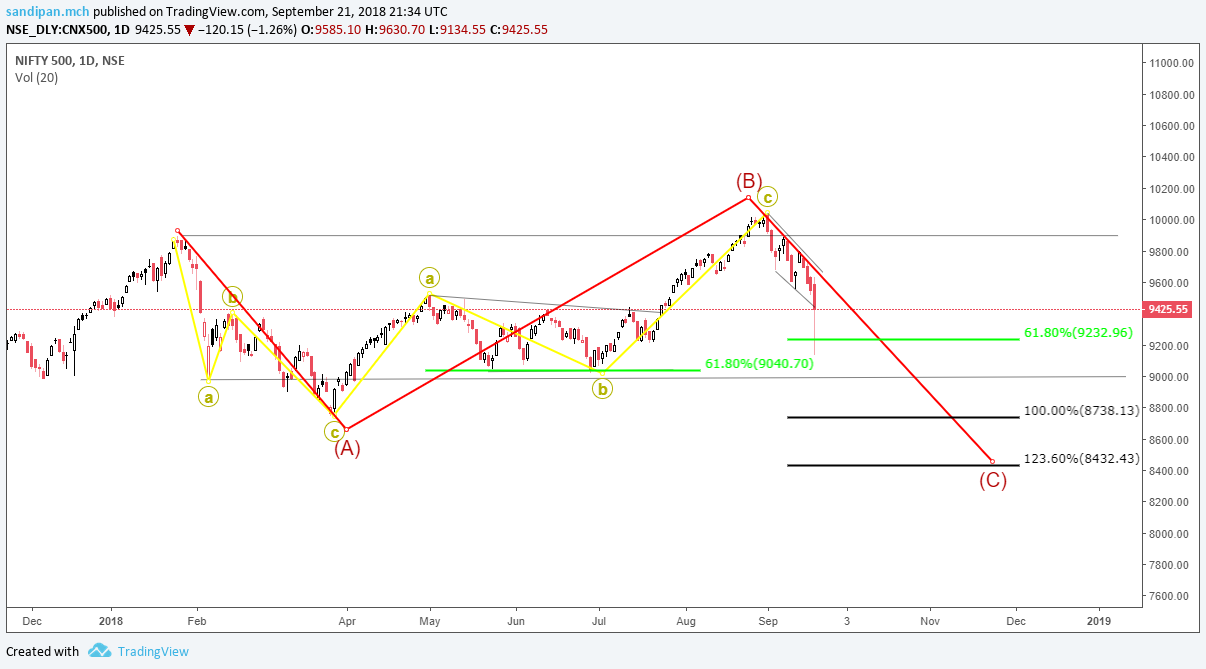
i do not know where the C is going to end…
it might as well have ended at 61.8% or may not have yet… a there are other possibilities like 100% and 123% as the text mentions…
it also mentions there is most likely going to be momentum divergence, which is not yet seen in the oscillators
interestingly… down jones industrial average is facing climactic volumes tonight with deliberation candle stick pattern…
very near the supply line…
also there is bearish divergence in the RSI
a global correction might be coming?
algeria opec outcome and fed rate hike are the two upcoming events…
although the later should be factored in…
i have extreme difficulty in applying wyckoff principles to headline indexes due to lack of volumes in the chart…
but what i gather is , increasingly impressive rally till now, which has been essentially been converted into an upthrust for now, followed by a rampant decline, which does look like a show of weakness…
lets see how the schematics goes, as the market is neitherways right now…
i am going to hold my scrips, all of which are fundamentally backed beside good technical relative strength…
notable today was, reliance and alembic pharma…
excellent relative strength…
the optimist i am, good news is, this correction should be fast and will be over soon, and a whole impulse wave is left before the actual correction happens, based on the elliot wave theory i am having…
what is going to take the nifty 50 up? thats the million dollar question…
maybe fresh buying coming in after an oversold situation?
after all i believe the issues what caused the crash today was inorganic and manipulated…
whatever it is, ITC and reliance certainly look good on the technical charts…
as of now, 10600-10800 should be a region to watch in nifty 50…
1 Like
@Jinal
l dye looks like accumulation, lets see how it holds up further…
great relative strength…
expecting potential upside…
@nagesh_reddy
the action is too choppy to dissect the demand supply…
but the basic structure looks positive…
important resistance levels have been broken on runaway gaps followed by lack of supply…
expecting the trend to continue…
will post charts n the thread on sunday…
goodluck
1 Like
Bank nifty and and the market look oversold on short term basis. For more selling to come their has to be little short covering. Bajaj finance rsi is at historic low of arnd 20 or so. Although I do admit that volatility can play the devil here. But one can play for a meaningful bounceback in the nbfc and bank nifty space for the next week after current expiry.
Went long on bajaj finance at 2250 Oct futures.
searching for another entry point in deepak nitrite…
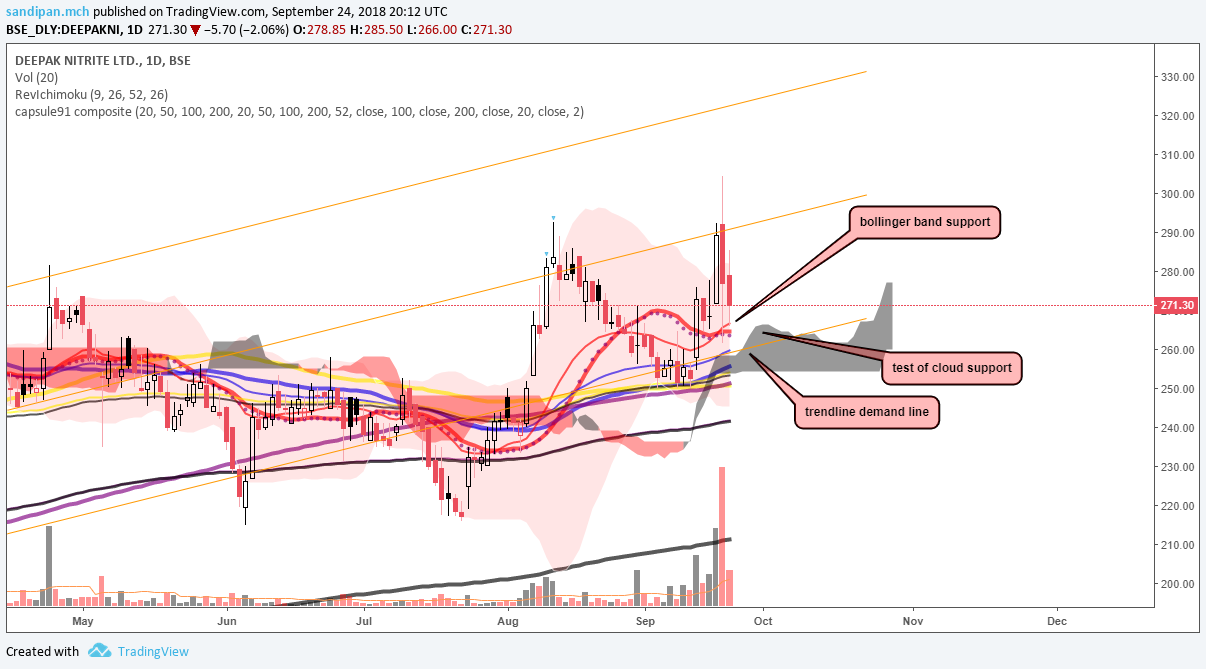
maybe 255…
let seewhere it forms support
phenol prices on an uptrend, after shut down of us facility for this objecive
https://twitter.com/search?q=Deepak%20nitrite&src=tyah
the crude linked ETFs had been accumulating past couple of weeks
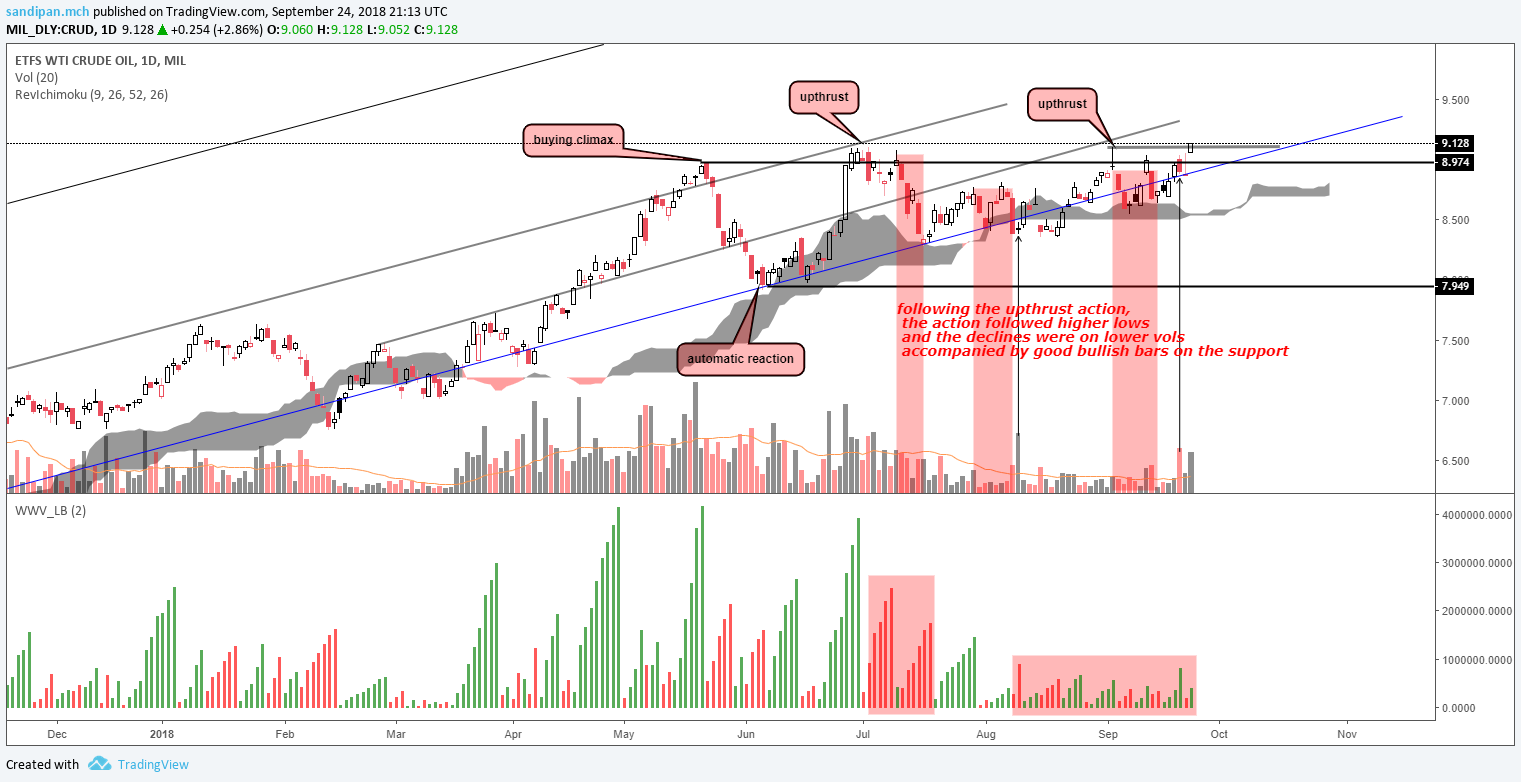
and the inevitable happened…
more pressure on the market incoming…
crude >100$/barrel? thats a crazy sight to see if that at all happens…
meanwhile, something funny…
dow jones formed the evening star candle stick pattern , a pretty strong brearish reversal sign …
enough is already brewing in the US market to set off a proper distribution sometime in recent future…
1 Like
BHageria ind…
seems like a shakeout in action…
lack of supply below the trendline…
a buying spree might start…
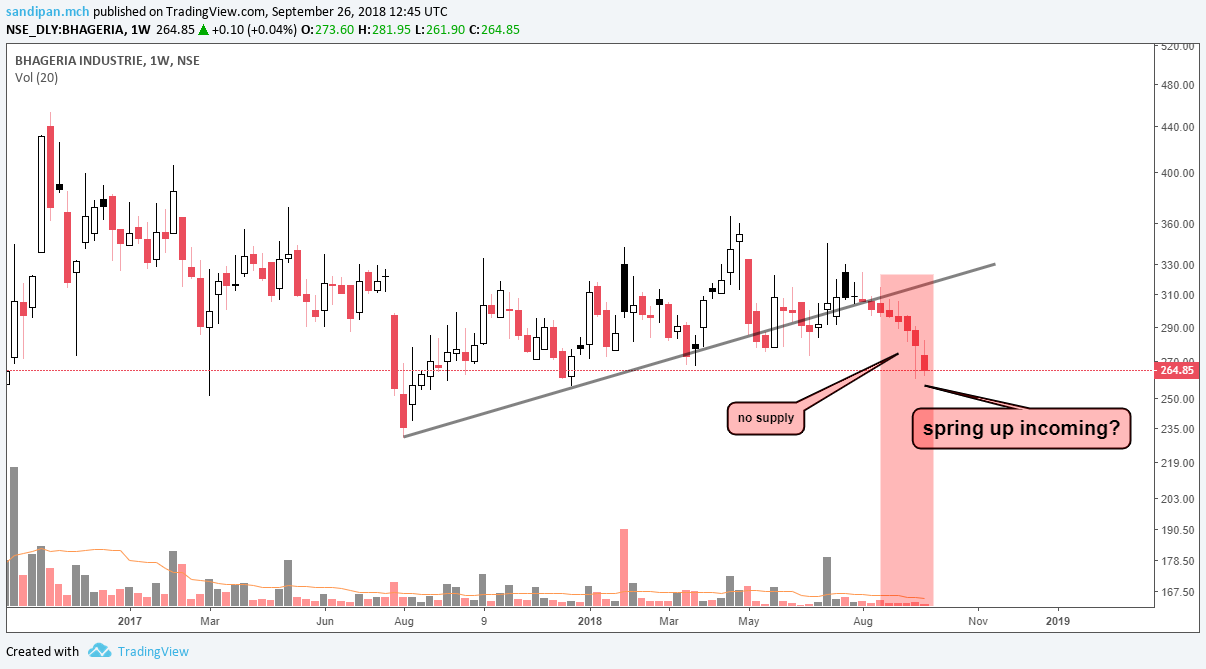
disclaimer… not position, watching closely
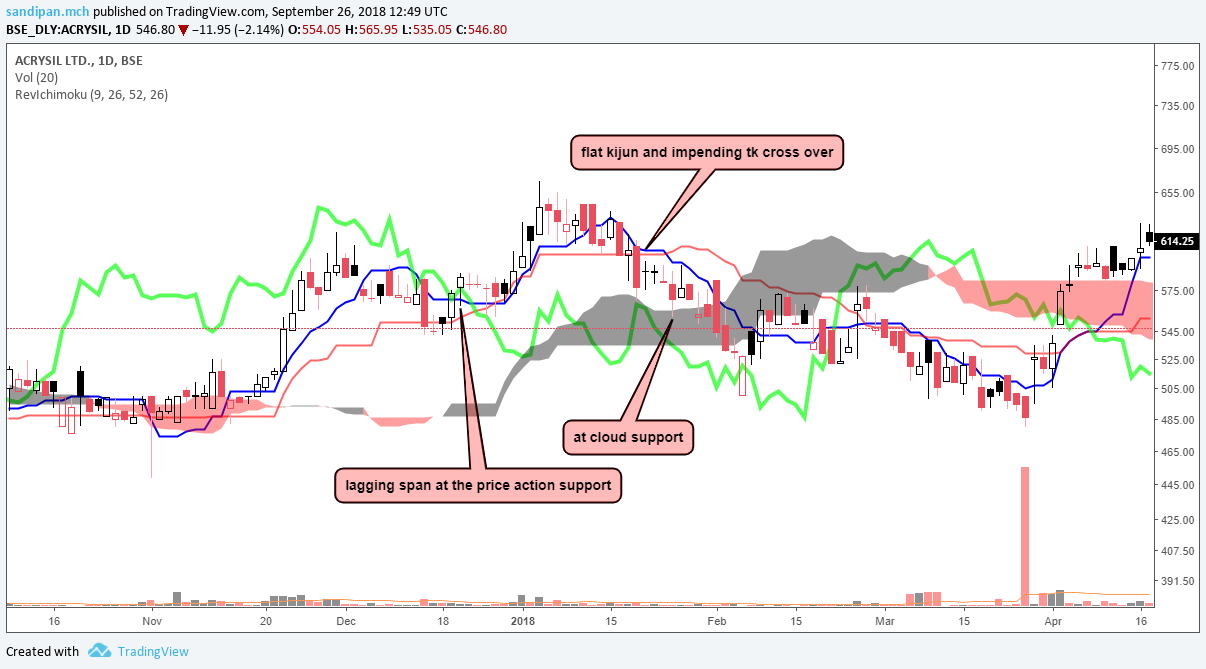
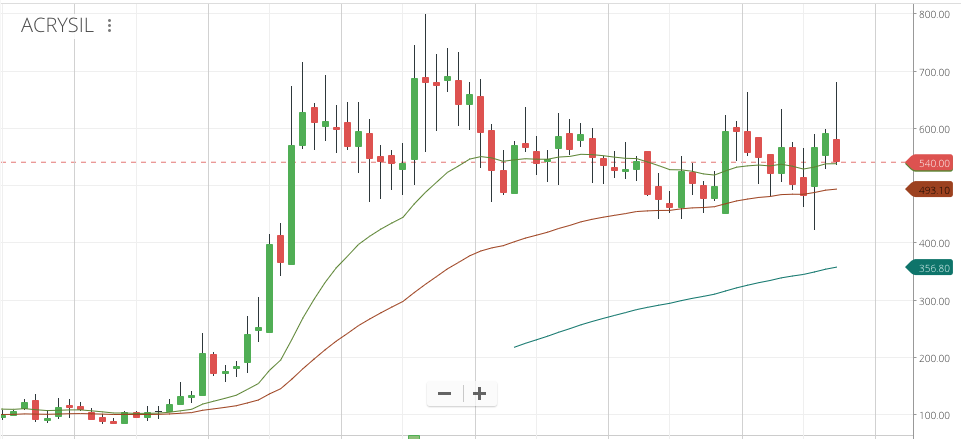
acrysil…
not happy with what happened after that climactic stopping action at the top, which i missread to be a smart money entry
the daily has support of most of the moving averages now
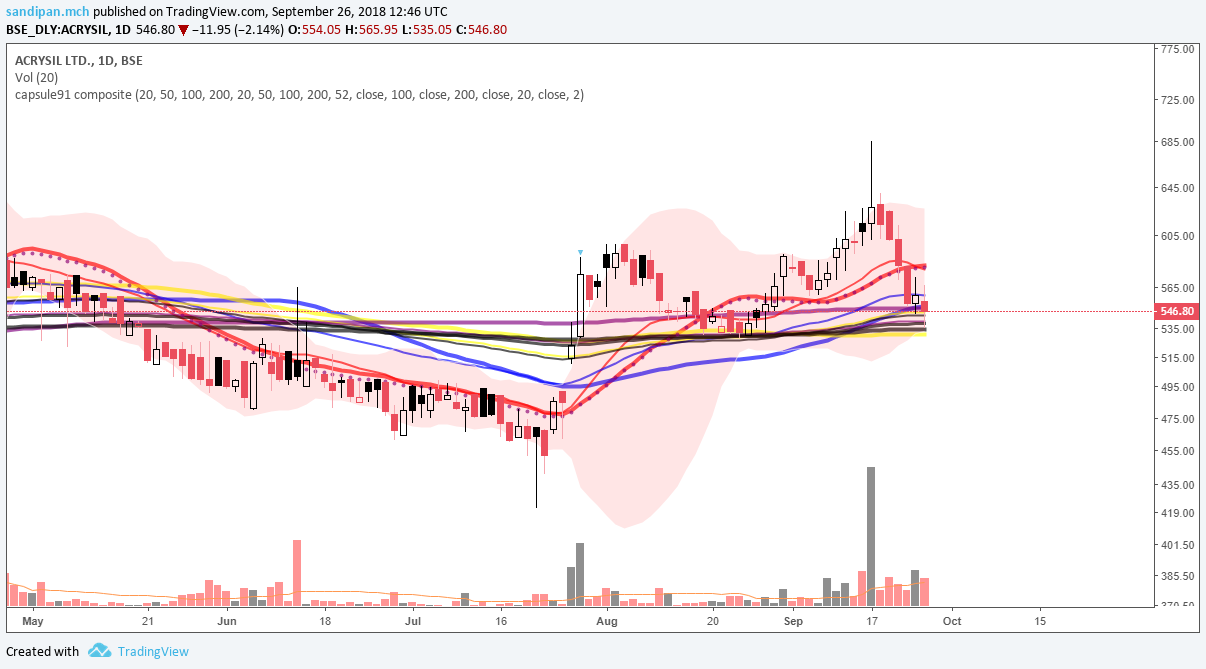
the ichimoku setup is at support
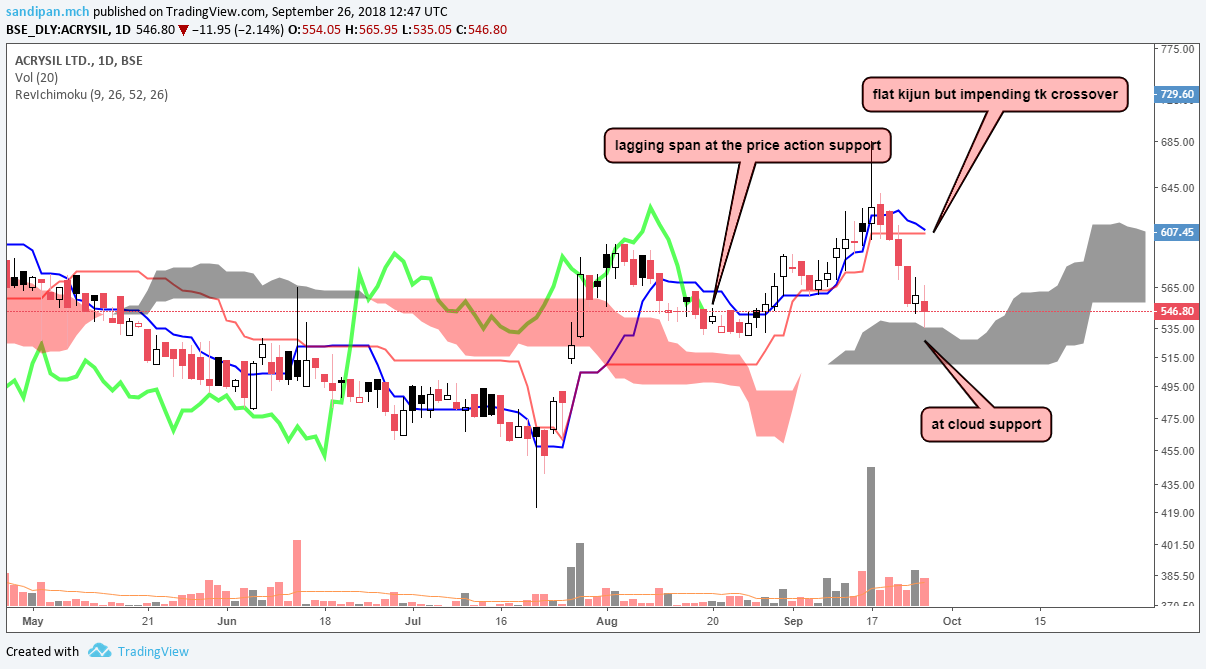
BUT, the same setup again happened back in jan, when it corrected significantly…
in the monthly, the same tri candle setup which broke down previously… good thing is it is occuring at the cloud support in the monthly… with the lagging span in the price action and the TK hasnt crossed over yet…
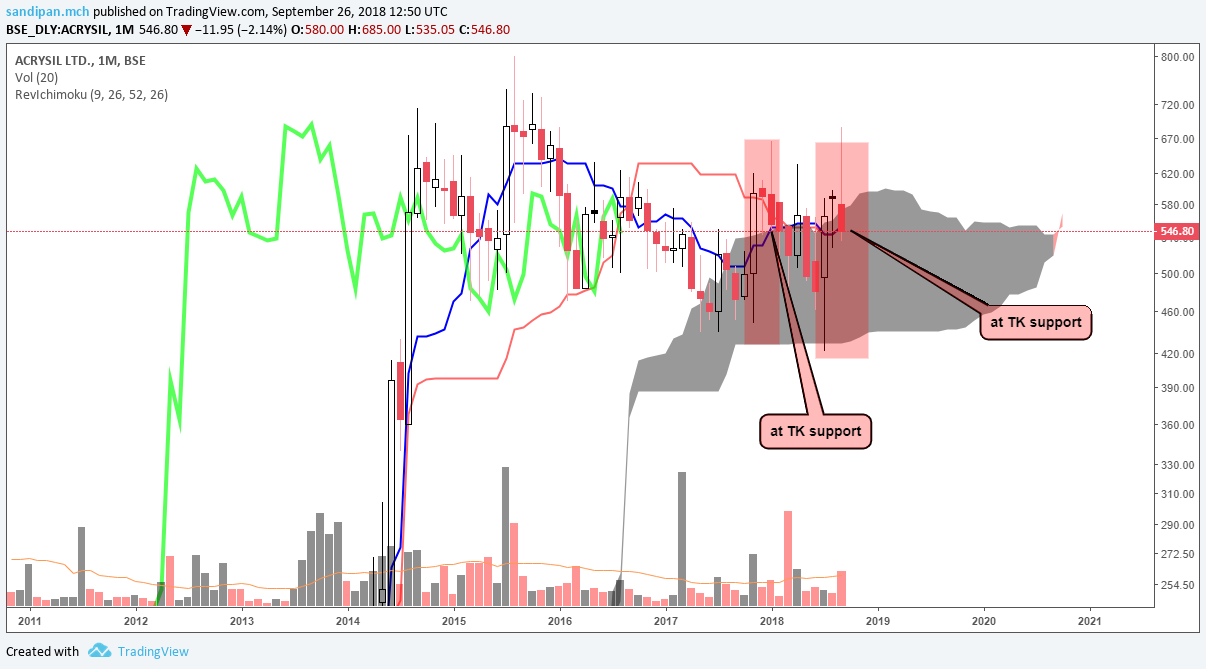
whats different now from jan, the q1 results, the expansion plans going through finally, and the equity infusion is done, 1 concall , 4 institutional investor meet with the management…
whats not different is the nifty…
period.
disclaimer… invested
3 Likes
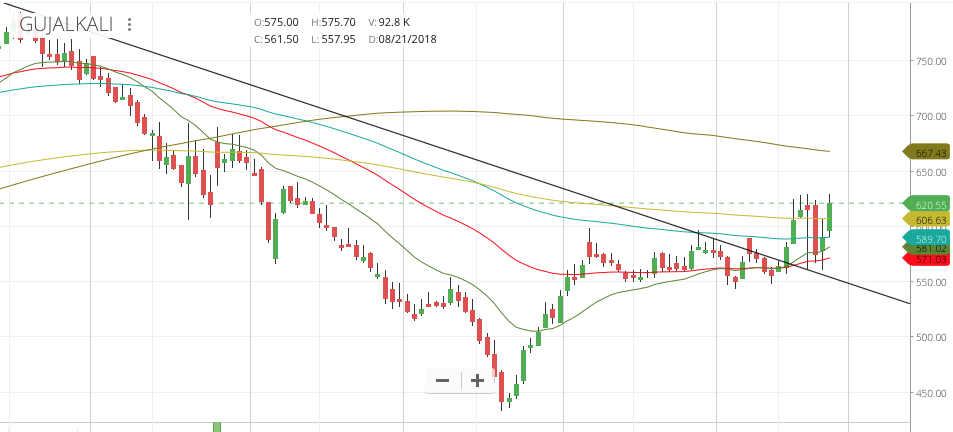
GujAlkali update - The earlier close above 200 DMA was weak and understandably broke down along with the market meldown but pulled back up to close above 200 DMA.
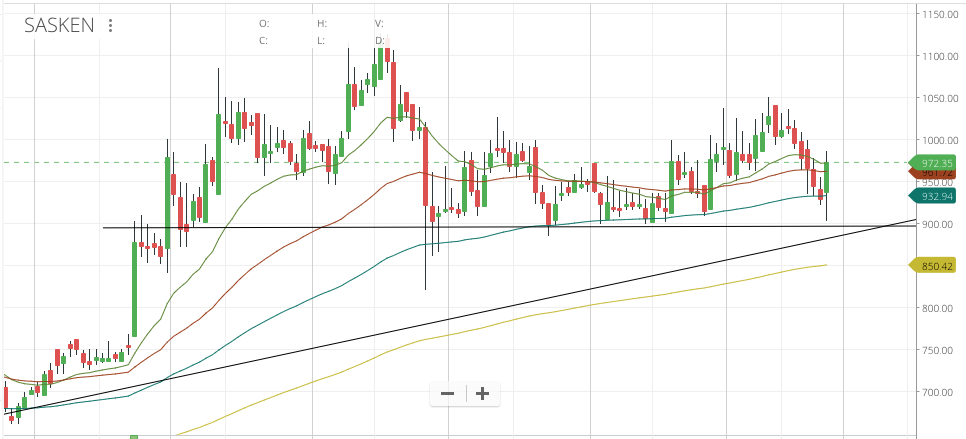
Sasken update - Took support on the 100 DMA and pulled back up strongly on a weak market where IT index was down.
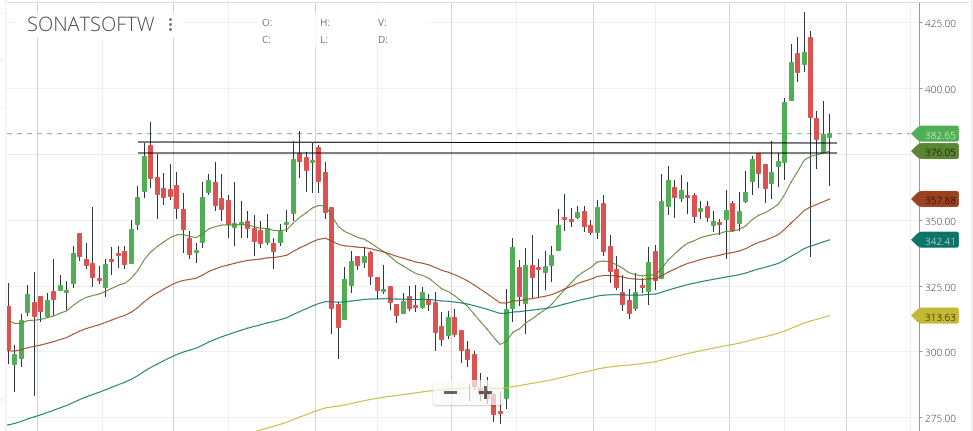
Sonata update - The previous breakout failed with the market meltdown and it re-tested the breakout support which seems to be holding so far. Pulled back up big intraday to close above support showing strength.
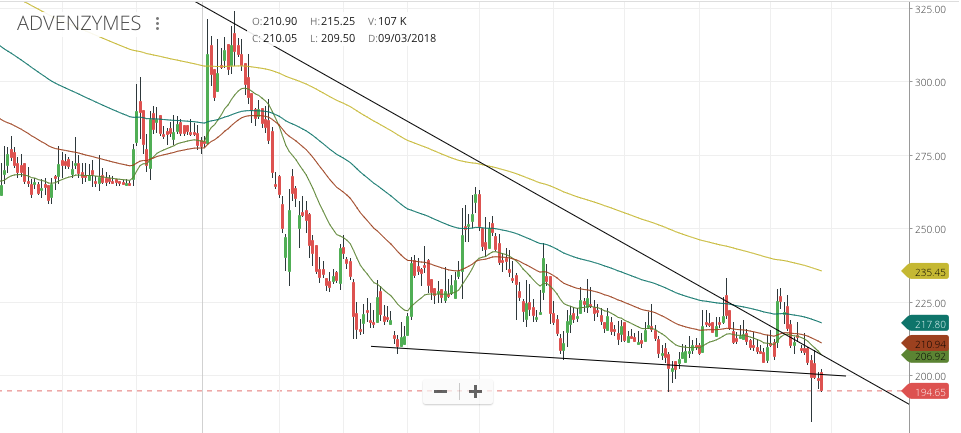
Advanced Enzymes - Exited position as it looked to be breaking down. @Capsule91 was spot-on in identifying weakness despite the breakout. Now the lower support has broken as well and it has started to close under 200. Weak
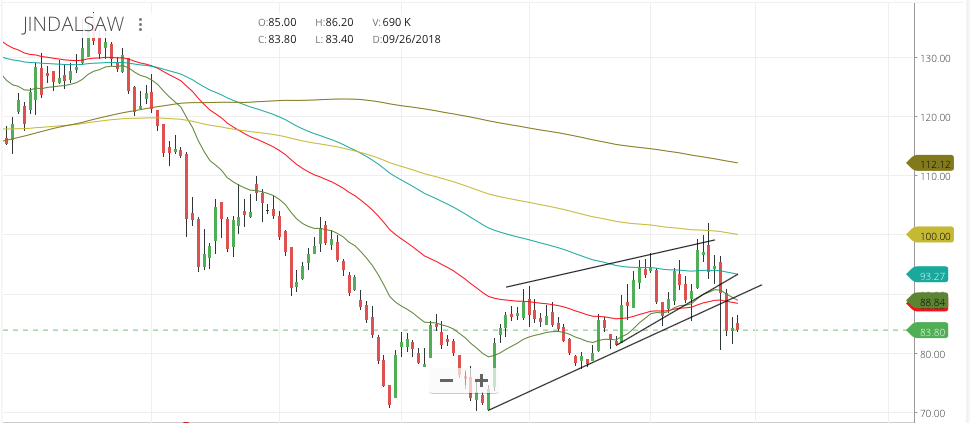
Jindal Saw update - Support broke, S/L triggered.
Acrysil update - Monthly - Taking support on the 20 month moving average. Odds of a breakout this month are slim.
Parag Milk weekly - Broke down from a rising widening wedge (this sort of setup is usually bearish).
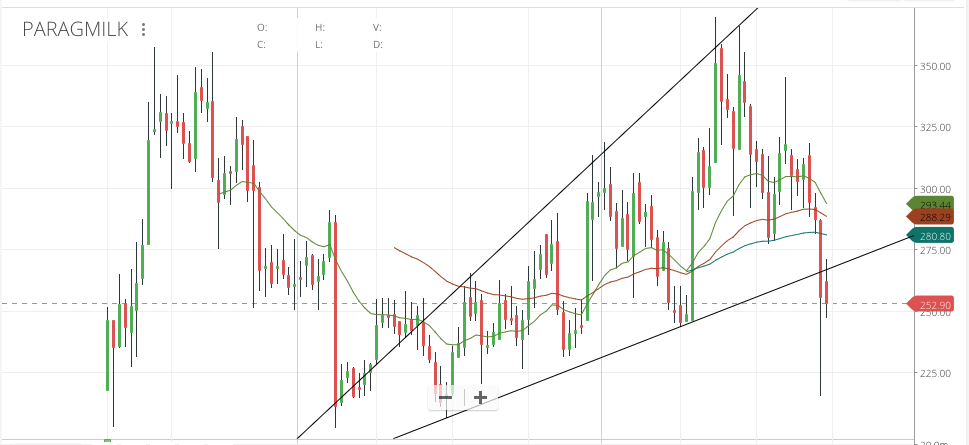
There is something about the way Parag Milk, Ujjivan and Advanced Enzymes have broken down. I had all these three in the portfolio as under-performers (Still hold tracking positions). I assumed that these had bottomed out and the valuations were relatively reasonable (relative to their peaks that is). The fall in price along with the increase in retail holding quarter after quarter and now the breakdown indicates that the IPO distribution is not yet complete in these counters.
Parag - IPO May 2016 - Issue Price Rs.220
Ujjivan - IPO May 2016 - Issue Price Rs.210
Advanced Enzymes - IPO July 2016 - Issue Price Rs.179 (Adj. for 1:5 Split)
That’s too much of a similarity in price-action. I think demonetisation put a spanner in the works of the distribution. Though these seem to be decent businesses which are on an uptrend financially, the technical side of things looks gloomy. The recent meltdown has been a good litmus test on identifying strength.
Disc: Holding Sasken, GujAlkali, Acrysil and Sonata. Sold Jindal Saw and Advanced Enzymes as S/L triggered. Folded those positions into Sasken and GujAlkali earlier in the week as they were showing better strength. Sold Parag Milk from the portfolio so all the three 2016 IPO laggards are out.
3 Likes
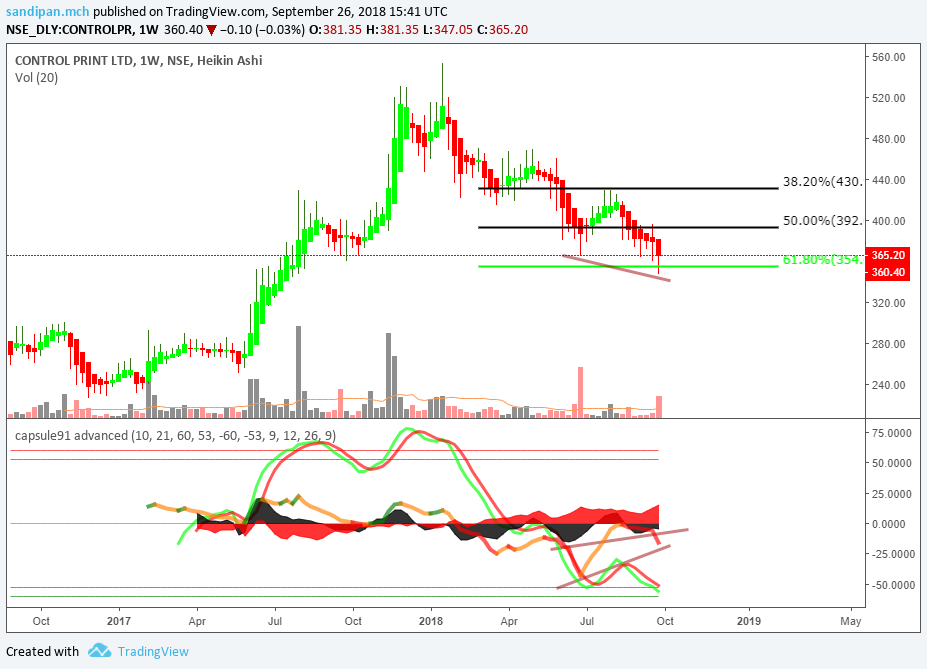
control print is showing bullish divergence at the 61.8% retracement…
taking just the smaller base in ador fontech… it looks like almost completing the lps at the trendline…
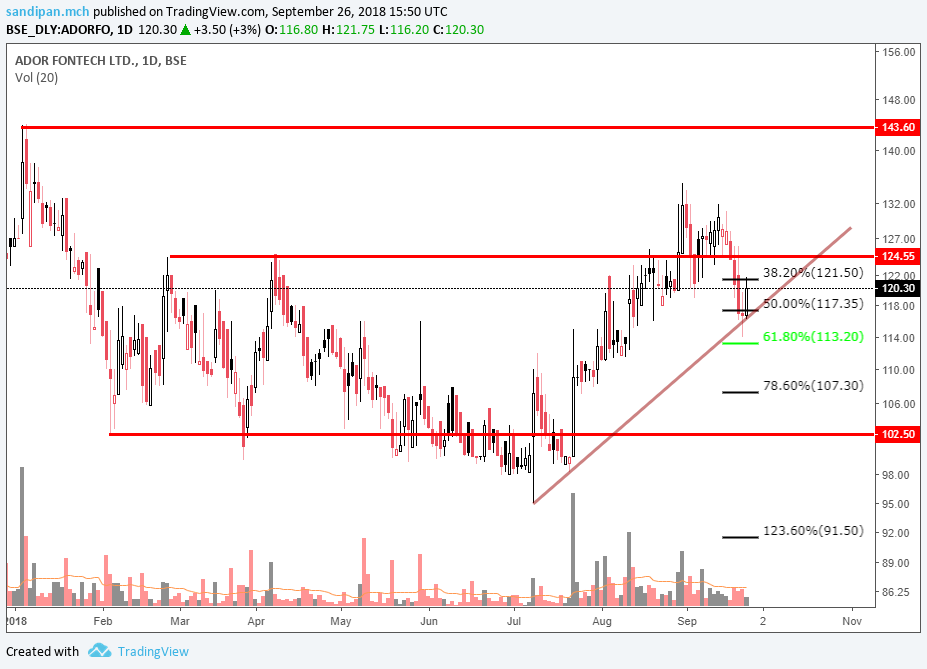
although no arithmetic indicators suggests a selling exhausting, infact the ichimoku system has a bearish TK cross, although over the cloud support which has been tested on a wick
the bullish candle today is not confirmed by volume, the only analysis possible for the volumes is that the sellers were not interested in todays session…
disclimer… holding ador and averaging
deepak nitrite positive response from the market, although it should take out 300 on volumes to be very sure… but this seems like wave 3 on going
vendanta looks like a rising wedge, but the last few days with so much volumes there was not much downside… also the volumes of the red candles at the demand like consistently fell…
interesting to watch what happens here…
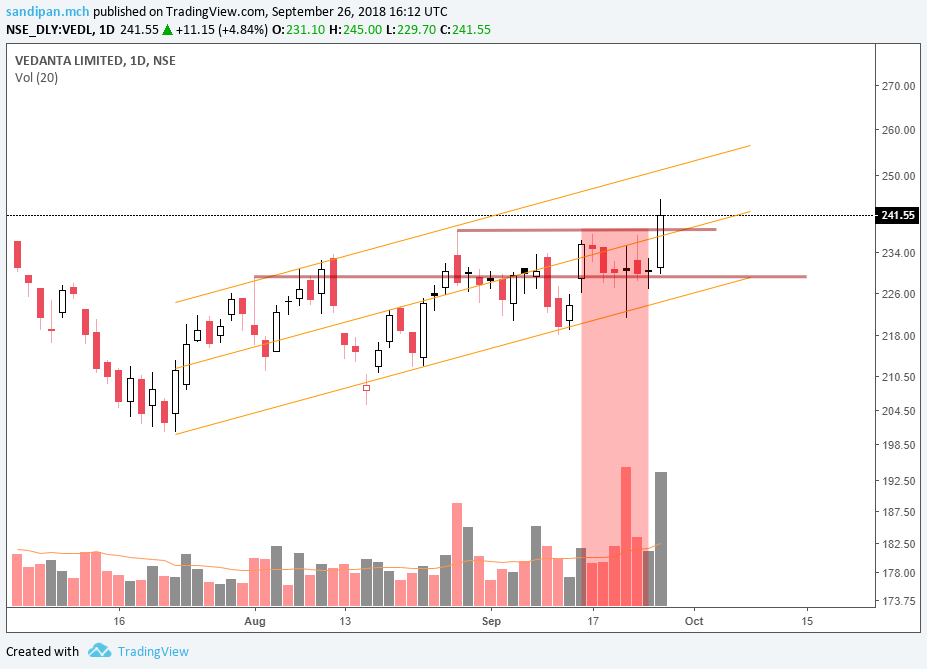
also there appears to be some good change of character inside the wedge…
1 Like
the situation of oversupply is ultimately going to bite back the tyre space, and for smaller companies like tvs shrichakra, is going to be more difficult…
although the import duty raises expectations, but the chart pattern clearly is throwing any positives in the bin, in a rising crude scenario and quest for capacity expansion…
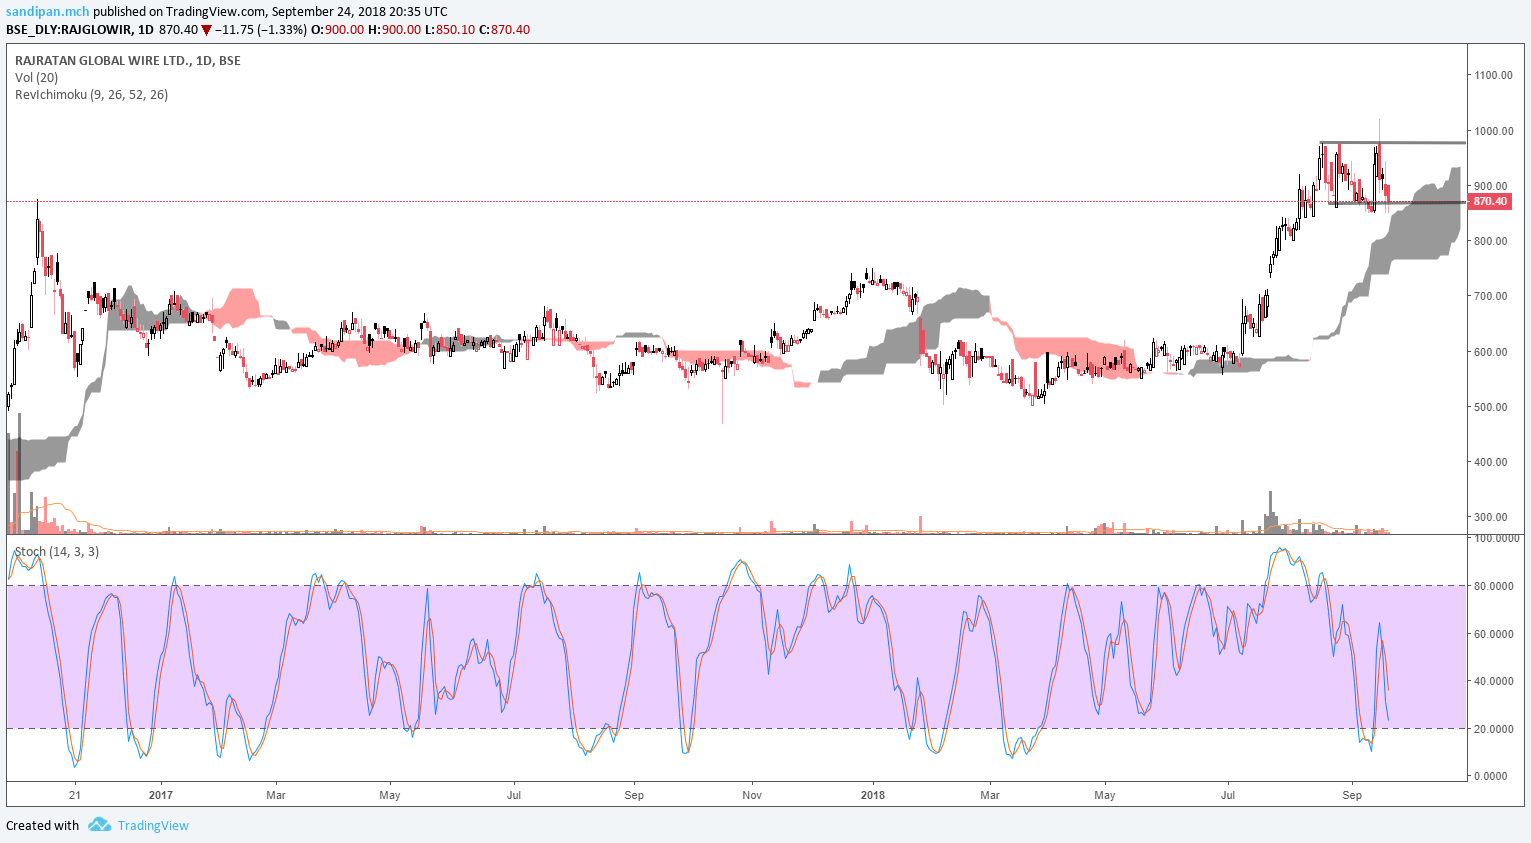
the best proxy i have to tyre industry is rajratan global, which being a dominant player, would be able to bargain margins , although the supply from china remains an issue when the tyre makes finds it a pricing channel, yet, companies like ceat with which rajratan has long term contracts remains a preference…if nothing else, the volume increase would definitely be of interest in rajratan…
i noted a classical distribution in tvs shrichakra…
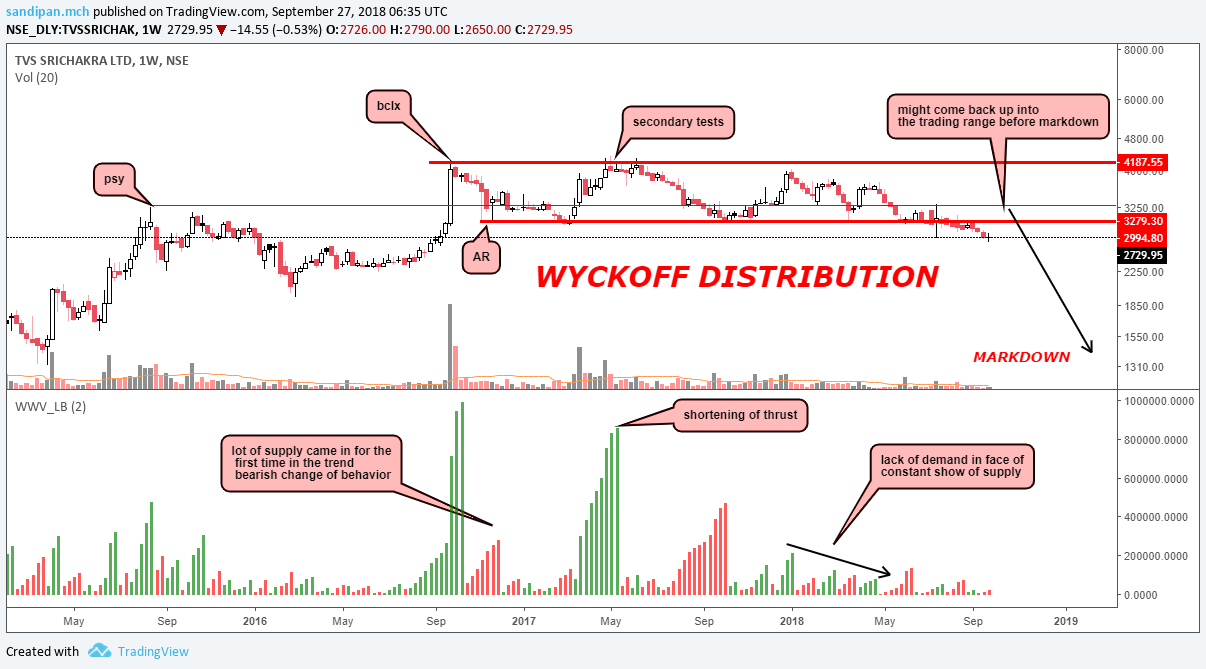
disclaimer… tracking, not invested
1 Like
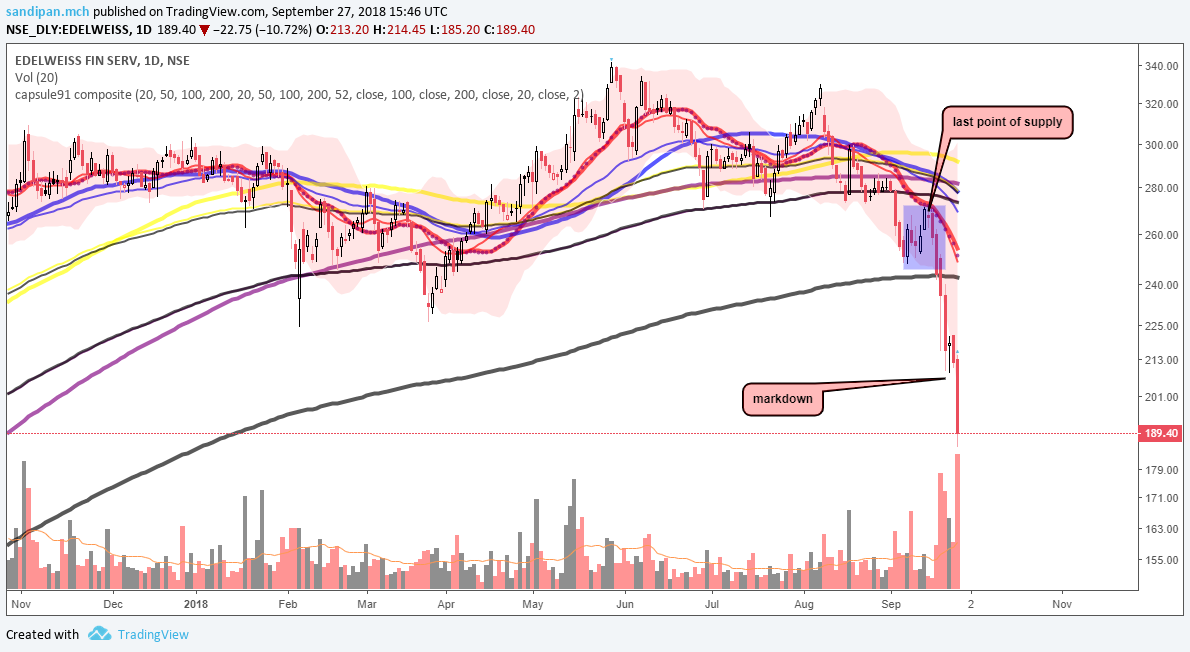
edelweiss…
although this post has only academic value now…
this is how the last point of supply happened and continuing markdown
2 Likes
something very disturbing…
technically…
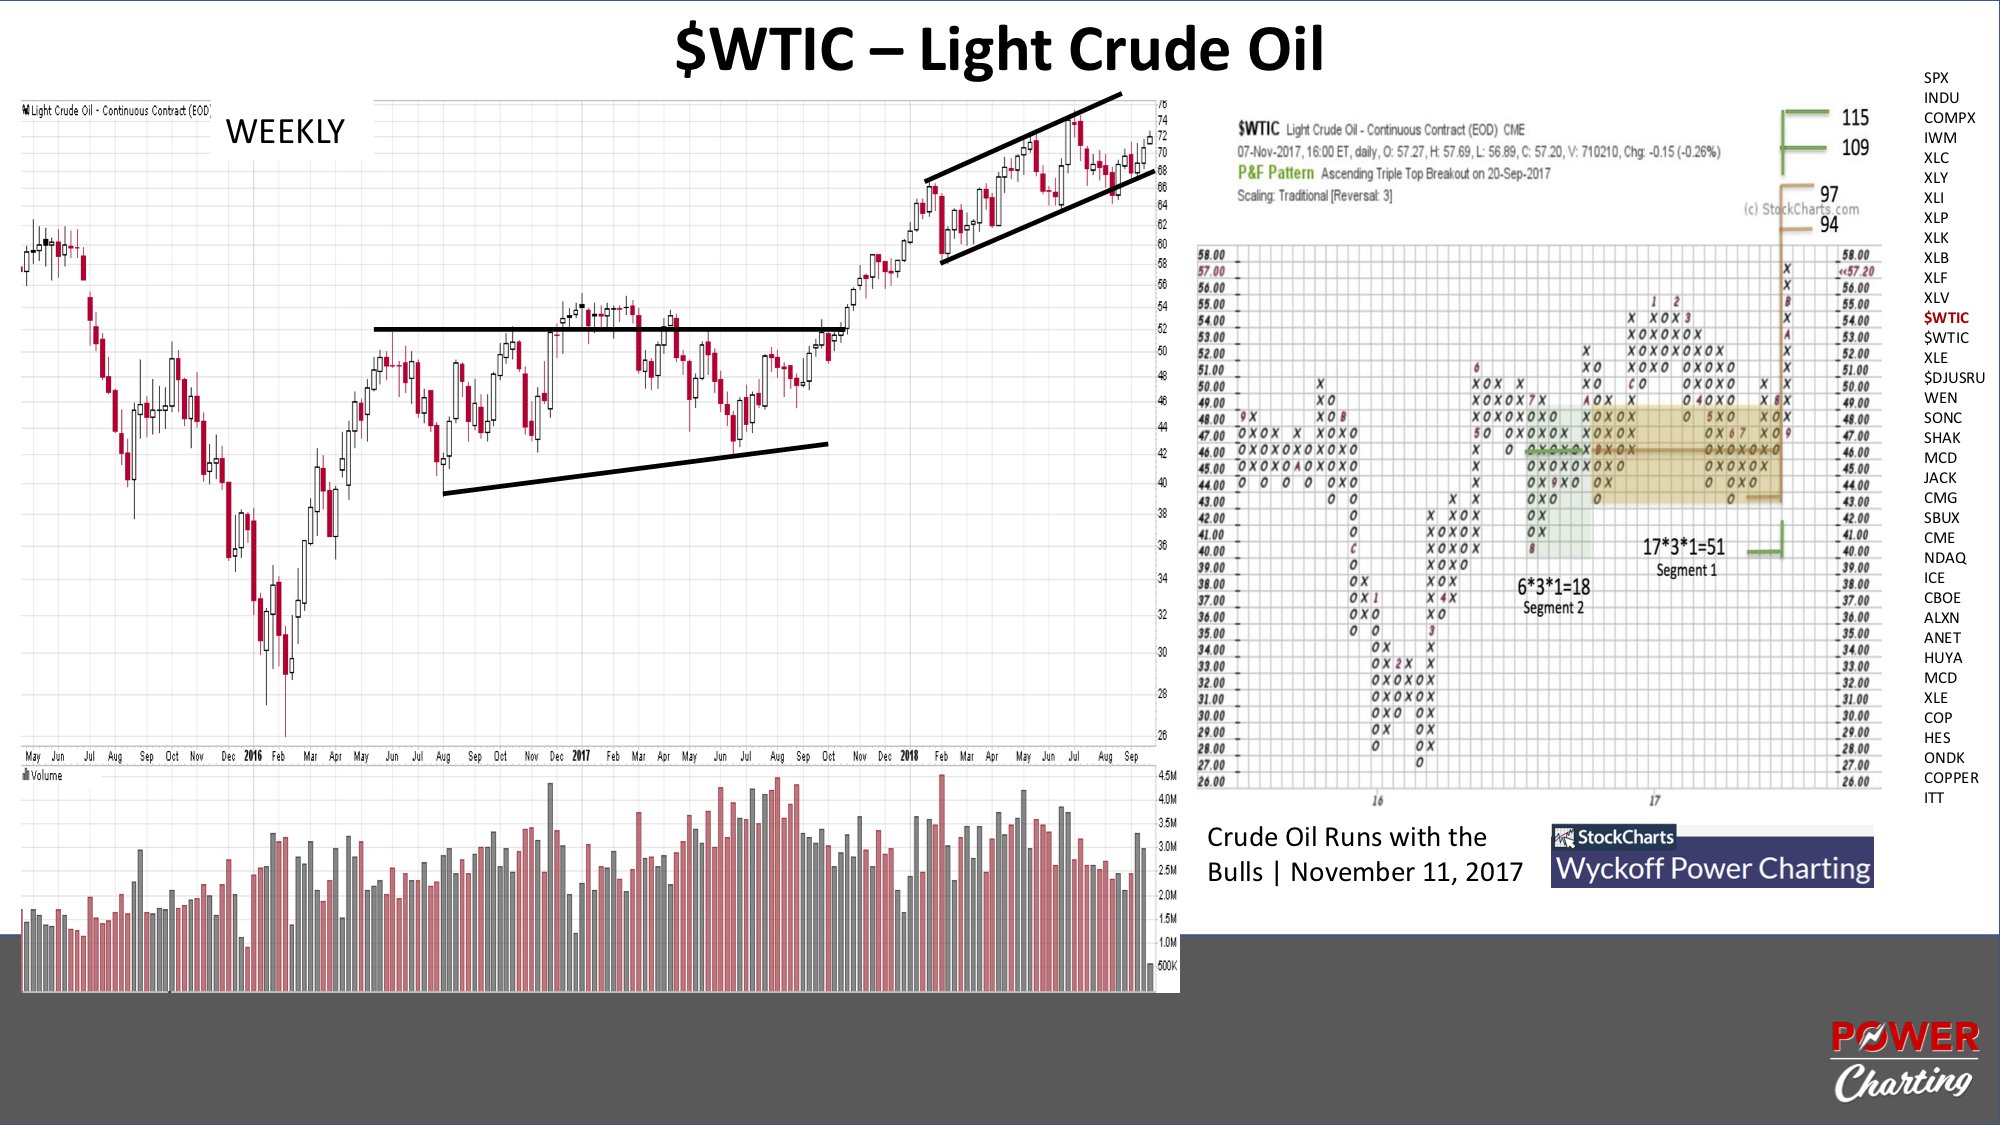
till now, point and figure counts, are very accurate in predicting rotation points…
all it can be interpreted now, as the amount of potential the demand has before supply rotates its formation…
the shared link , has been posted in the twitter account and is by the leading wyckoffian goup of todays times…
applying technicals to the usdinr chart…
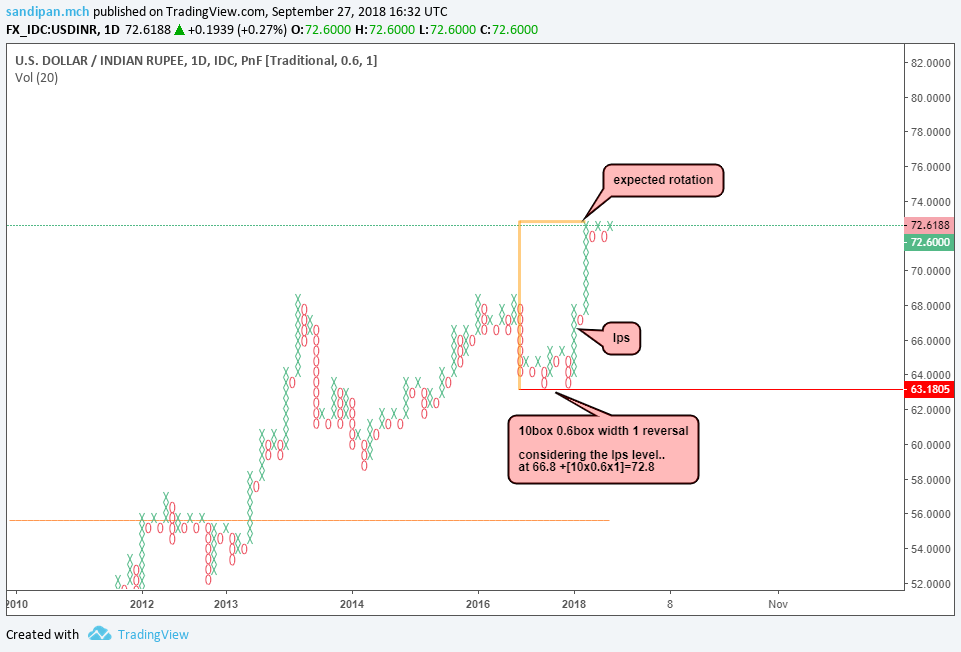
the present price action should be a rotation point
1 Like
Any hope of stopping at somewhere? this has been one hell of one way journey. Reminds of falls in 2008 but even then it took few months to achieve this kind of damage.
the volumes that are being generated , speacially today, indicates a lot of shares are getting transacted and a heavy orderbook, meaning the bid side is also active…
the golden ratio is at 158… that area might be of importance, and a redistribution might start…
i would absolutely refrain myself from buying those levels…
I personally see support at 130.
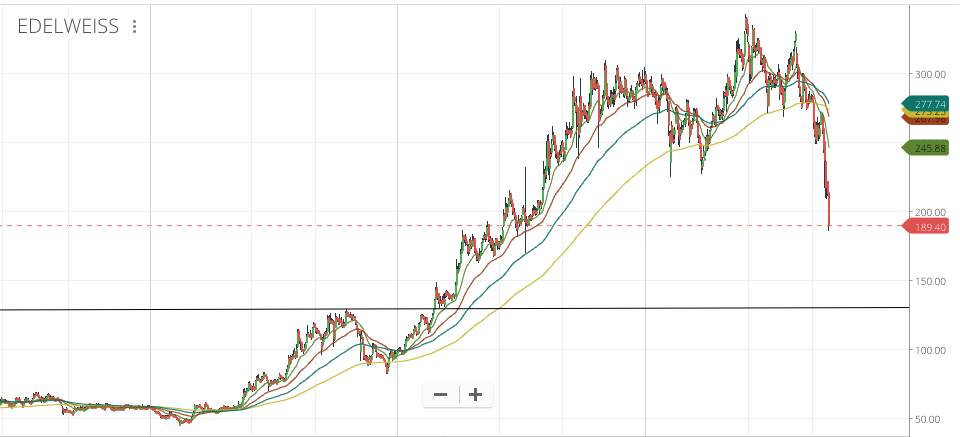
It sounds outlandish considering the fall but it may not completely be.
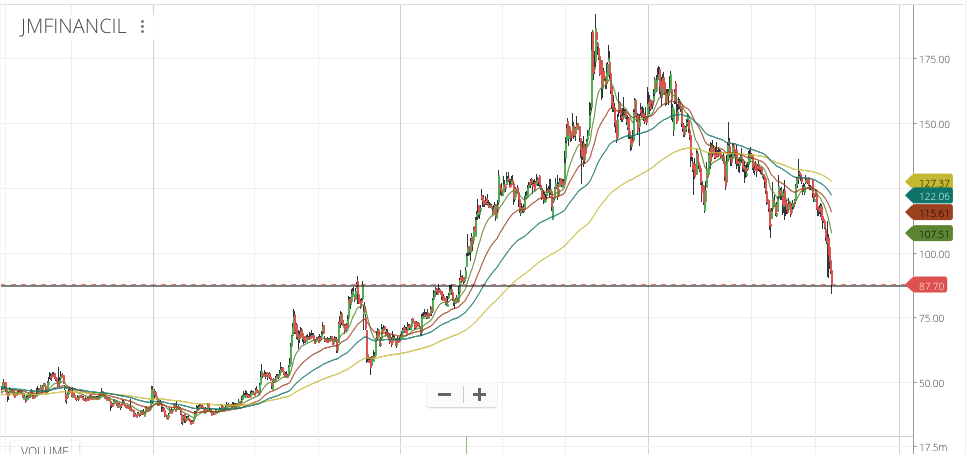
This is JM Financial (The other unglamorous peer) which has already gotten there (demonetisation levels).
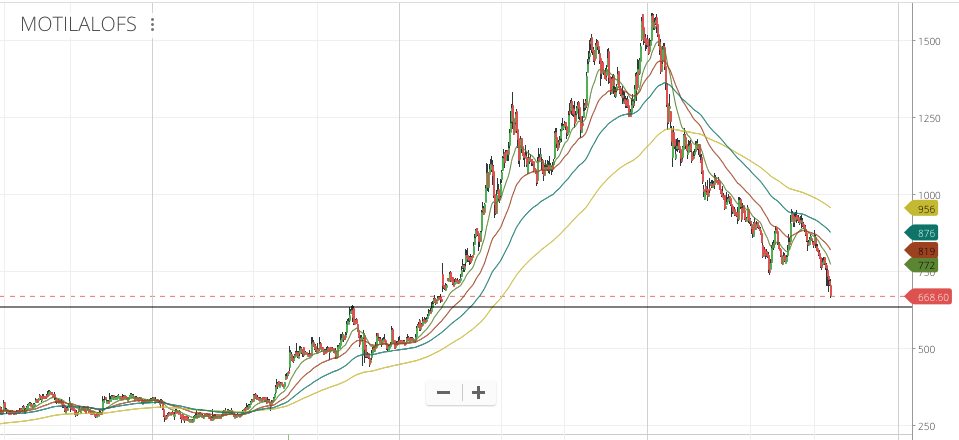
This is MOSL which is almost there
Another reason why I don’t think this is outlandish is the historic P/B for Edelweiss is 1.5-1.8 times. Current Book value is about 72. 1.8 times book brings it to 130 which is the demonetisation level support.
Not sure if it will get there but relative valuation with peers and relative valuation historically and technicals all point to it. Lets see.
2 Likes
How the Indigo chart looks like… i know directionally very week since its significantly to 840 level… Whats charts look like for this counter…
I think 72 was for March 18 n extrapolating for Q2, should be around 84. So, at book value of 2, comes around 170. Why I m taking 2 because during demonetization. It got available around 2. Why m not taking historical range because businesses evolve . The level of risk 5 years back and today may not be same n I think Edel has done well on that front. I ve very superficial knowledge of financials, so, please take my message with caution 
2 Likes