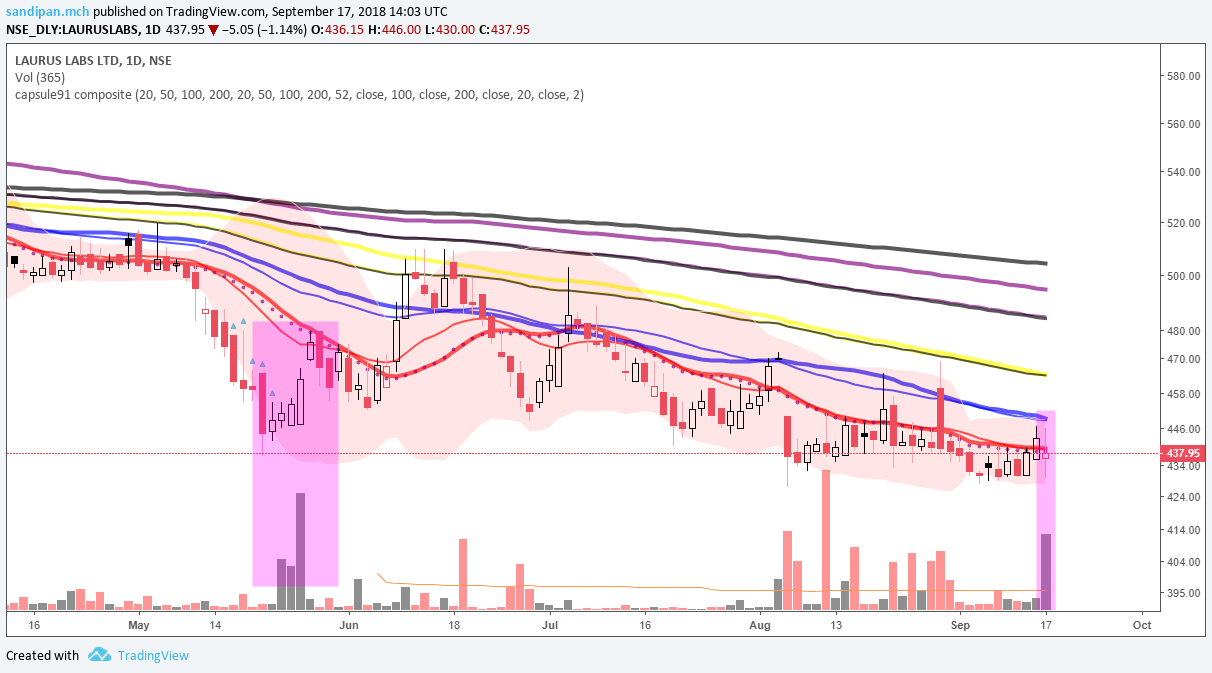
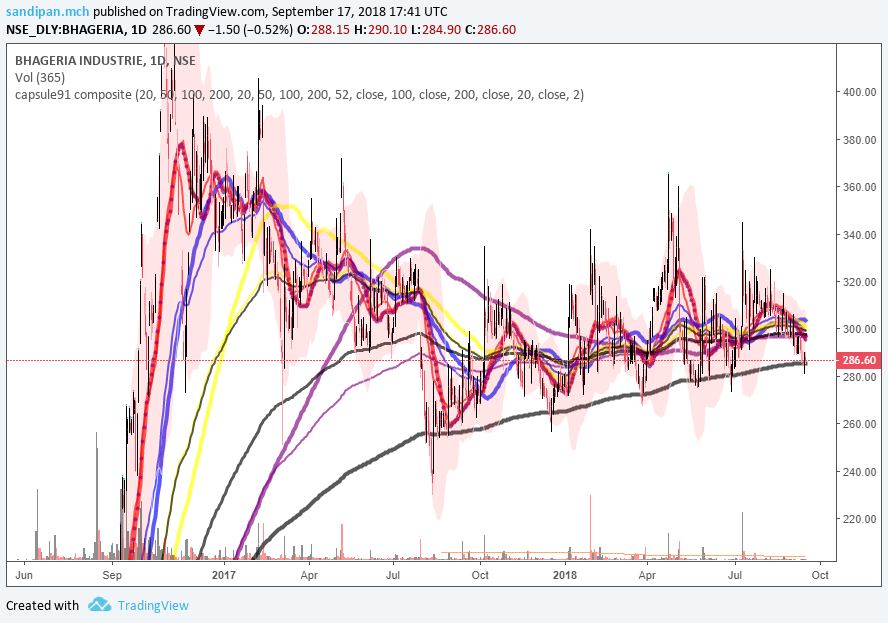
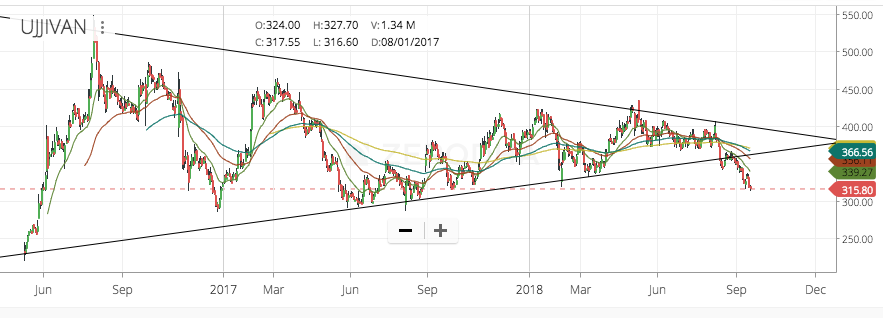
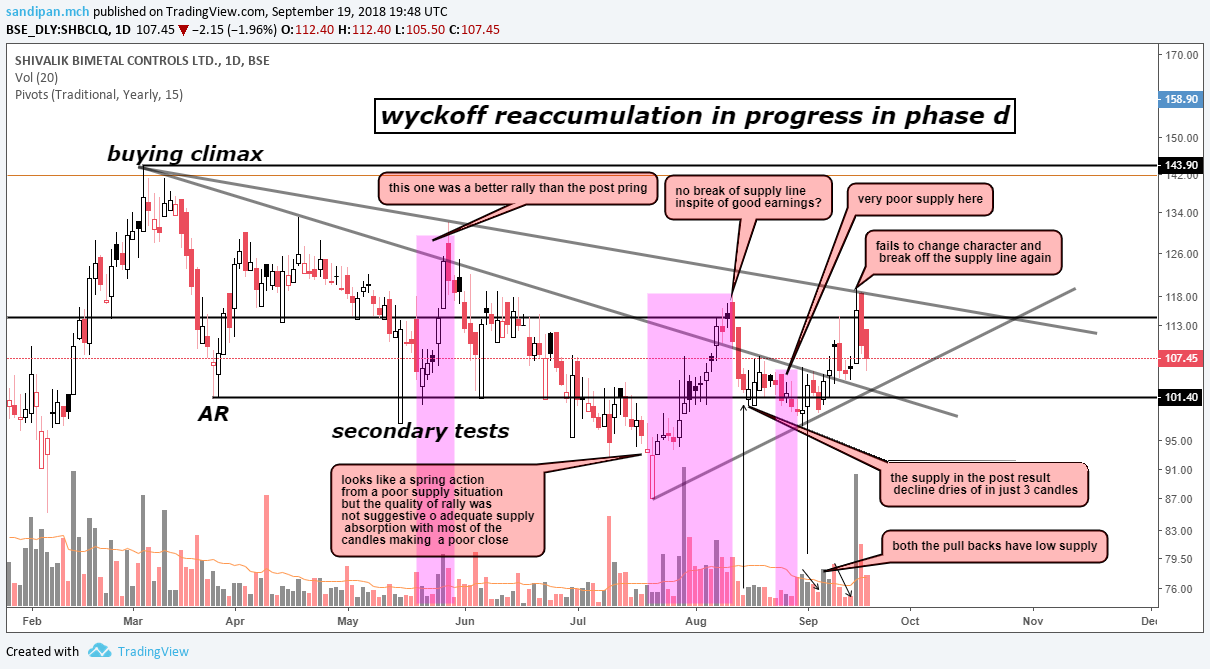
one hell of a messy chart…
short selling, retail trapping, and god knows whats going on, on top of that, today i noted in the weekly FREE mail service of iifl, has mentioned a buy …
today’s volumes were significant with no resultant price action movement…
rest of the week sud be very important…
also note the squeezed bollinger band
a look at the volume candle chart, and i am sure head starts spinning, so much so that, i would rather buy on fundamental conviction , rather than techncials…!
one thing for sure, i see supply, not able to do anything to the price action anymore, potential exhaustion…
dont know, after this reco of iifl and may be others, there might be bull trapping also, and further test of supply down below…
disclaimer… no positions, as yet, interested when the base theory goes in market’s direction
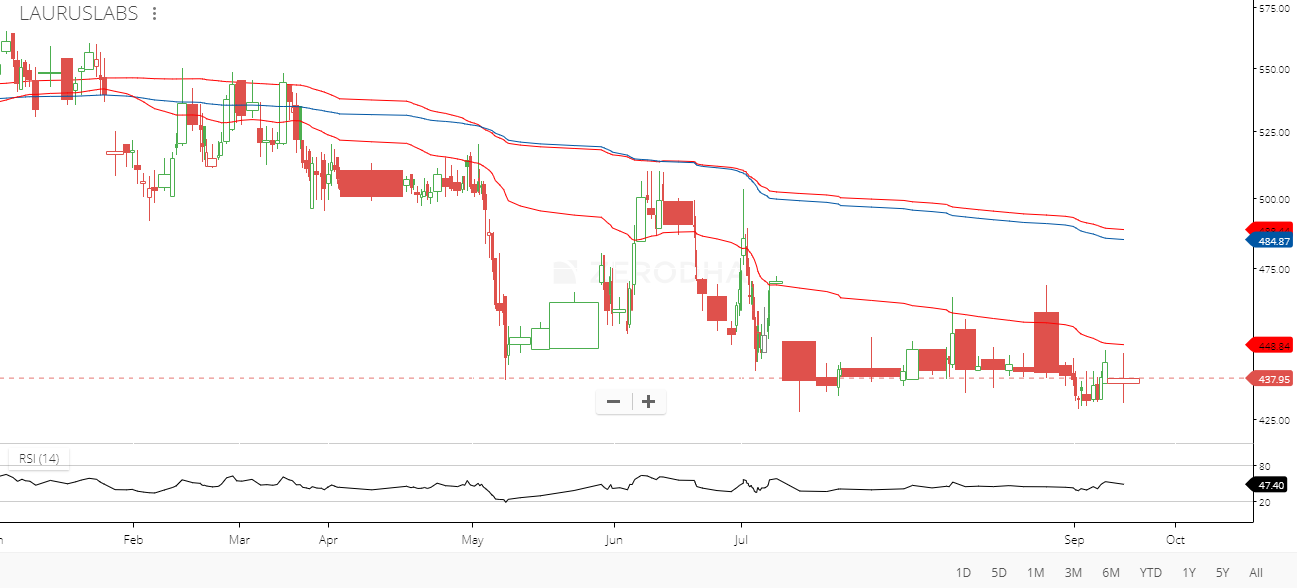
Those big volumes are most likely some big players offloading to an intermediary who will then proceed to distribute. Think of it as wholesale and retail. The daily volumes are too low for a big holder to offload efficiently. Even today, of the 4.2 lakh volumes, a single order was 3.5 lakh shares where the price didn’t budge. The distributor needn’t really sell it at a higher price either as they might get a commission for doing so within a price range. I have noticed these things happen usually in stocks that have recently had a public issue. The institutional holding hits the streets after all the marketing hype.
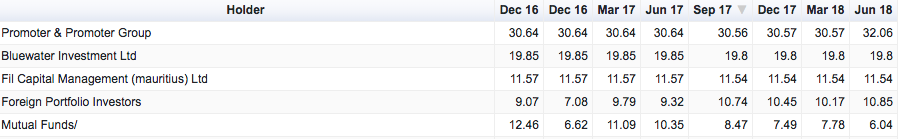
This is the shareholding pattern for Laurus Labs. See how the Mutual Funds holdings are on a steady decline.
At 6% as of June '18, that’s still about 60 lakh shares. Average volume in July is just about 20k shares per day. Going by the recent 3 quarters, the performance of the company isn’t great either. Current price is fast nearing the issue price as well. Clearly not a good situation to be in. Just my 2 cents.
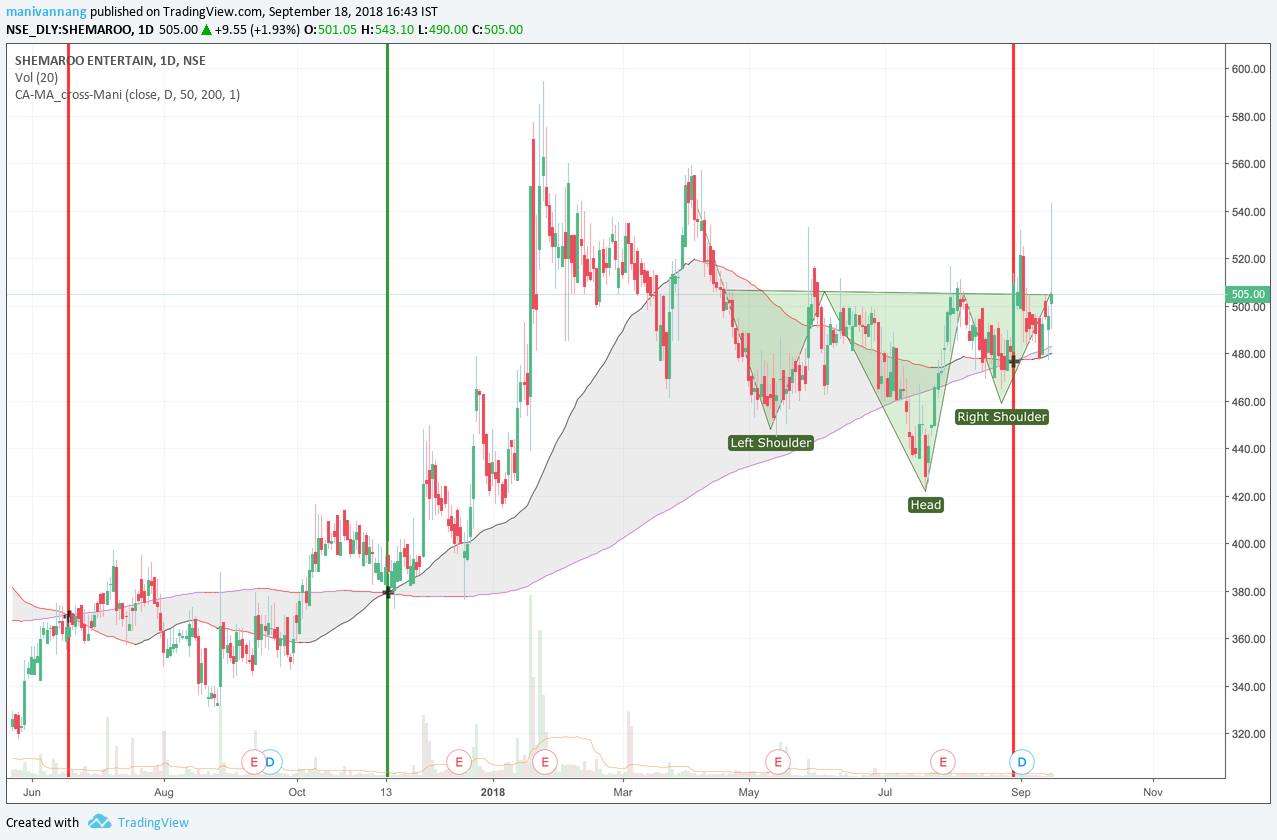
market is still in indecision , but a dragonfly doji at the base, looks a bullish bias …
todays candle was neutral…
the stock is respecting the 200day wilder moving average like a monk
another thing to note, is in the close up view, the 3 dojis make a tri star candle stick pattern, a very very rare reversal sign, no experience with it, once falacy is there though ,in cassical tri stars, the second doji should gap down, which it didnt…
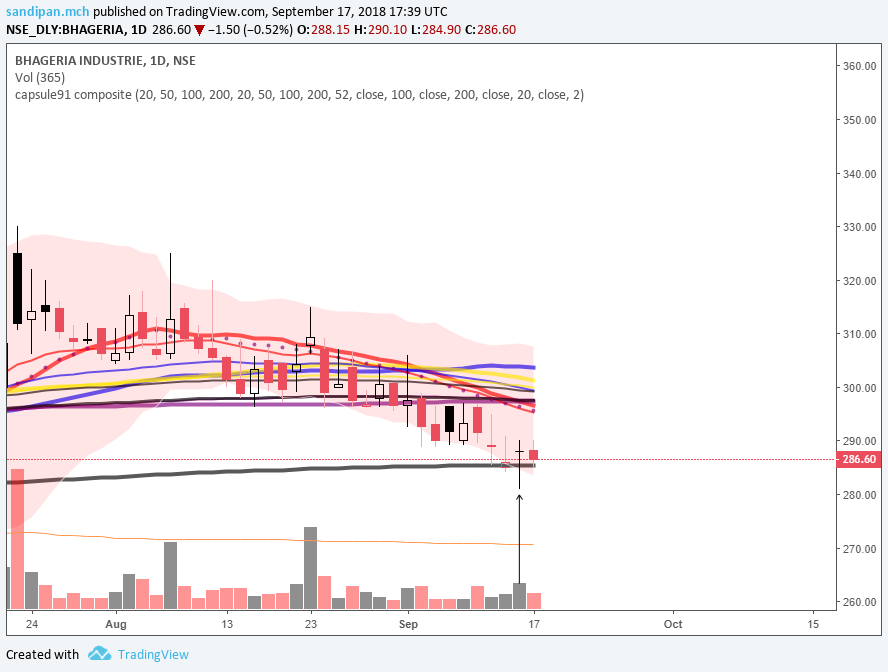
persistent…
no signals after harami cross in daily at the 50ema, yet
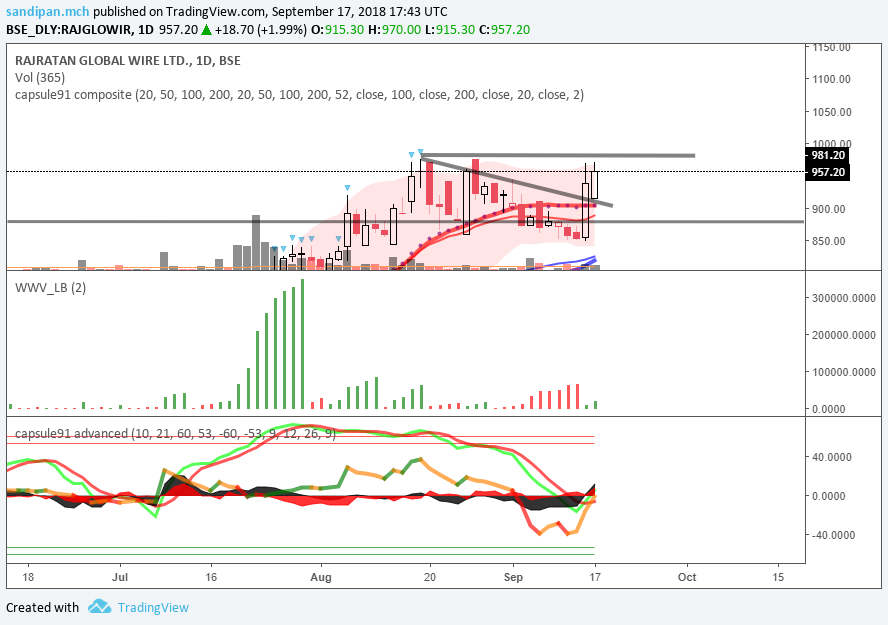
rajratan…
planning to take position, on close watch…
the supply was weak enough not to cross much byond the previous top, and instead looks like good buying has started, closing above the small downtrend line…
watching a close well above 981, to be sure if there is no possibility of an upthrust , or if there is any retest of supply, will catch that…
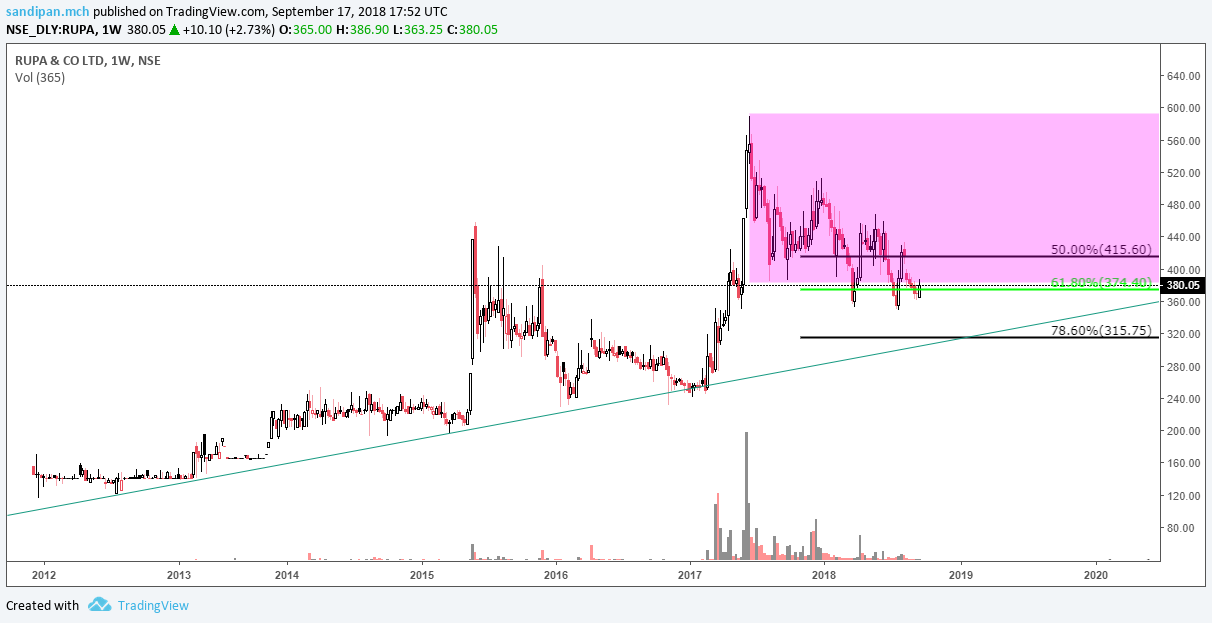
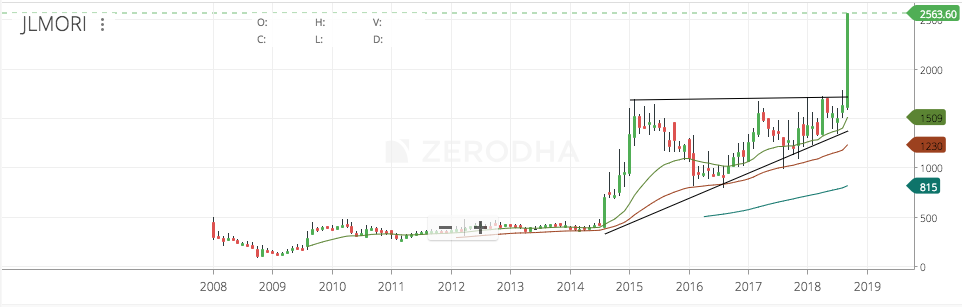
this one is a very immature chart now… but there are clear signs of accumulation, will no go into details of it…
just informing the thread, to monitor it, might become interesting in one or 2 years…
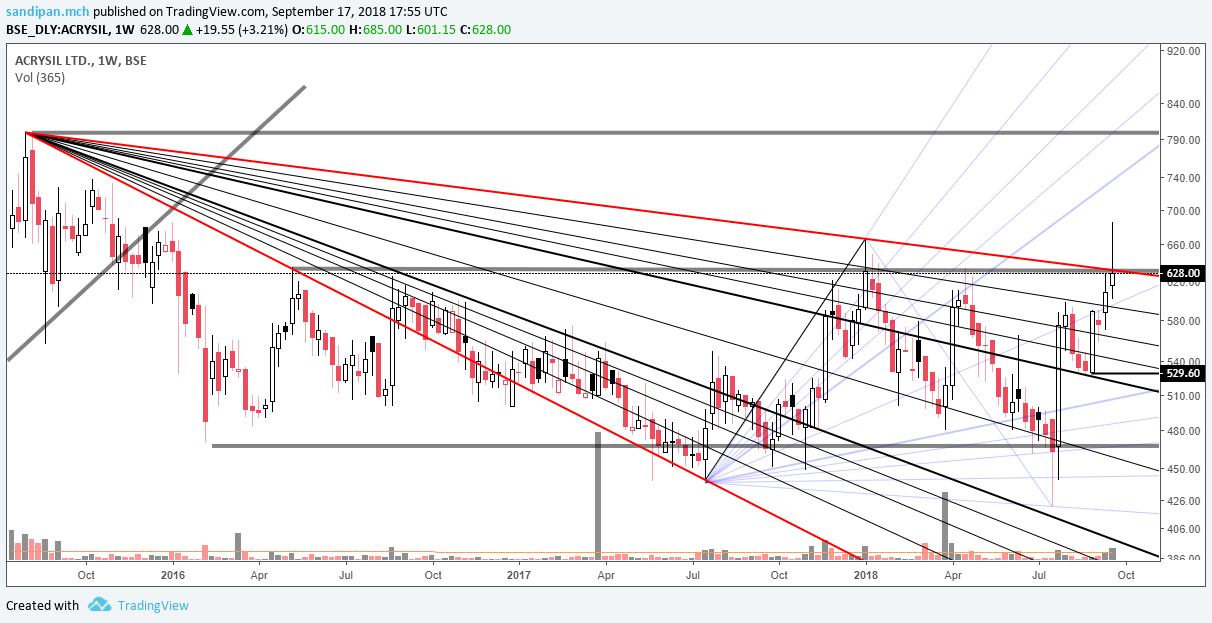
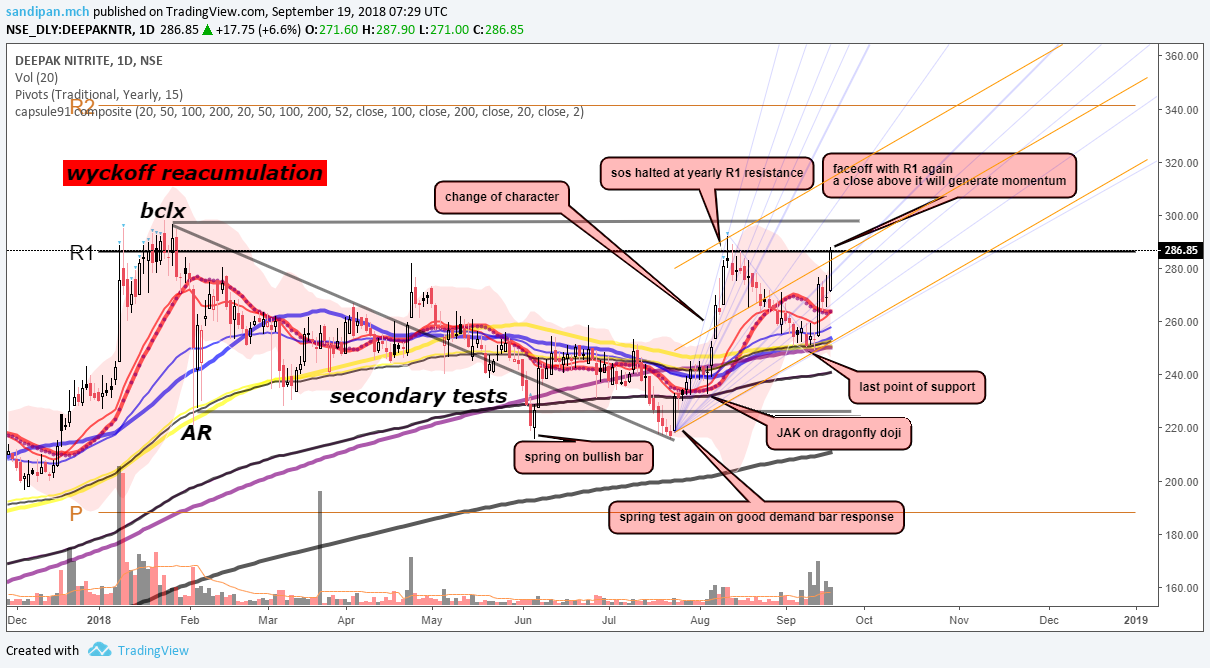
looks complicated, its not… there is clear resistance form the upper red fan line, which is the base fan of this reaccumulation , then again, the stock is ncely moving up from the middline of the blue fan, so short term it seems ot have enough momentum to break the red fan line, and once that happens, it will be nice…
expecting q2 to be better on volumes and realizations…
hopefully strenhagen dosent disappoint again, specially, as they have launched sternhagen in uk, in q2, as was planned…
demo and gst excuses, are well behind us, its enough…
a bullish dollar might aid to the topline [also hurts the consol margins a bit due to foreign currency loans one of the subsidiary has]
kiocl…
excellent spotting by @NamantS and good conviction by @manivannan.g, the triangle breakout was damn strong…
congrats to both…
[ @NamantS, next time we discuss any charts, please mention the kind [duration]of positions you are interested in so that we can be on the same page. from a longer term view,
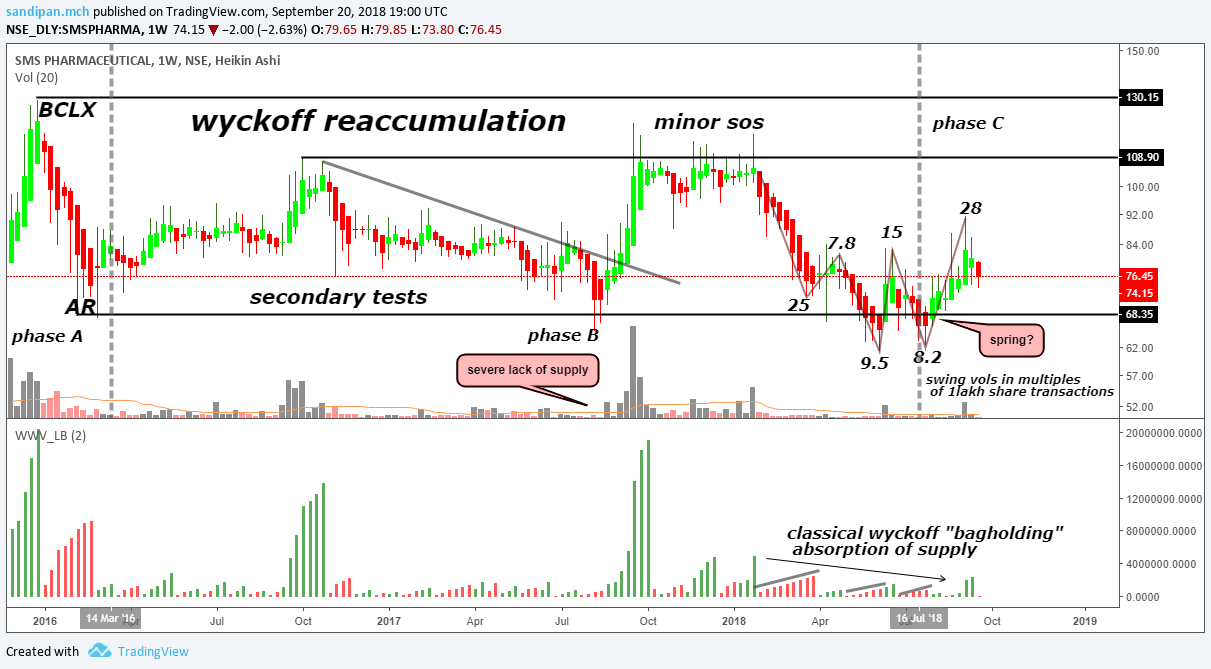
the chart just got me excited after this move , as it has made a breakout across the range i was considering to be important, now the supply generated after this move is going to be crucial, id the absorption is complete or not, if not, then further shakeouts will be conducted, if yes, the phase c to phase d transition in wyckoff schematics starts, and phase d is where wycoffians take their winning bets… Chart Image — TradingView ]
aksh optifibre…
the support line is not holding for today atleast, although in a bearish broader market, reading too much into a twizzer bottom candle could be tricky…
but this is something very upsetting for the bulls
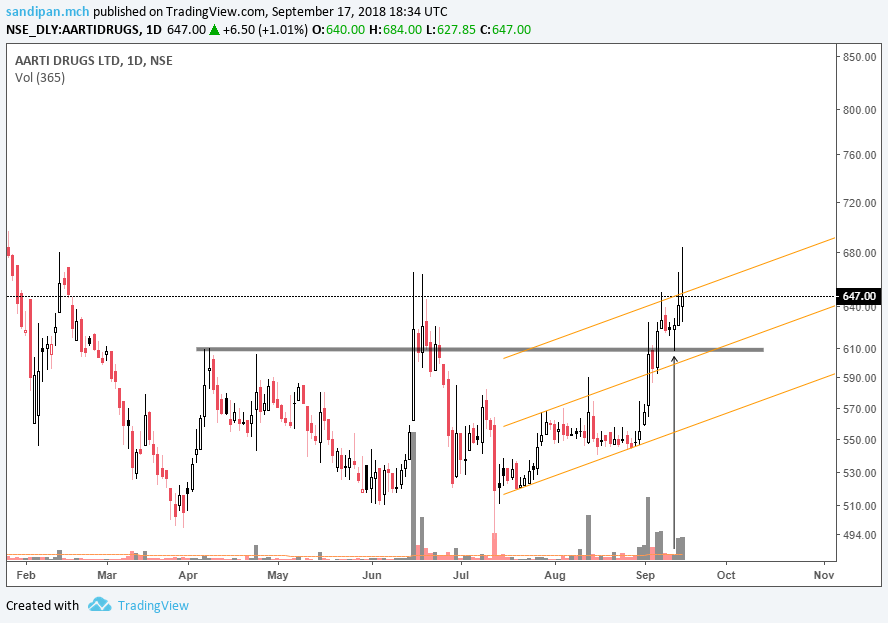
aarti drugs, definitively has a good change of character…
not a buy/sell recommendation, this is not to “mislead” others… pls do your own due-diligence. Take it with truck of salt. I hope, I’ve added enough disclaimer
faceoff with R1 resistance, unlikely to cross it yet, with a volatile market on its back…
demand take over is visible…after Last point of support formation in phase d
breaking of the R1 is likely in this run which is on better volumes that SOS
will have to be cautious at the top of the on coming run , its completing all motive waves of the current cycle, a major correction will be due after this
disclaimer… trade active
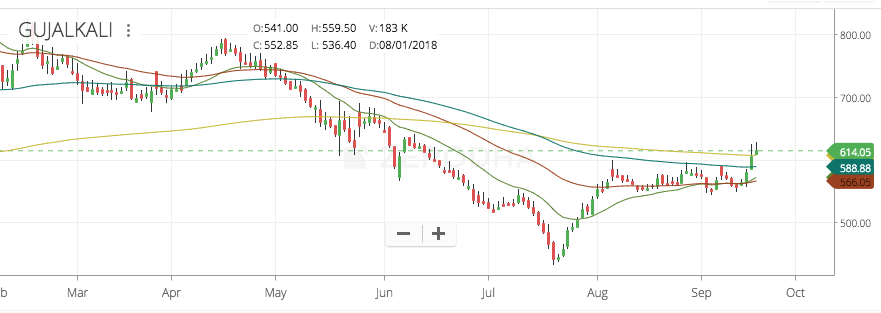
this is another good base formation , yet to show a change of character, but the supply levels are just gone…
might remain volatile for some time more, to test supply levels
the annual report is just bhogus…
not much is available about the company except the product section of the website…
having said that, numbers such a pb , pe ratio are quite attractive, its a microcap…
DCM Shriram update - The buyback rally ended with a nice fillip from positives from caustic soda and then the ethanol price hike and now sugar export subsidy. That’s like a relay-run gold. I think it has run its course now.
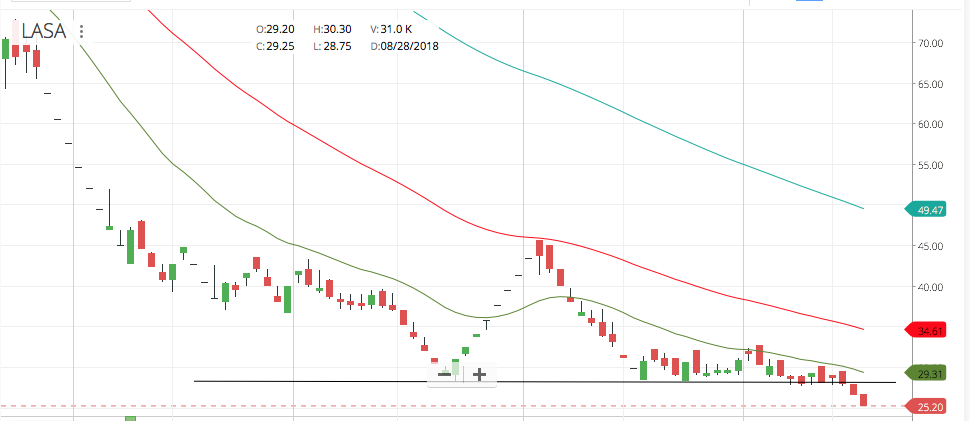
@paresh.sarjani1 - In stocks with questionable quality like Lasa and Aksh (and 8k miles, cerebra and so many others), as long as you don’t buy in the peaks of euphoria of bull market, there are some nice swing trading opportunities (when no one is talking about it), since these are essentially pump and dump stocks with questionable fundamentals. I don’t know if you follow TA but the Lasa double-bottom setup offered a decent risk:reward where the S/L was clear - for eg. I bought at 30, my S/L was 28 and the reward was a pump up to 40 (lower than the earlier pump up to 45 levels) which is a 33% upside and a 7% downside - a favourable risk:reward setup. These work sometimes and the times that it works, more than makes up for the small losses you take when the S/L is hit. As long as you maintain a trading log with statistics and know the limits of your accuracy, do a capital allocation based on kelly’s formula (a rational brain does it without effort) and adhere to S/L strictly, there is nothing strange. Just simple speculation.
disclaimer… no position, tracking, will enter when i feel its ready…
supply levels are gone already…
need some more shakeout and good uninterrupted demand bars, which this chart lacks, till now while coming out of the base…
if there is something interesting in the fundamentals , the market would reflect it somehow, well, may be it dosent do always…
it could be bought way more cheaper than what its selling at right now, i think…
last time, it formed a similar pattern was in may, it ws not a 3 black crow rather a 3 identical crow, both reflect similar market psychology, but was on way lesser volumes than now, making the present one more significant pattern… what followed that 3intendical crow, was not pleasant to watch on a chart
… https://www.tradingview.com/x/lEXZngI4/
the person’s whos stoploss got hit back in may during that pattern formation, is one lucky guy…
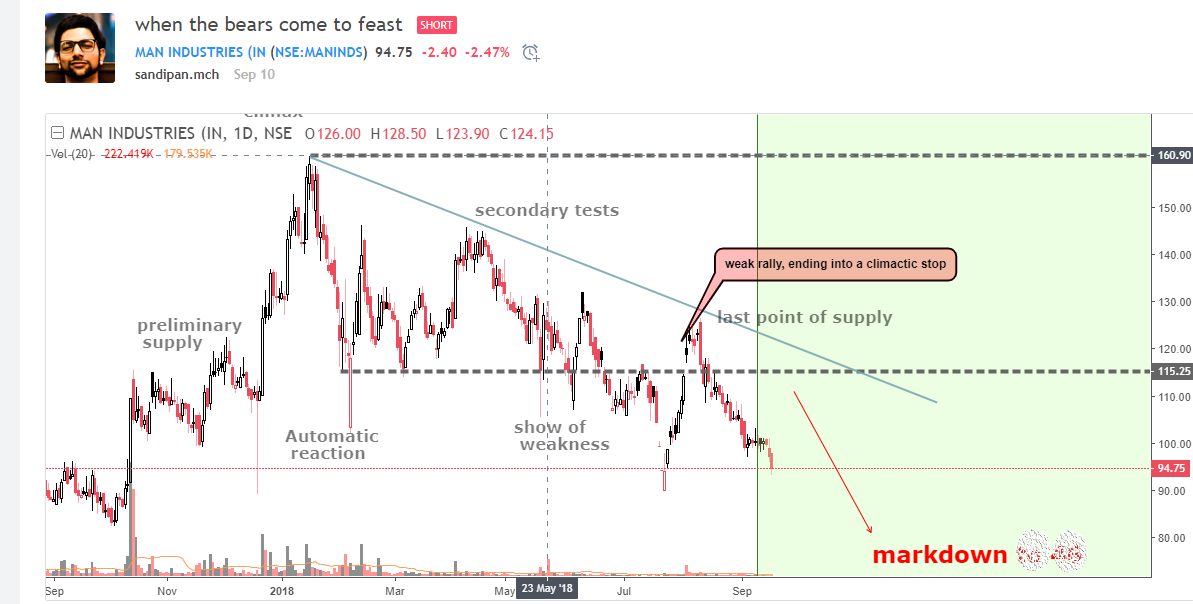
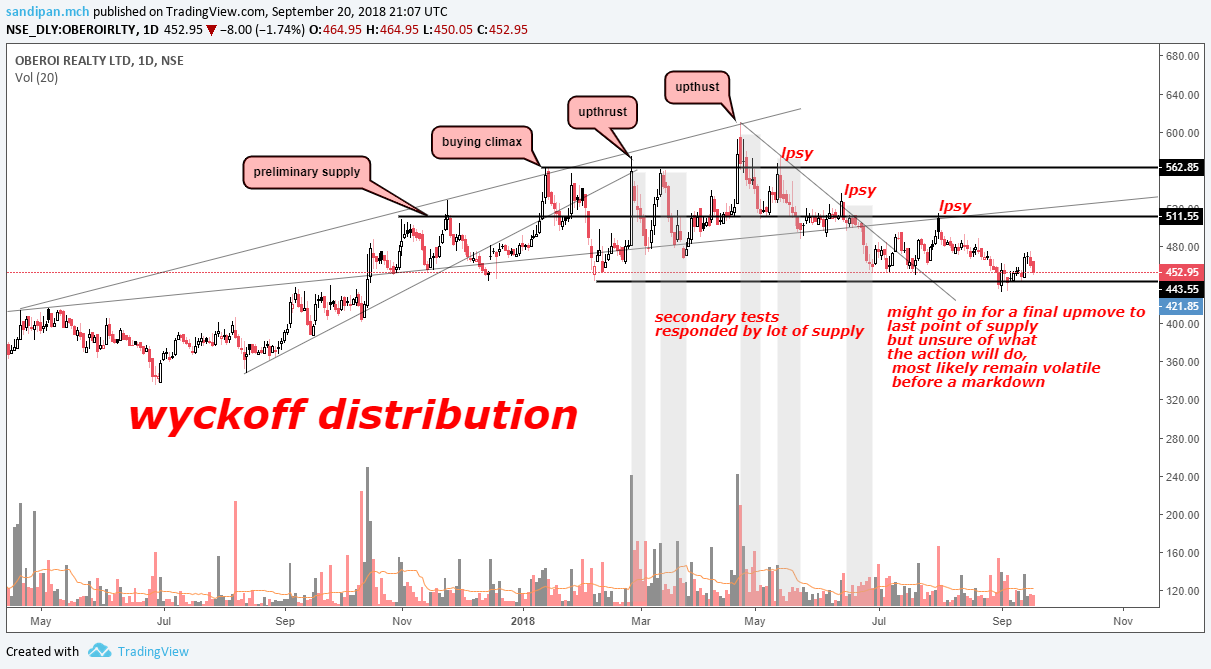
wyckoff distribution has just started , currently in phase b and the was immediate show of weakness, indicating, the smart money has started mobilizing the funds out…
interestingly in the very short term, there has been supply shortage, and another weaker rally is expected…
the scrip fell out of all the 2017 support/demand trendlines…
a potential bearish change of character…
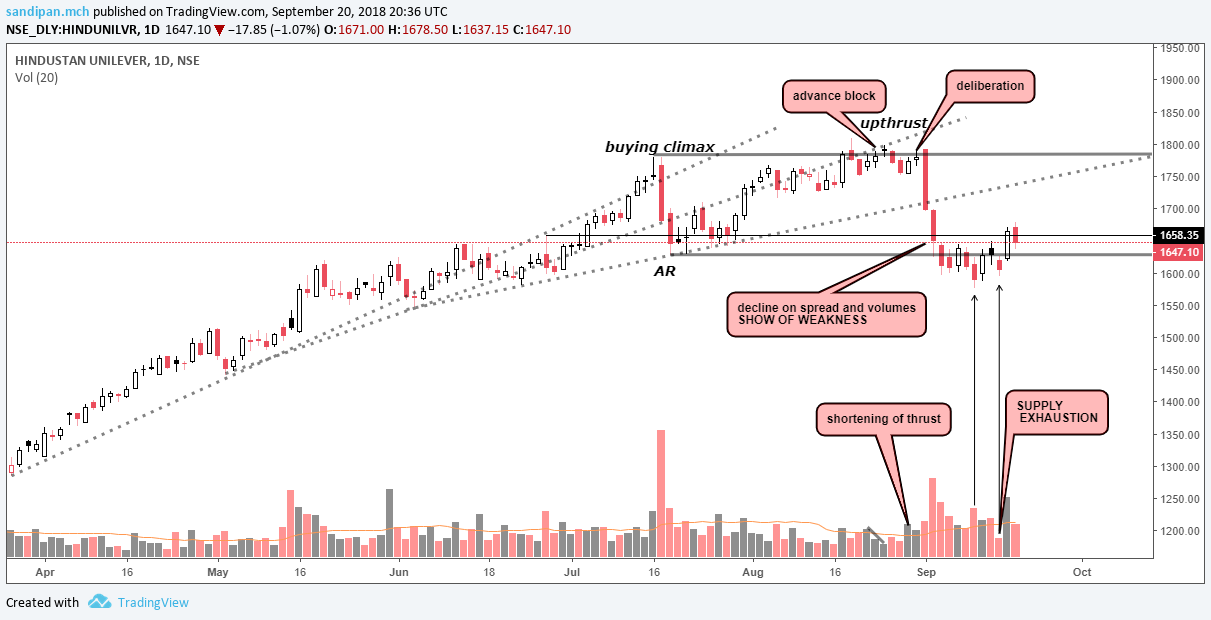
quite unnerving to see HDFC group and HUL getting distributed…
kalyani steel was on wyckoff distribution with deteriorating business environment in the sense that of inflating raw material pricing environment and lukewarm demand offtake of carbon alloy steel …
currently it has fulfilled the markdown rotation point perfectly as indicated by point and figure chart and in the daily time frame, forming a base which in the weekly looking like phase a of something restarting… a selling climax,followed by automatic reaction is what is visible now in the weekly chart…
a good stock to track in the watchlist now…
disclaimer… initiated position at selling climax to track