piramal flies out of the Last point of support
cont post…

Bajaj corp going totally crazy today with massive exchange of hands!
Excited with whats incoming…
Disclaimer… Positions in long, in both
piramal flies out of the Last point of support
cont post…
Bajaj corp going totally crazy today with massive exchange of hands!
Excited with whats incoming…
Disclaimer… Positions in long, in both
when you say position in long is it in cash or FNO ?
Just saw, that was crazy !! and seems like the Pirmal accumulation call was quite good.
Disc: Holding PEL for a quite long time. No transactions this year.
check the intraday chart of bcorp !
wow, congrats on the good money in piramal, i am a recent entrant here…
Seems to be a bulk deal ? a sell off of an existing big shot (or just changing hands) ? If not, this seems to be interesting.
Crazy spurt in volume though.
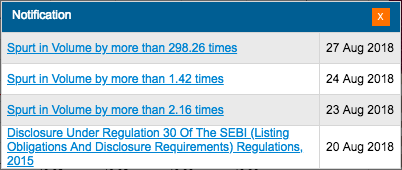
no notification on the exchange
a couple of days back there was another exchange of hand… yiah, thats causing the vol spurts…
i do not know the significance of this in the last point of support in my accumualtion schematics yet…
would be interesting
@manivannan.g my custom indicator is screaming buy in persistent 1hr chart… lol
the red histo popping up is the signal with the oscillators in the over sold zone[not yet quite there though]. it worked well in the last time
cash , dont trade in fno yet…
crompton greaves might drive for lps for another entry …
continuation post…
PBC hit the LPS gonna consolidate a bit more
relaxo has been a textbook reaccumulation…
lot of fuel remains in the price action…
cont post…
the point and figure chart directs to a obnoxious rotation point, and is a best case scenario…
not a conservative estimate at all…
and this would mark the end of wave 5 , followed by a massive correction
trading positions in the long
sanghvi movers
a classic and most dangerous case of wyckoff redistribtuion
[we had a good discussion in this thread by one of the member of whom i am a follower, if the charts can make an illusion for her, then so for most]
a classic case study of a very tricky redistribution… should be studied very well across all time frames …[will try to make a detailed post later on when i have time]
i have got an interesting case to make here…
this is regarding bajaj corp…
for the past 2 months, i have felt the stock price was highly being manipulated
hence the looking inside all these details which i avoid doing generally…
as a basic concept…
when the smart money buys a stock, they do not drop lumpsome buy orders at a specific price[thats what bulk/block deals are for for a cleaner transaction, in case of bajaj corp there was none in the analysed time period]…
mostly trading bots are set with specific algos which keep repeating small unit orders [trades] in a specific price range and manipulate both the bid and ask side of the order book…
this is done so as to hide their activity during the trading hours[a reason for not announcing the deals to the exchanges before hand]
a specific ratio can be used from the exchange data…
total turnover[in rs] / total no of trades executed
this ratio essentially quantifies the quantum of the transaction made per trade, when i am looking for operator activity i will be looking for lower ratio number rather than a higher one in an ideal case[which is the most frequent appearing scene in most of the stocks in most times]
along side i am taking the % delivery…
during silent exchange of hands between a group of operators…
in any given day the delivered % should be high and the the above ratio to be on the lower side
this is exactly the case with bajaj corp…
now taking the above mentioned ratio in the chart[sorry for not labeling the data points]
to note…
1.the TF between 8th and 18th august showed a drown below the % delivery trend line and the ratio went above the toptrendline
2. focusing on the most recent TF… post 18th august…
the delivery % rose drastically above the base line… the traded value per trade/order fell during the same time period below both the topline and the base line
during this period the volume increased over 300 times the 200day moving average
by the technical today was a doji with buyers and sellers producing their respective wicks implying market was in a locked state…
conclusion…
2 months of exchange of hands between operators have been concluded…
the stock should begin a new trend…
disclaimer… invested
i dont not want the price to be compared with this case, as it will confound the thinking and the resultant sideway action is practically directionless
criticism requested
Vijaya Bank (Follow up)
After a good breakout, there is consolidation and volatility compression. Vijaya Bank seems ready for a range breakout (either side, though at this point upside breakout seems more probable).
Views welcome.
Discl. Long position of after Q1 result.
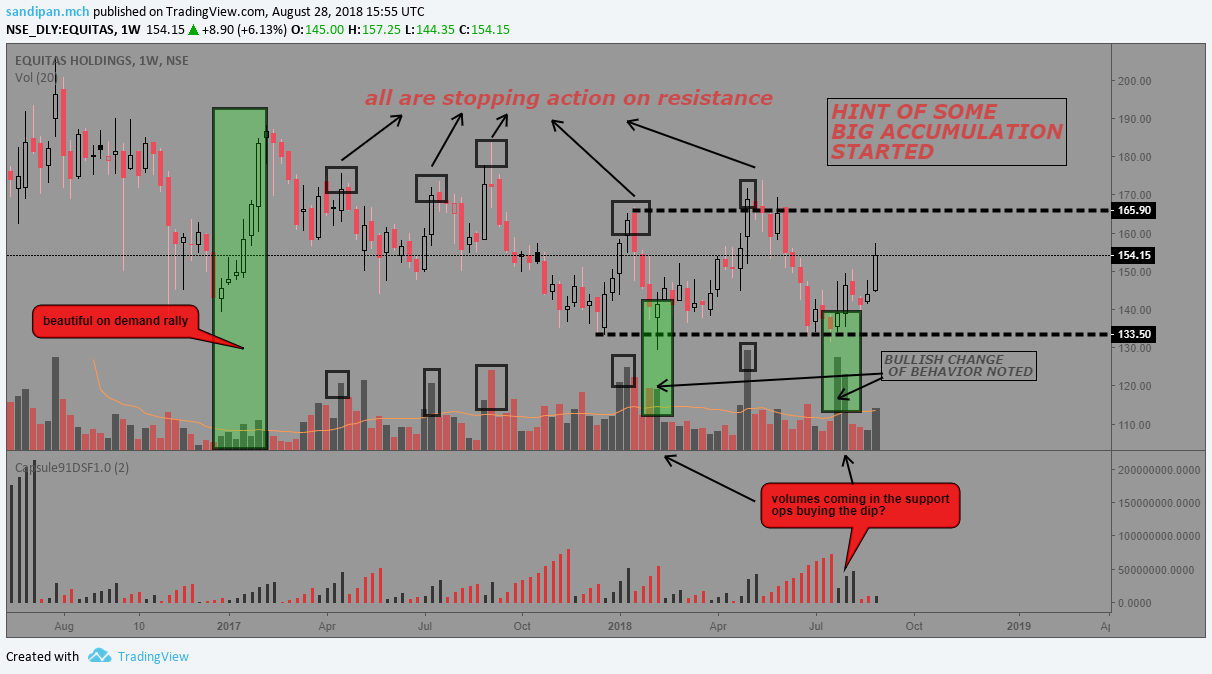
the fundamentals in equitas holding needs a good look…!
interesting chart formation
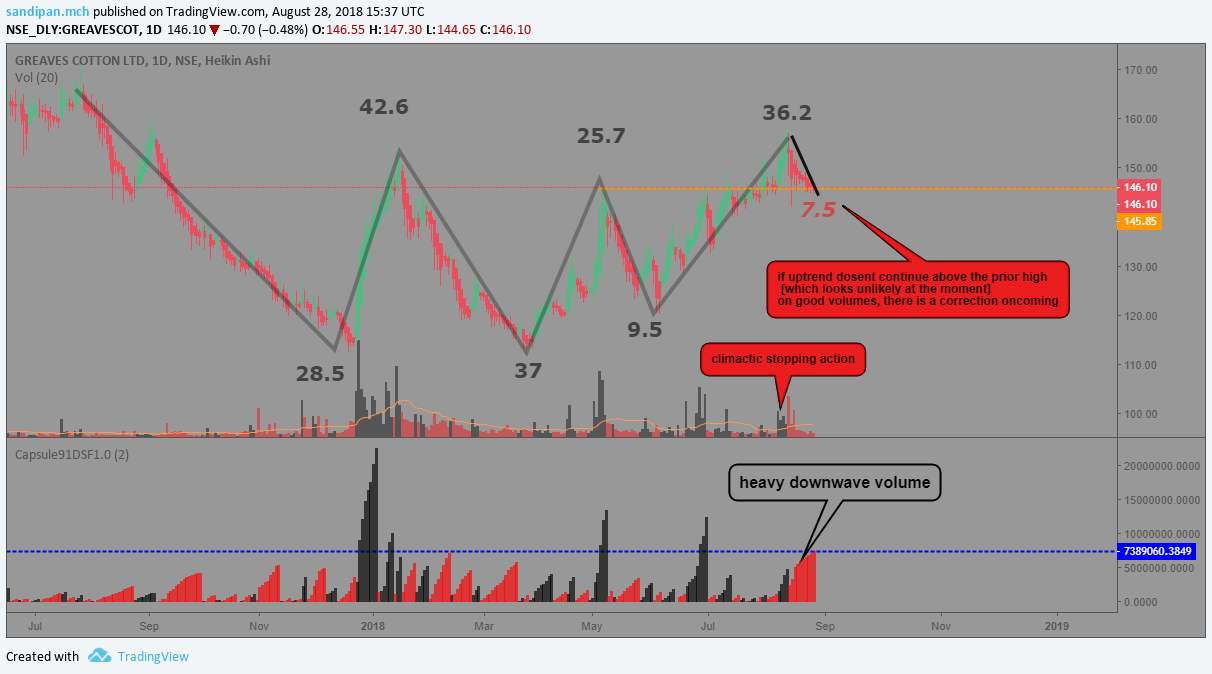
greaves cotton encountered heavy volumes, might correct…
but i am vigilant of this correction, as some kind of support formation might occur and mark the point that the operators are not supplying the float, rather doing some kind of shakeout…[hesitating to call it a last point of support formation yet]
disclaimer… not invested
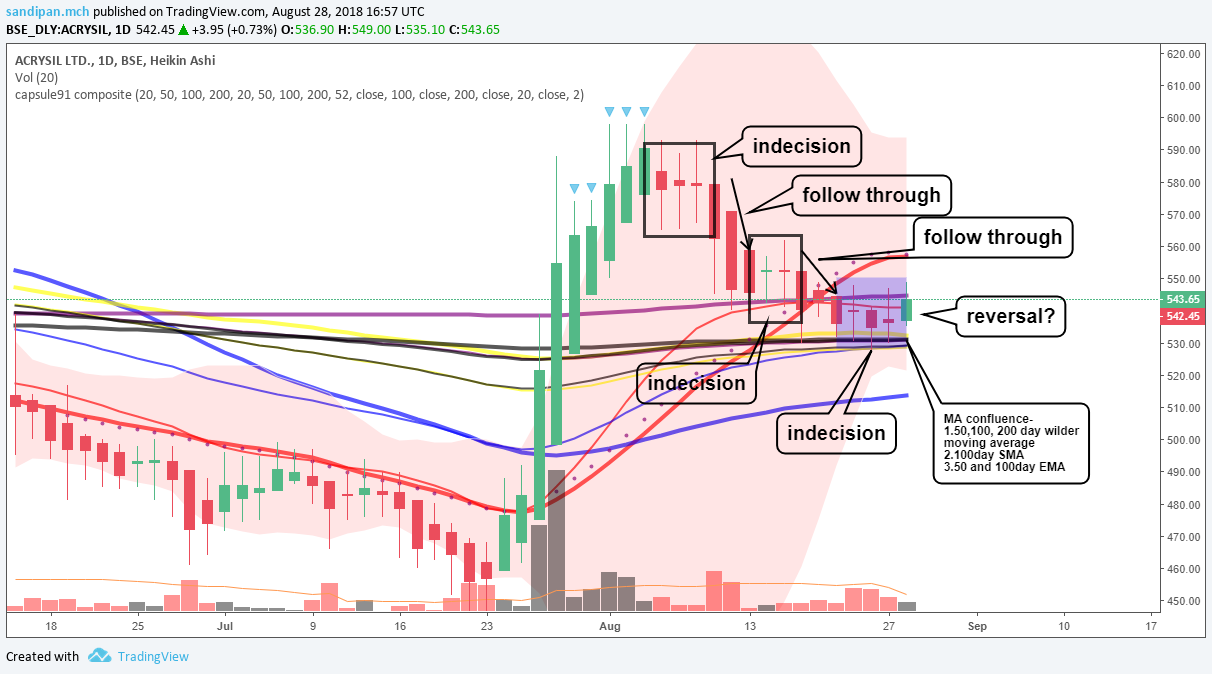
acrysil…
a possibility of support formation, and if this is the support that has been formed and tested, this can lead to a significant on demand rally…
have mentioned in details about the company in the respective thread…
disclaimer… invested, increased positions today
IMHO, the daily charts looks bearish. Seeing more hanging man, if we had hammer instead of hanging man, the trend reversal might become true:
agreed…
more so, because there is an unfilled gap down below and nifty 50 looks topping out
lets see…
[ps… hanging man candles generally have a downwick 2x the body size , the first one is a hanging man, are u sure today’s candle is one?]
quite interestingly, u see, the 25th july candle before the breakout gap, was a proper hanging man too… 
Quite not sure, might be bearish hammer ?! Will wait for 1-2 session.
If I’m not wrong, that breakout might’ve caused by the result. The special news/days will change the entire trend itself. So people were cautious about the result and hanging man formed, if the result was negative, stock would’ve been hammered.
ohh yiah! u are right, that was the result day… 25th july
and yes, taking a position here is tricky, i added today, coz,this stock is so damn illequid, that once it starts running wont be able to get it, happened to me post result day, none of the orders got filled, and the next day was , well, nothing to say…
btw, take a look at the renkos…
weekly double bottom and what seems like , the daily brick has the highest volume of the recent trend… might be some buying the dip stuff happening too
Came across this DJIA Elliott Chart from one of the blog. This is matching with the forecast of Nifty hitting the wave 5 top in Jan-Feb 2019. Always the January month sends jitters around investors, this time no difference.
This excerpt was from Feb-2018:
To sum things up, it seems to be too early to panic. The recent price drop, although a sharp one, appears to be nothing more than another dip within the larger bull market. The DJIA might even revisit 23 000, but targets near 27 000 remain plausible. It is around 27k where we should get really worried though, because the entire impulse since the bottom in 2009 would be complete and the theory states that a three-wave correction of the same degree should follow.
Read more at: https://ewminteractive.com/djia-worst-day-elliott-wave-context
this gann chart marks the end of april to be the end of the bull run before the mayhem starts
s far, the time lines are pretty spot on on both the corrective waves…
jan is the time when the price hits the arcs…
should be very volatile that time
titan started the downtrend since notified on this thread…
note the formation of a bearish weekly heinkenashi after a indecision candle last week
in the daily, the downtrend has set in marked by repeated black candles, with no upwicks , only downwicks, indicating the supply has taken over the control of the trend from the demand
so far 12.6 million shares have been transacted on this correction , the highest on this uptrend
an estimated correction of 20% from cmp is evident from the point and figure chart…
disclaimer… not invested, not interested
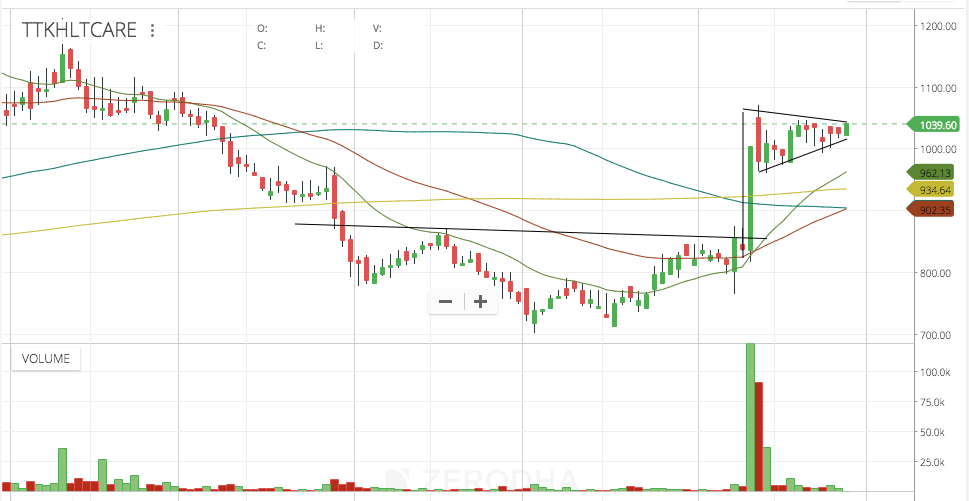
TTK Healthcare update from the initial channel breakout and inverted H&S posts. Now a flag is forming on the hourly
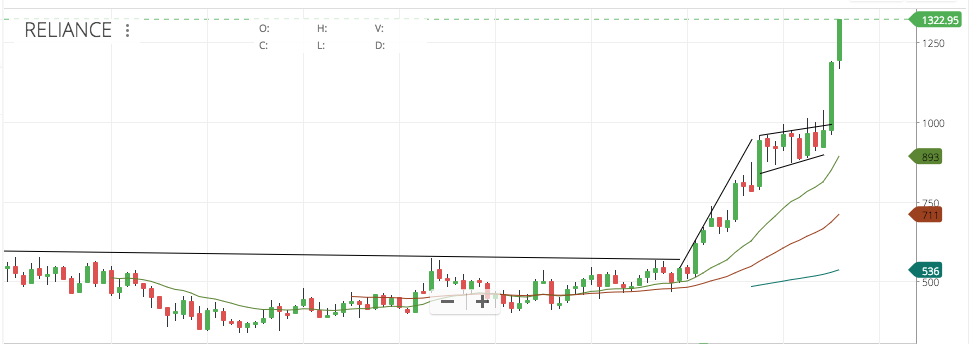
Reliance update from this post which also had a flag on the monthly.
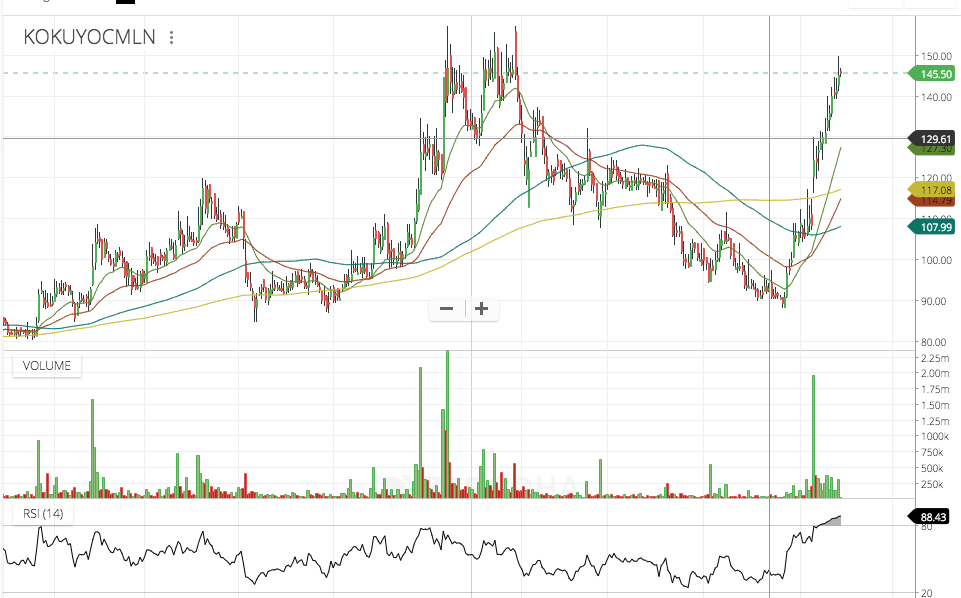
Kokuyo Camlin update from this post
Looks to be overbought and heading into resistance.
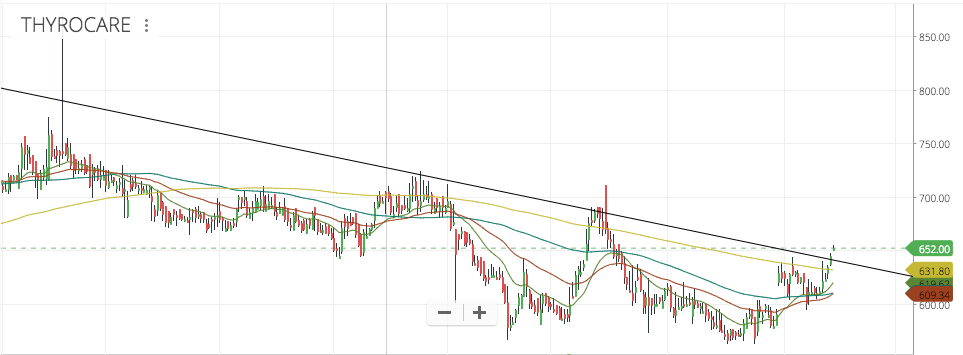
Thyrocare - Closed above 200 DMA after a long time and seems to be showing strength. I presume that the buyback is underway now giving support to the prices. This played out in similar fashion in DCM Shriram from 250 levels.
Disc: Invested in all.