since u are focusing on the south scene, demand pick up is visible in all the player’s capacity utilization and volume sold in q4 and q1…
which is definitely, the first sign of bottoming out of the cycle…
now by the time the margins starts improving the rally should have started in these stocks…
with shift to coal from petcoke, softening of logistic inflation along with crude, and demand exceeding the current capacity, should be the next level of notch up in the cycle, when the margins should start flattening up atleast…
technically, the 3 scrips u mentioned, its too early to commit if this is a true base formation… but given the fundamentals shape, i would believe so…
i would update the thread when there would be convincing evidences about the cement sector…
would tag u then…
for now, sagar cement, seems to be relatively strong compared to other 2 technically, and also by the fundamentals, already shift to coal as input, further reduction in lead distance, and commissioning of the new captive pp should aid the margin improvements faster and will be factored in soon enough…
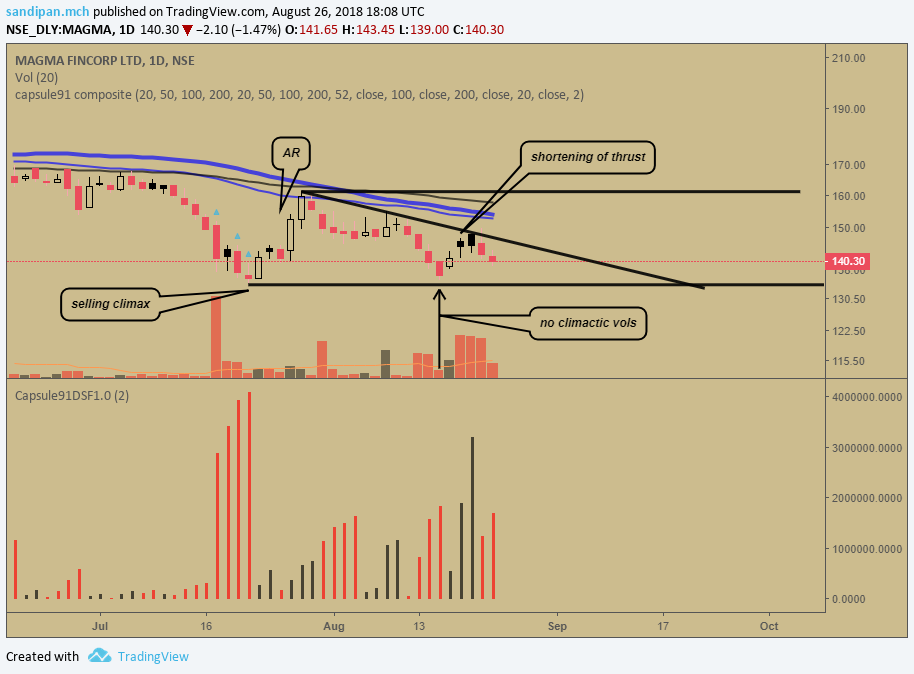
an article from 21st aug, margins are going to see pressure as the lag to see the crude really hurting such a company is finally over… although, the q2 is supposed to be good in vol and value terms, and the demand tragectory form the target market-rural india , is ontrack of revival and finally sense of acquisition with total cost of acquisition arounf 700-800cr, with 1to 1 cash debt ratio of funding…
i guess this is what change of character looks like lol…
disclaimer… no positions in either of the stocks
ps… exited page industry today… a difficult decision when everything is so euphoric about the scrip… taken on technical ground, fundamentals very much on track
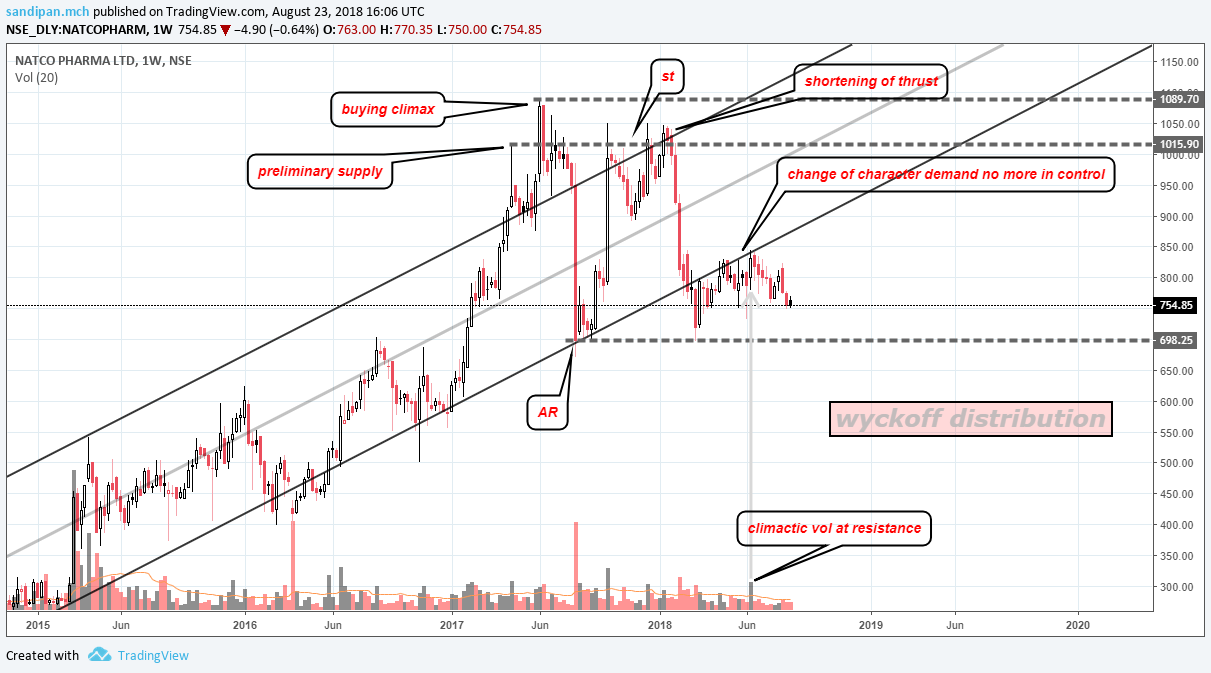
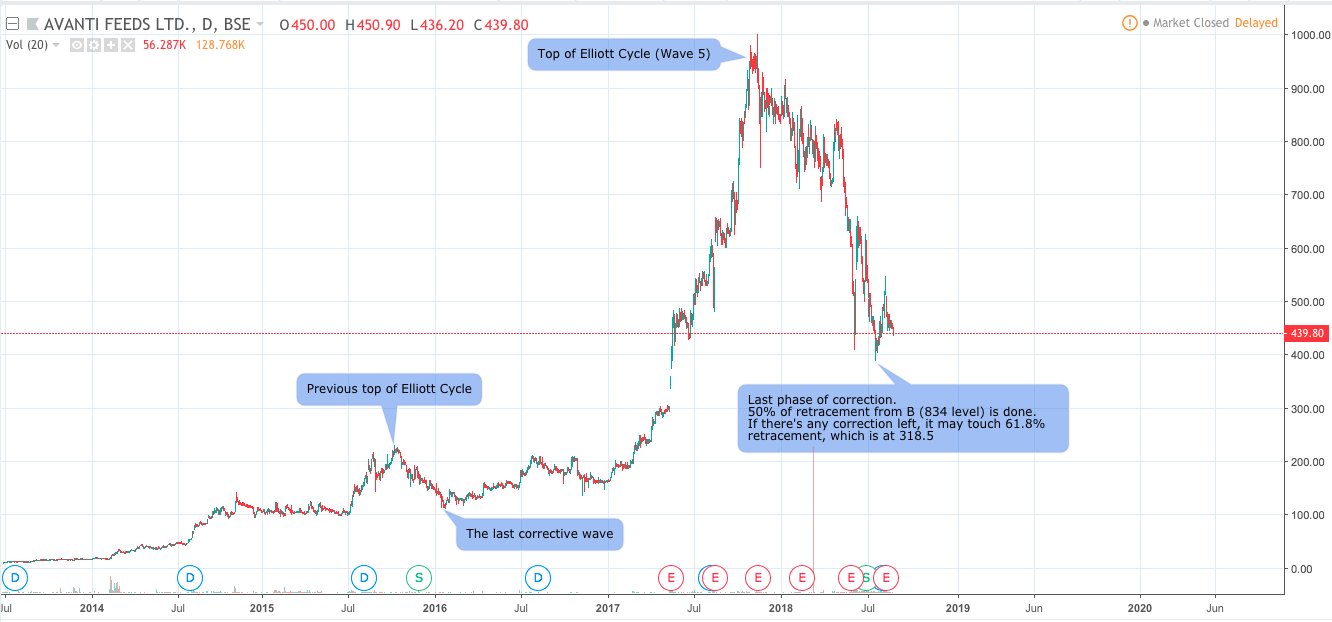
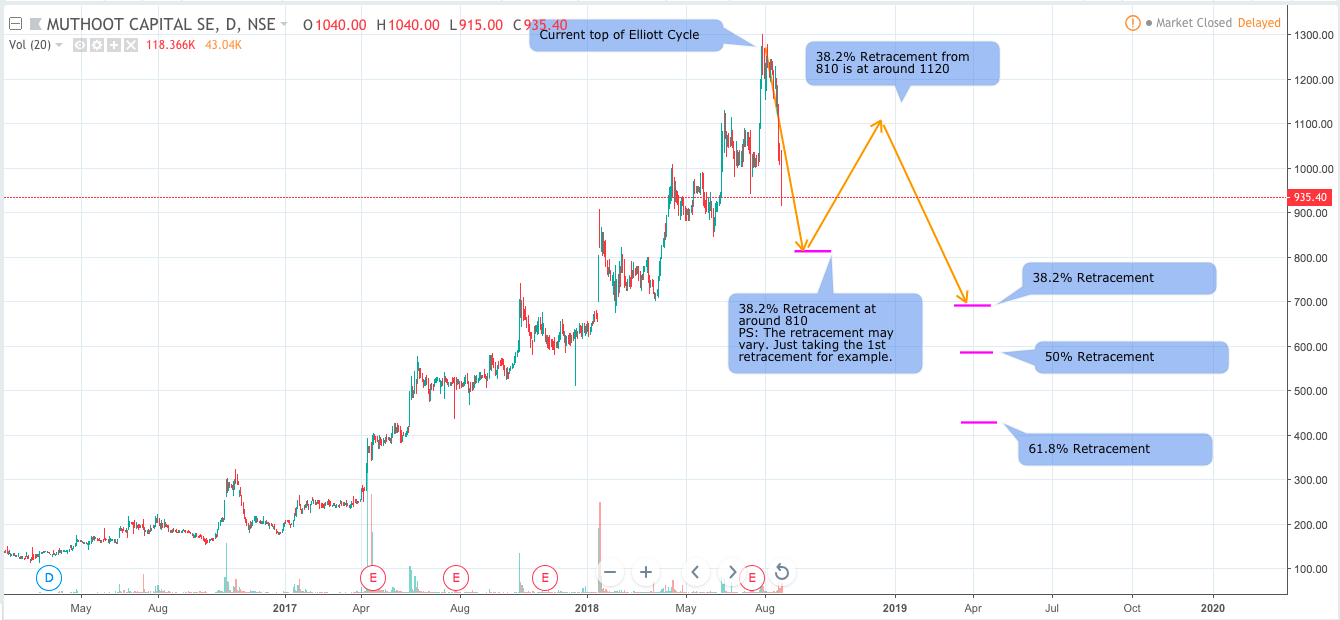
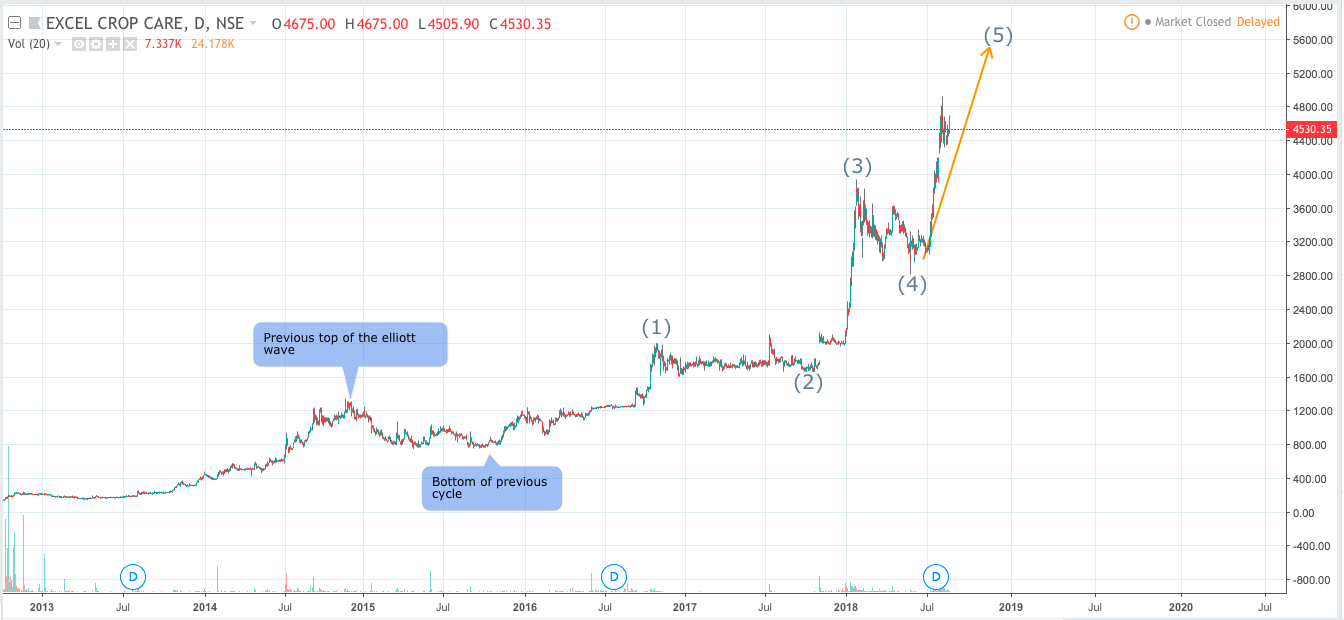
IMHO, All three charts very identical, the previous top, followed by correction and then the rally. Also If you note, Avanti has corrected due to headwinds, so does Muthoot (kerala floods). During last impulsive wave of elliott cycle, after every fib retracement one has to be very careful, even a small hiccup will cause the correction.
I welcome other boarders opinion, also let me know If I had got the count wrong.
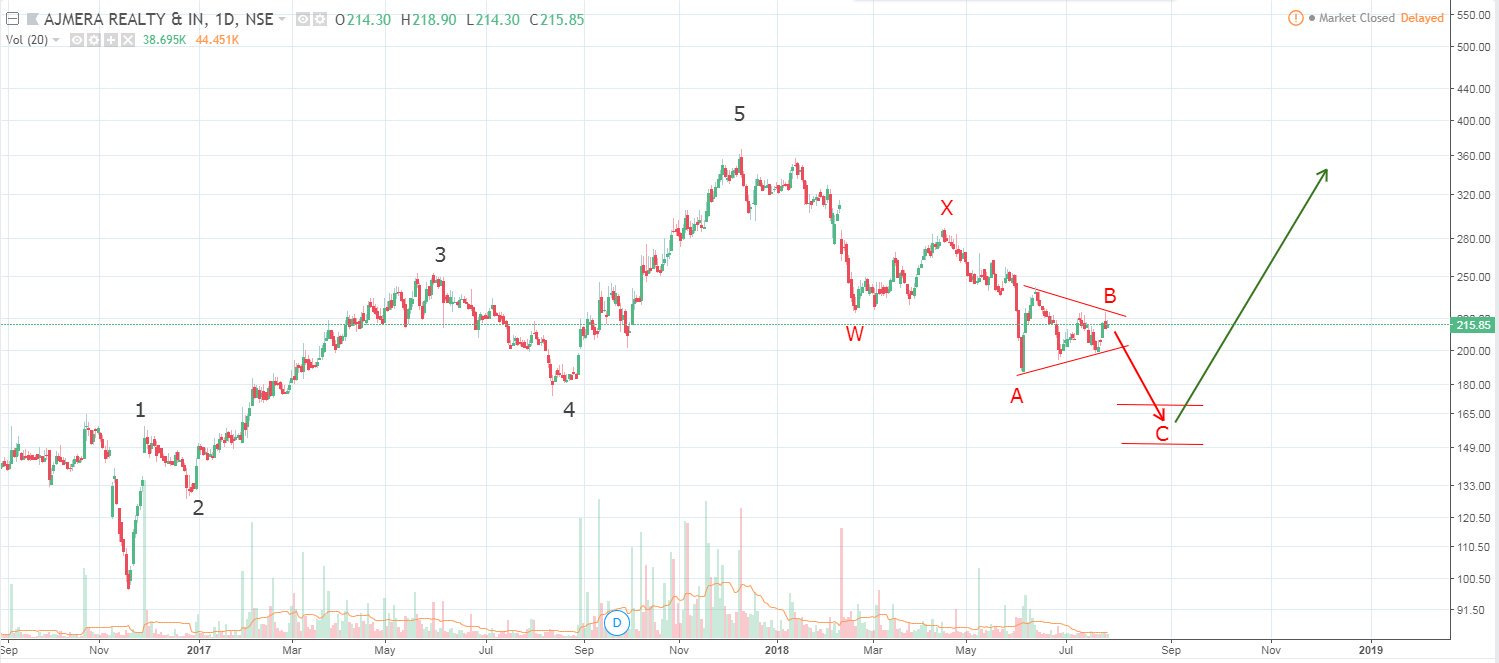
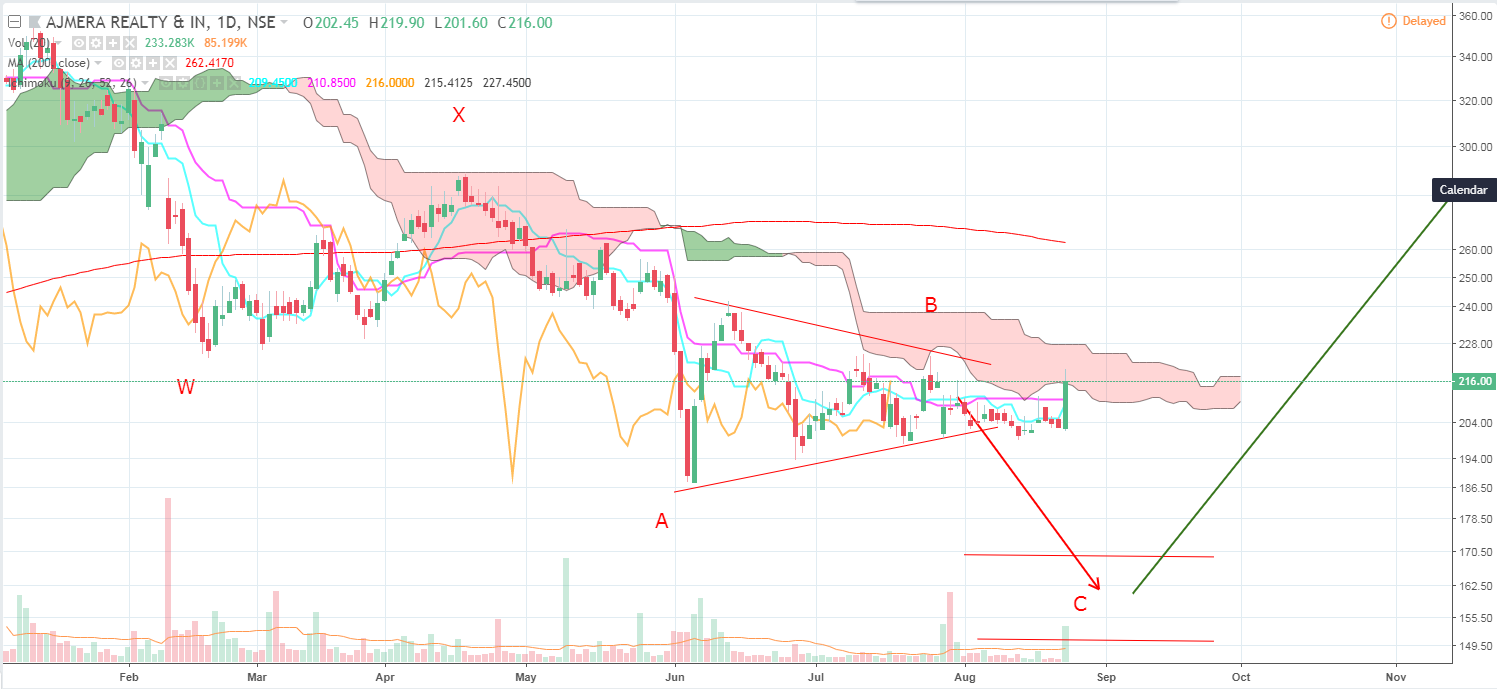
Ajmera Realty - Was clearly forming WXY waves and a symmetric triangle in subwave B of wave Y. Was expecting it to break down to 170 to complete wave Y and then go up again. But it’s given a break out today. Could be a fake breakout. But if it’s real, it should cross at least 230. If it does, then the target for the symetric triangle breakout should be 260/270.
@PE_Ratio requesting your kind review on this. Should i consider the current impulsive wave as (3) ? or should i count as (1). Bit confusing since the wave (1) in the picture was not that convincing.
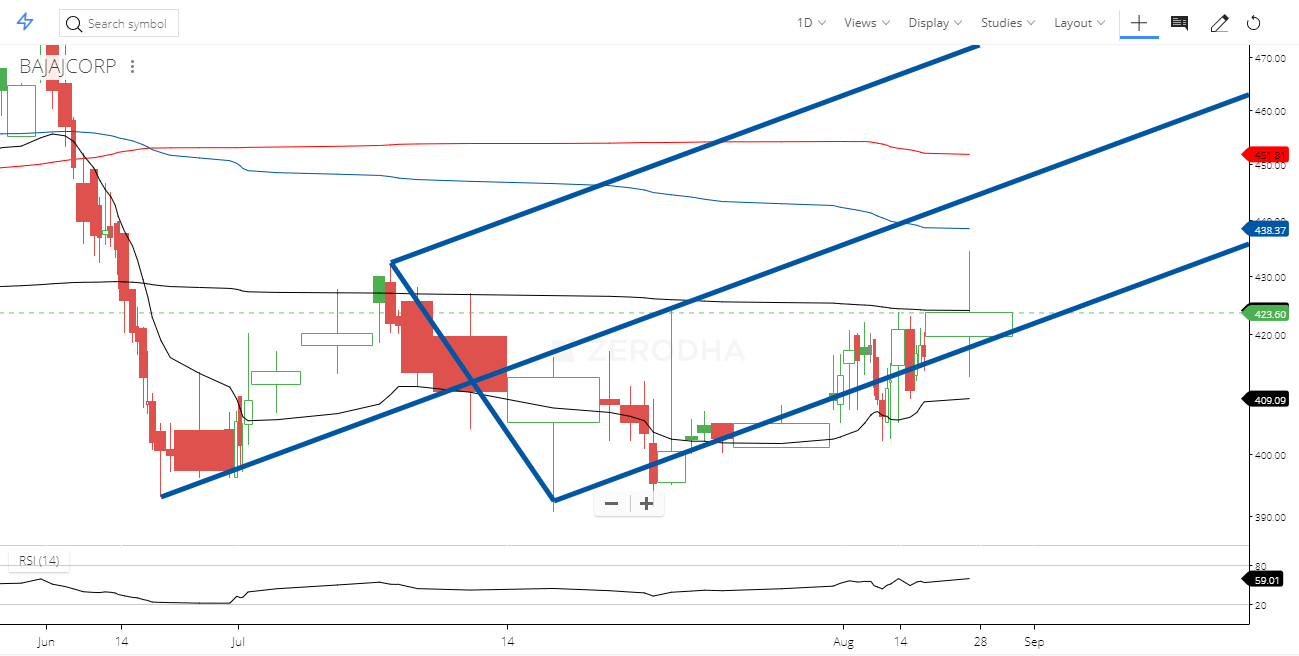
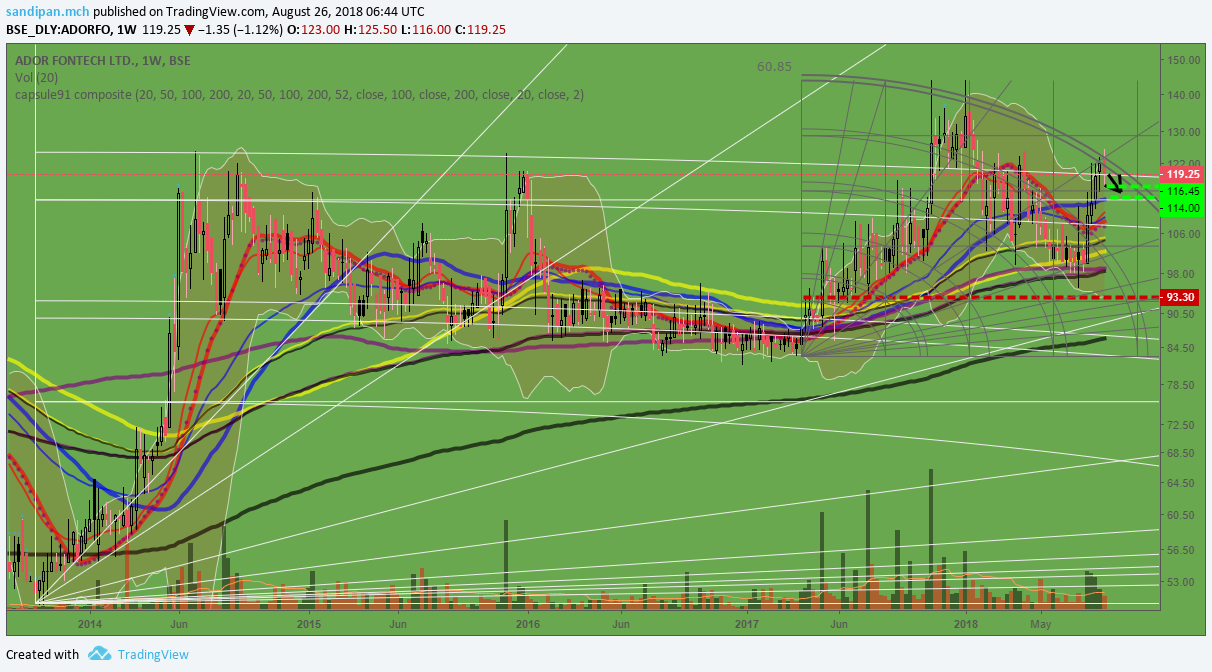
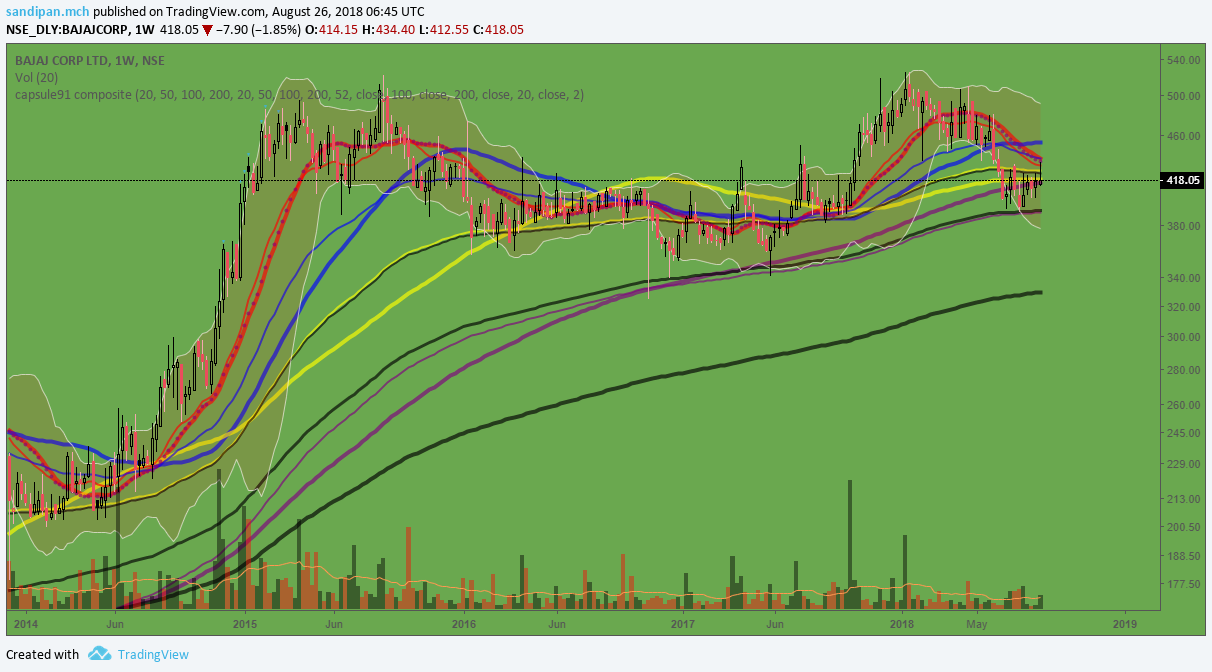
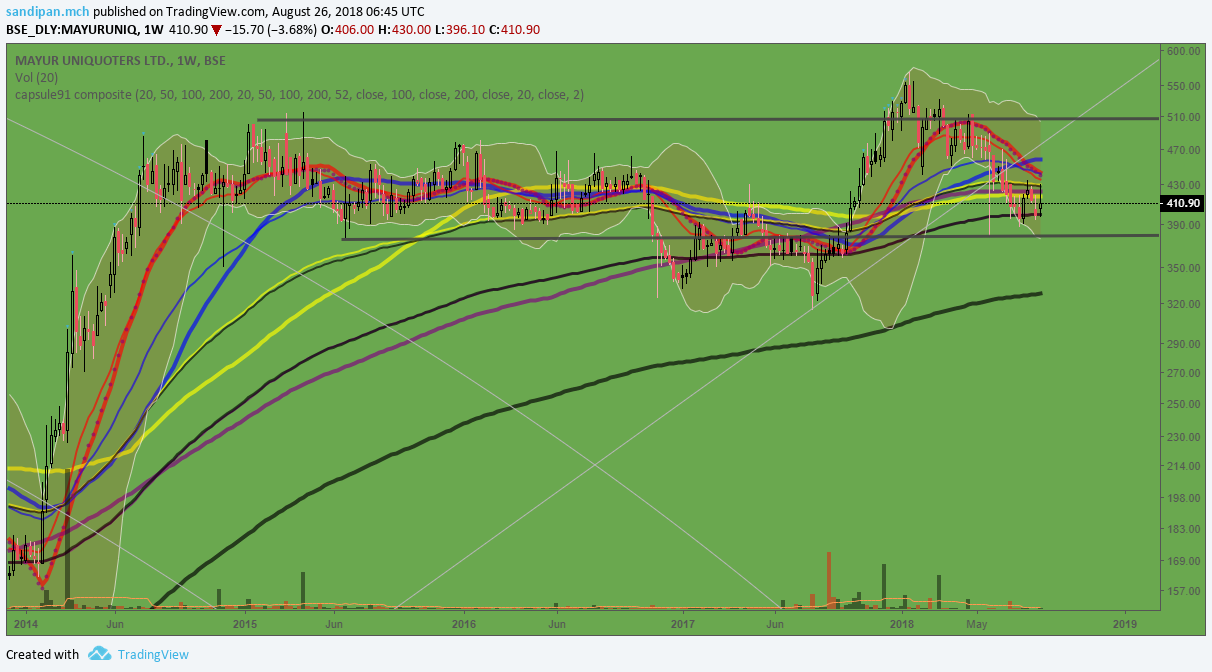
3 similar accumulation charts, which i already discussed, in this thread…
mayur, ador, bajaj corp…
of them, ador has started moving mayur and bajaj is still forming the last point of support in phase c…
looking at the relative strength of the chart…
bajaj corp clearly stands out, not only did it not go below the 200 week moving average[simple and exponential ], there was practically no shakeouts done in this schematics… the little thats was attempted, in 2017, was responded by immediate loss of sellers , and rampant buying began…
ador fontech , also had no proper shakeouts per say, but there was a bull trap, in the form on an upthrust in early 2016 , and the chart is moving faster than other two…
mayur is the dud amongst the 3 ,not only the action is the most volatile throughout the 3-3.5 year accumulation, but it went the lowest below the moving averages…
interestingly all 3 are kind of revival stories…
ador is related closely to the steel and the cement industry cycle, which are showing signs of revival… rural traction comeback has been seen in the bajaj corp numbers, relaunch of previous brands and new acquisition… and mayur, is due the next leg of growth from the new businesses they are foraying into, plus the potential of entering into the europian market place starting with mercedes…
disclaimer, invested in all 3… increasing ador holding until its in the trading range
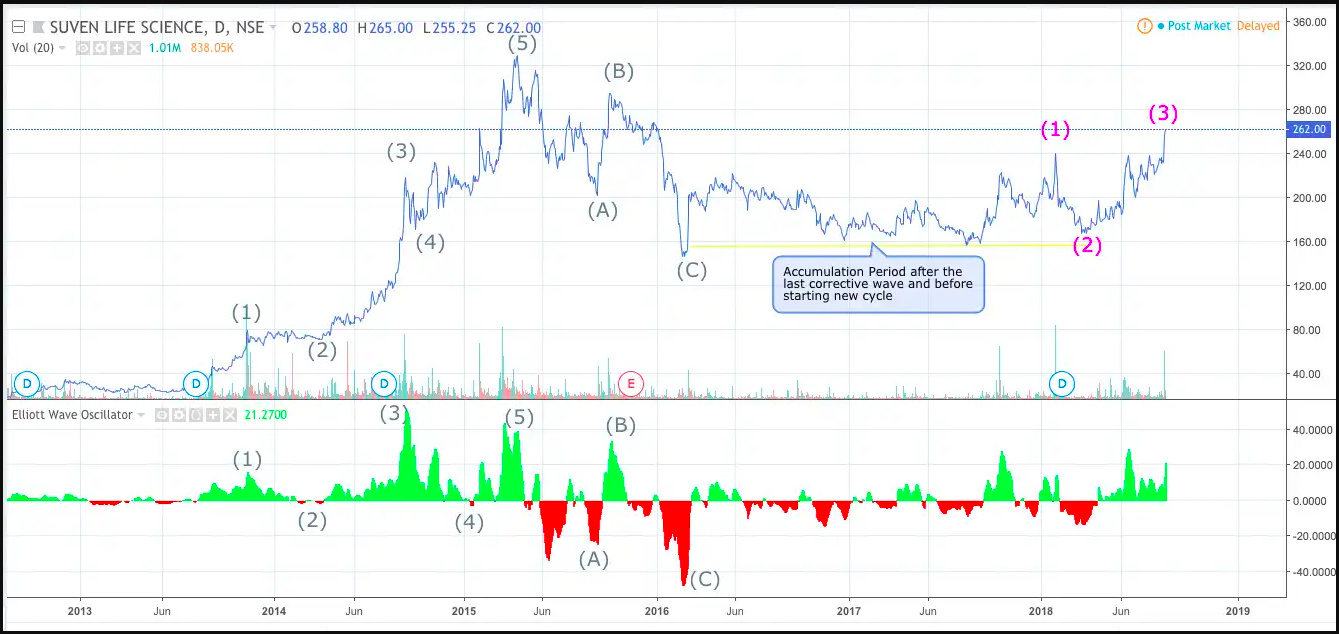
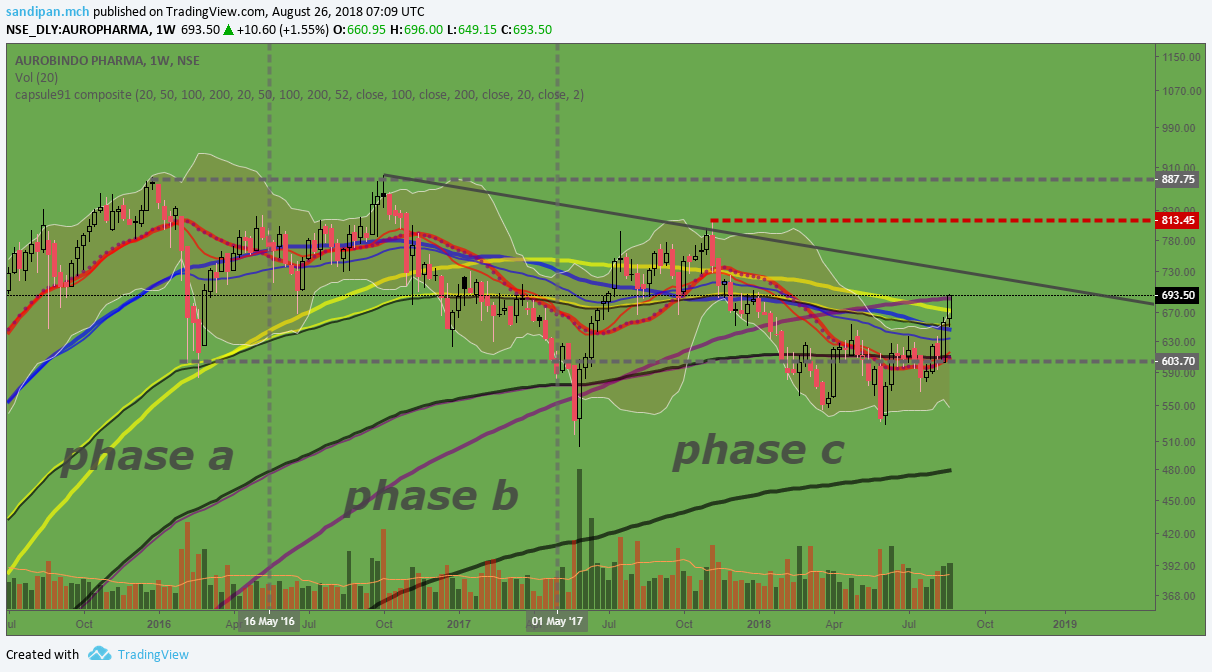
this story seems to be exciting and at good valuations…
i am particularly interested in the the ARV business which is yet to pick up pace, but i think it should come up into the numbers soon[laurus labs in another scrip i am tracking in this play],
the apcotex acquisition adding almost a extra quarter of topline, the process to be completed by the end of this fy, some of the big market andas like colesevelam , lansoprazole, ertapenem , metoprolol to be launched this ear, plus management focus in over the counter drug segment, which being a sustained topline game is anyones guess…the M&A activities are almost complete and would be so by this fiscal, and there is outlook of focusing on higher margin natrol products…
definitely a case where the composite group would have no problems launching the bull market campaign int he phase e of accumulation…
disclaimer… no positions as yet, would like to see the price action fly up breaking the downtrendline and then take support , exposing the change of character…
Interesting observation, could you please provide some more info on what all things to look at for confirming this sort of play in any scrip ? Is it just a consistent resistance line ?
there are several variations in the way the algos are set…
this is one of a kind example…
typically the price loses the fibonacci ratios and wave movements which are the features when proper herd participation is there…
this is one live example… https://www.youtube.com/watch?v=a-9A0ar70pI
in this case, the bots were just turned off at the end and whats actually was happening comes to bare… a massive crash
If these bots are capable of modifying usual structure of uptrend or downtrend… Can they distort usual signals we get from Tech Analysis ? Or eventually the herd behavior wins over these bots ?
Past my past 8 months of analysing the bitcoin market and related cryptocurrencies, where a substancial portion of retail money also uses bots besides the exchanges and the smart money…
These bots are perfectly capable of confounding the results of analysis of a daily chart or lower time frames, but the weekly charts dilute these activities well enough , to have negligible effect…
In markets like india, as of now, there are no signiticant effect…
But the scene is changing, brokers like zerodha, are offering paid services where one can use algos…
We might be heading onto some interesting times, of more manipulation…
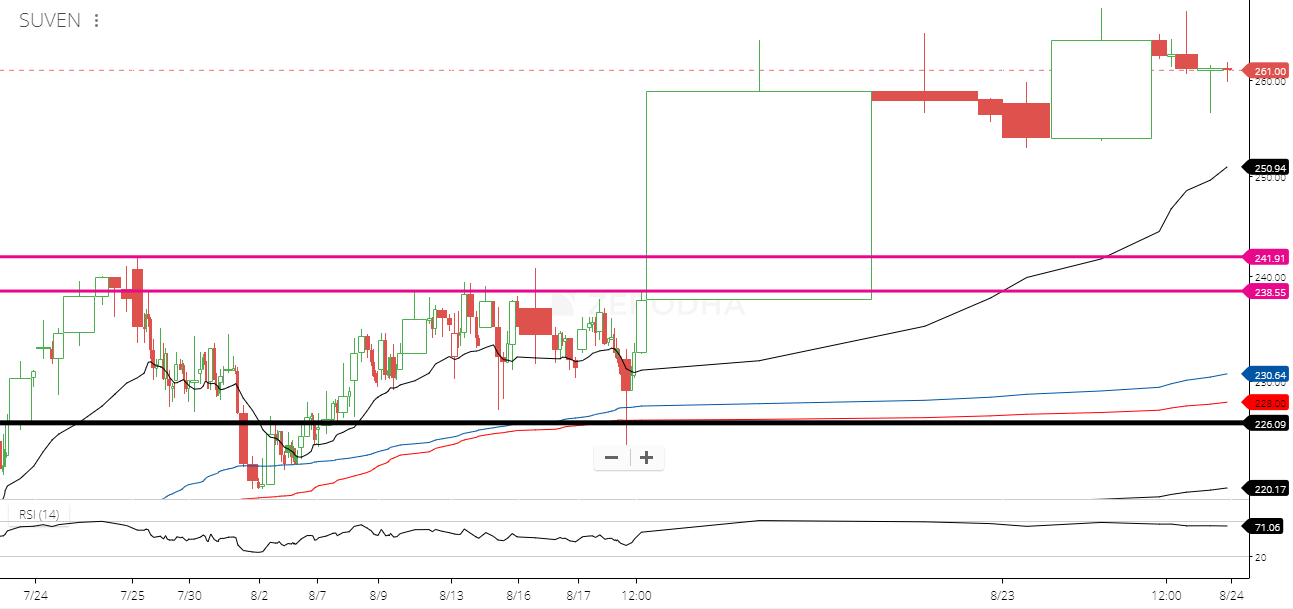
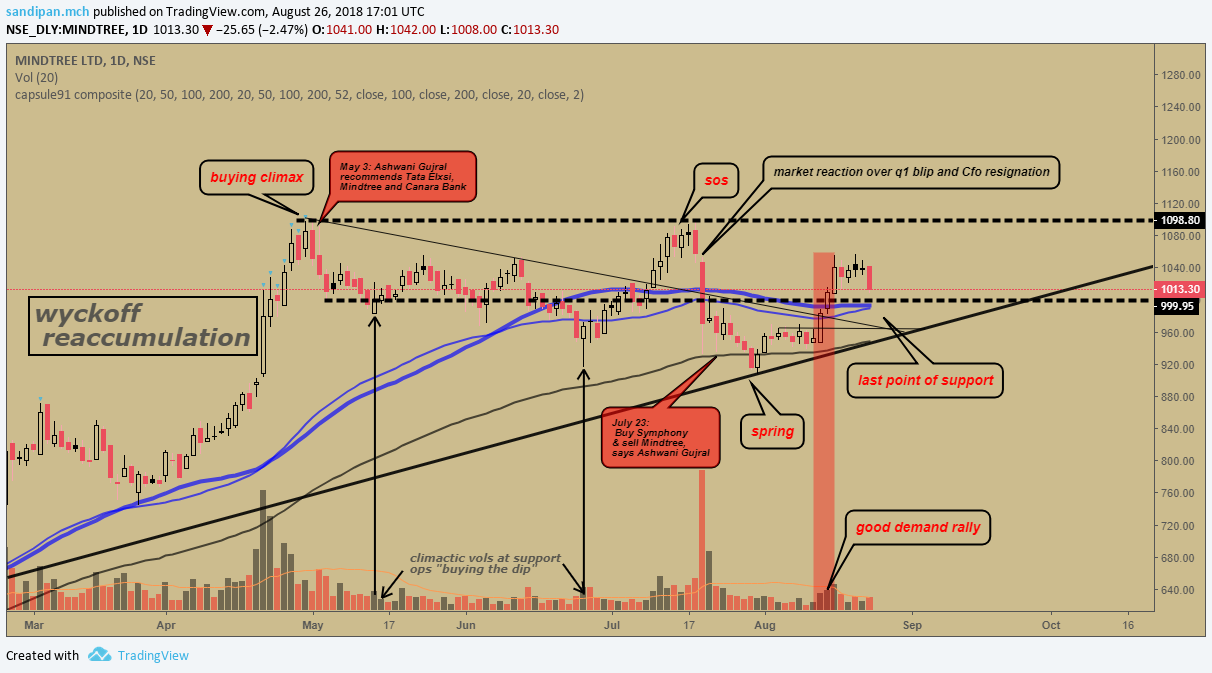
i think this is reaccumulation going on, despite the huge volatility recently in the price action, and the volatility is going to ease off soon, as what i think this might be a last point of support being formed…
i am an avid follower of certain technical analysts who appear on tv , helps me spot the buying and selling climaxes with good precision as these are the rookies in the wyckoff chess board … as we can see here in the chart
the fact is interesting, the buy reco came when the action was in the grossly overbought zone, and the sell reco at the 50day wilder moving average…
this is what wyckoff methods are all about…
a excerpt from the wyckoff tape reading course of 1920, where he asks his followers to consider the market being manipulated by one man’s game…[the entire operator group is considered as a single unit- the composite operator/group/man , consisting of all the large interests taken together the hedge funds, the insurance companies, the pension funds , the shady money cartels , banks , pms, nbfc etc etc , all taken together]
”…all the fluctuations in the market and in all the various stocks should be studied as if they were the result of one man’s operations. Let us call him the Composite Man, who, in theory, sits behind the scenes and manipulates the stocks to your disadvantage if you do not understand the game as he plays it; and to your great profit if you do understand it.”
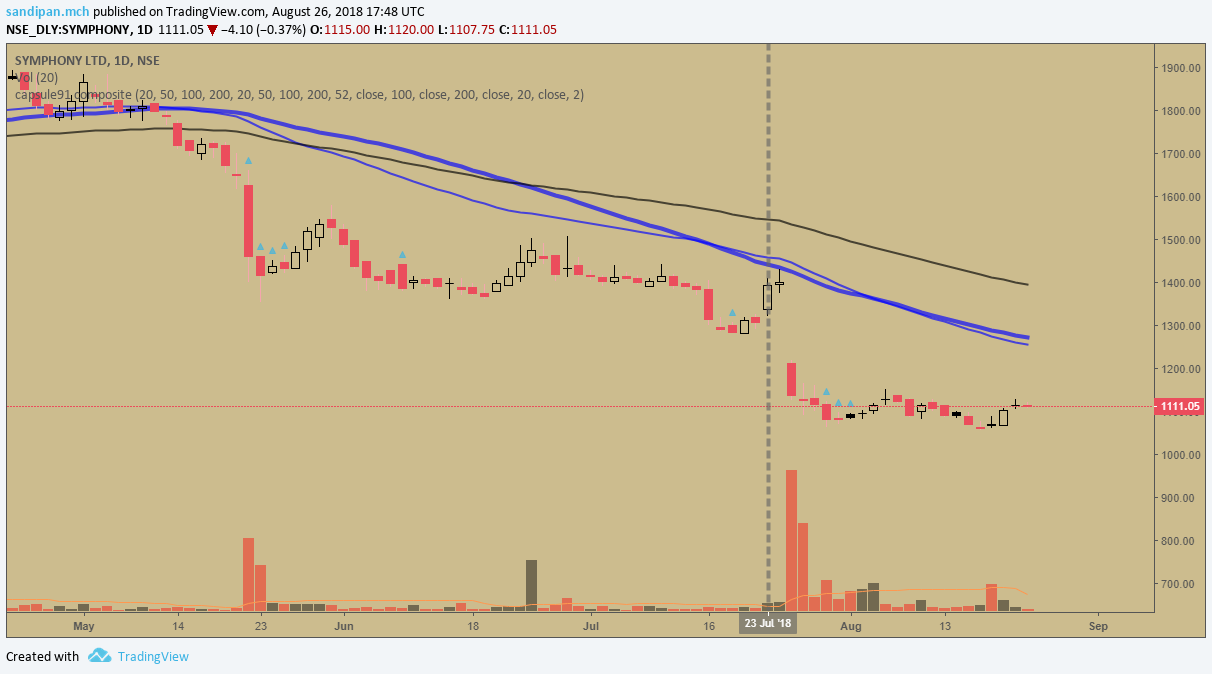
and btw, here is how symphony went after 23rd july
fundamentally, management commentary seems to be bullish about the year long projection about the business, dont track this one closely…[mindtree]
disclaimer… no positions, might be interested if goes in my line of thinking [mindtree]
NO intention to criticism or defame work of any person mentioned, just my observations mentioned
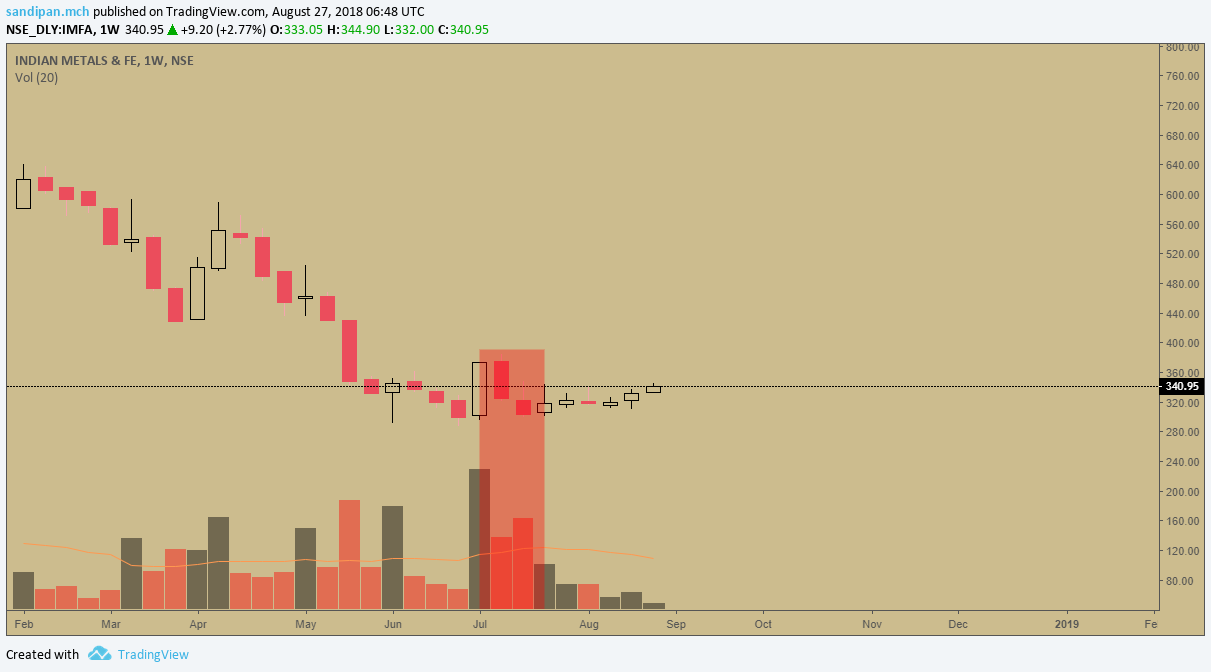
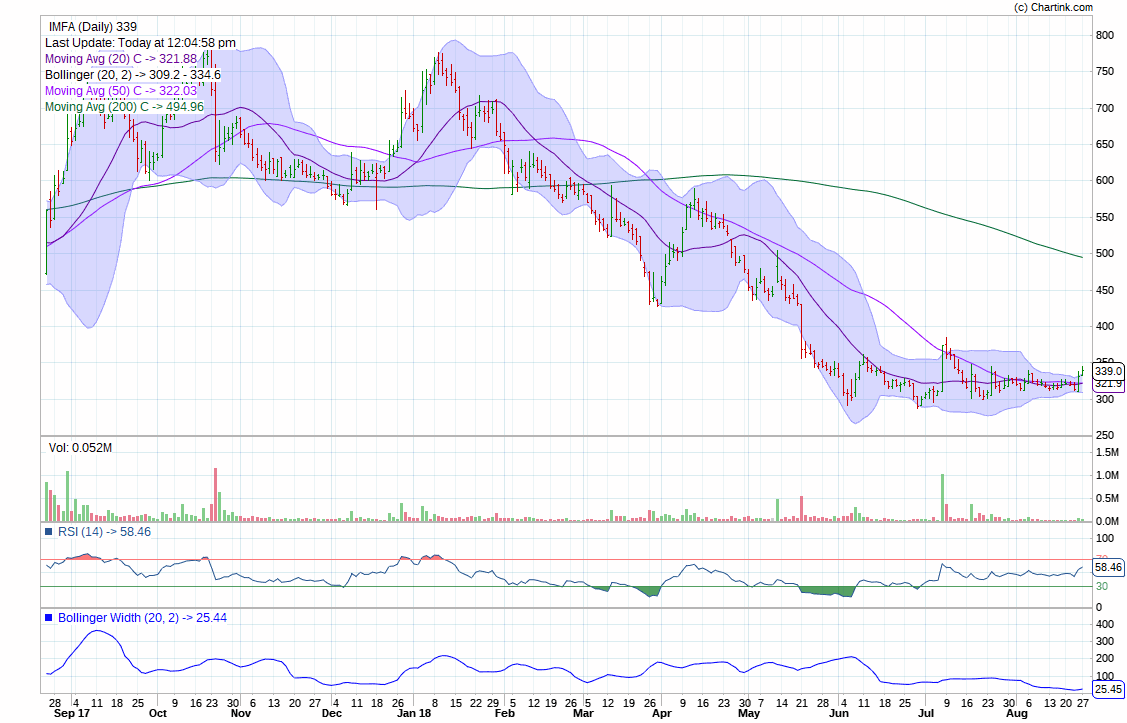
IMFA may be ready for a breakout after a long period of consolidation and volatility compression. Breakout may be confirmed if it closes above the bollinger band today.
Disc. No trading positions. LT holding from lower levels.
Just curious, where does it stand on the cyclical stance ? For any cyclical stock, the breakout may be short term, if the cyclical upturn doesn’t support. (Well you may be aware of it already )
and the ceasework this time at sukinda-mahagirl mines didnt have any effect on the price this time…[although they had enough inventory stock ]
what i am primarily concerned is about the global trade tensions, and tariff war and what is to become of the ferrochrome prices internationally, since imfa is an exporter mainly…
facor alloy manufacturing unit acqusition and indmet arbitration case are other good things awaiting…
chinese steel production is restarting and the scene in south african fecr capacities was stable when i last checked, no new capex announcement was there from other players…
net net, with the uncertainty in the pricing environment, would be a problem , for any market campaign that might be launched by the composite group…
hence i do not think, there is gonna be a significant upside as yet…
downside seems to be limited though because of the valuations the company is at the current demand supply scene with a 0.6 debt equity and 1.5debt/ebidta and the technical aspects…
Well globally ferrochrome industry seems to be in a cyclical upturn. Both the charts of global ferrochrome producers as well European benchmark ferrochrome price (quarterly) seems to support this view.
Issues with IMFA like labour unrest, disturbances in furnace operation and lack of political patronage are more company specific.
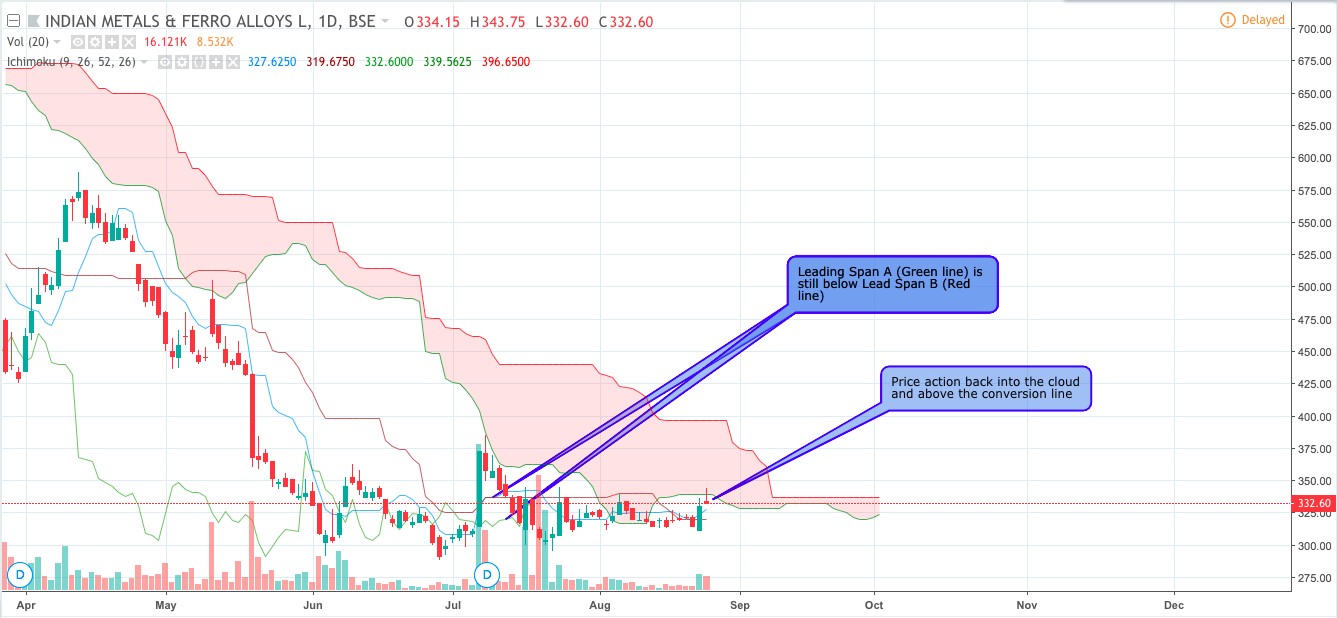
Thanks for your insights. I just checked in terms of technical methods that I’m comfortable with.
The price action is back into the ichimoku cloud, which is v.good trend reversal. But I will consider as a true breakout or a true bulllish upturn move only if the cloud turns green, but looks like that’s not very far.
The cloud will turn green when the Leading Line A (Green Line) goes above the conversion line (Blue line) and Leading line B (Red line).
Also from the chart, seems like 300 is the bottom and finding v.good support. Touched 300 range 3 times in 3 months, but never broke down (A triple bottom!).
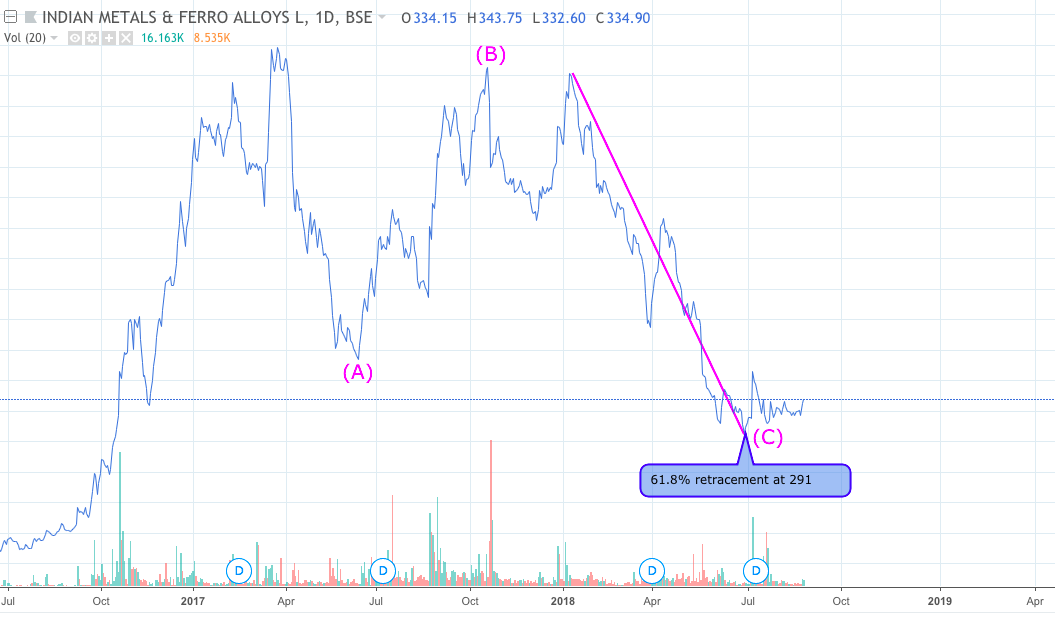
Also, Elliott Wave confirms 61.8% retracement from (B) is at 291 and looks like the stock touched 300 and reversed.


 )
)