Bull therapy 101-thread for technical analysis with the fundamentals

TTK Healthcare update from the initial channel breakout and inverted H&S posts. Now a flag is forming on the hourly

Reliance update from this post which also had a flag on the monthly.

Kokuyo Camlin update from this post

Looks to be overbought and heading into resistance.

Thyrocare - Closed above 200 DMA after a long time and seems to be showing strength. I presume that the buyback is underway now giving support to the prices. This played out in similar fashion in DCM Shriram from 250 levels.

Disc: Invested in all.

2 Likes

suven facing climactic volumes

the yearly R2 resistance at 271 was broken out, it will be important to maintain that level for any change of character in the price action for further upmove…

the action was halted at the arcs above, and 258 level serves as a good support…

this gann chart indicates 344 as a level before any major correction starts

will be watching 271-264 as a small reentry zone, where i am panning addition if i see a base forming there in smaller time fames
disclaimer… invested, no profit booking at the top done, as i believe there is another leg up … betting on the bullish picture

1 Like

@ Capsule

What are your views on Bhageria Industries from Technical perspective ? Technical analysis on the stock would be helpful. On the fundamental front stock appears to be strong and ready for an upmove in near term. Regards.

1 Like

acrysil looking very positive, there is clear evidence of minimal supply that remains in the system…

after rampant shakeout and absorption phases a rounding bottom seems to be forming…

heikenashi still not totally bullish, but reversal is very evident… 2 more days , and confirmation shall be received…

disclaimer… invested, restarted adding, will finish up by next 2 days

Manappuram seems to be ready for the corrective wave. Head and shoulders, price below cloud.

Price action is below the cloud:

1 Like

@CA_Mitul_Shah

please refer to the post i made while picking some of the good base formations for this bull run…

bhageria, hasnot shown anything new to update, so i maintain, the same stand, a positive structure technically, but this whipsaw action has to come to an end…


one more thing to add, is looking at the monthly picture, the market is coming to an indecision point, indicated by the haopen= ha close in the past 2 months heikenashi candle

u can note, previously, there was a smilar indecision point and subsequently, the market decised on the down trend, similar is the situation now,
next month might be a decision maker, in the price action…

i think i had another chart, with important levels, but cannot find it in this thread…
i am posting one of the live chart from the trading website i use, for tracking the action…
the arc is acting as a heavy resistanc,e unless it is broken out, the price action would stay in the bearish zone…

disclaimer… staying out of the action for now, no positions, sold out post q1 result

1 Like

cdsl…

might be a base formation

evidences of accumulation is definitely there, but unless there is a valid change of character or spring action now, the possibility of a redistribution cannot be ruled out…

fundamentals, still hang around with a lot of uncertainties and a tight pricing environment, loss of volumes in a possible upcoming bear market, and a lukewarm primary market…

disclaimer… tracking, not invested

3 Likes

have been trackign thsi chart and the fundamentals for quite some time now…

looks like a base of forming…

volume surges at support…
after selling climax is a interesting thing to note…
what ever this is, redistribution or accumulation… this one is in phase b…
lets see how the change in character occurs in phase c

disclaimer… not invested, tracking

Still a bit early to call it a bottom, IMHO.

1 Like

@devaki.tripathy

note there are some divergences coming up in the oscillators
https://www.tradingview.com/x/rY73OwJF/

monthly heikenashi is still damn bearish, but the volumes have done a unusual surge…
https://www.tradingview.com/x/A34770p1/

1 Like

My notes from observing the markets -

Honestly I don’t understand much of the exotic indicators that you people use, but I understand two simple things - supply and demand. Whenever there is a mismatch between them, things get intesting as it starts a trend.

Breakouts and breakdowns are significant events as it breaks the equilibrium between buyers and sellers and one or the other becomes more powerful.

It’s naive to call bottom of a falling stock or top of a rising one as any individual, however smart he/she may be, pales in comalparison with the collective wisdom of the market.

Fundamentals act as a tether only and stock price tends to overshoot on both sides.

1 Like

i do not think rsi is a exotic indicator, and the bottom one was the macd weighted by volume…
both of which indicates the rate or change of prices aka momentum… which is a mathematically derivative of supply and demand

a divergence in this case, indicates exhaustion of the downtrend…

anyway, taking ur que of supply and demand , which also what i primarily see…
u can see repeated volume surges without making a new low, which might indicate demand has come in and trending to balance the supply which still is in control…
in colloquial term, what people call, buying the dip…
since, this is affecting the price movement, some one with significant influence is doing this, hinting to some big silent entries …

hence this is a suspicion of accumulation going on…
[i have mentioned also a possibility of redistribution, hence i am not calling it a bottom, just that some demand has kicked in, making the chart interesting, hence the notification]

3 Likes

Ador fontech…

Continued…

Bullish closing over 123 which was a scenario i was looking forward to… Might be a breakout…
The upward wick is a concern…
Heikenashi turned bullish after a period of indecision candles…

Disclaimer… Added more longs today, will be averaging further up if a trend sets in…

Acrysil heikenashi showing good reversal from the moving average, should test the previous highs…


Added the entire range from 537 to 555 , in last few days… would like to see breakout of 625 and taking support there for further addition…

2 Likes

Capsule91 / Tech Analysts , if possible can you review and advise on BOROSIL Glass stock chart. Thanks, Chandra

1 Like

hi @Chanrdrab ,

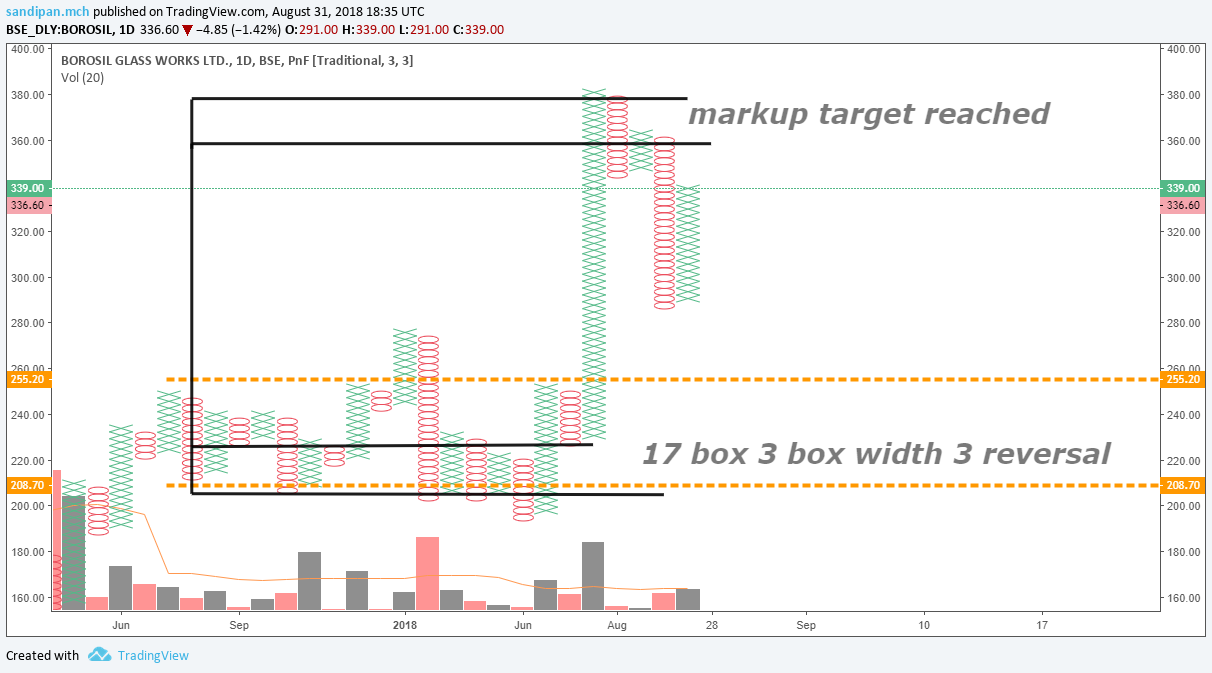
borosil glass was a fine re accumulation, which perfectly reached its point and figure target…
and rotation in the chart happened at the predicted point…


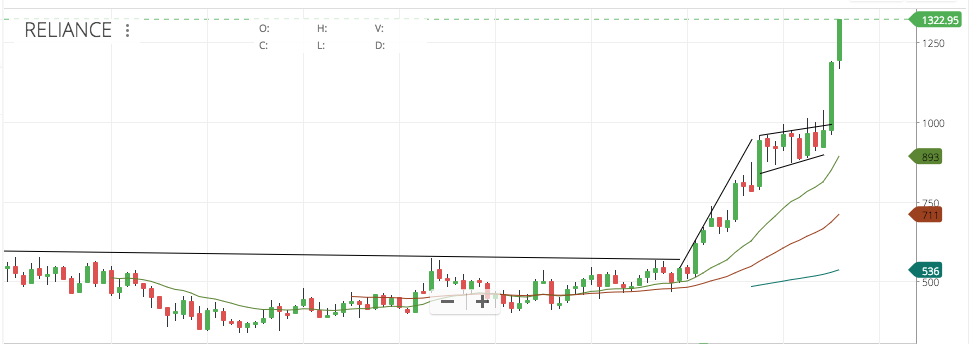
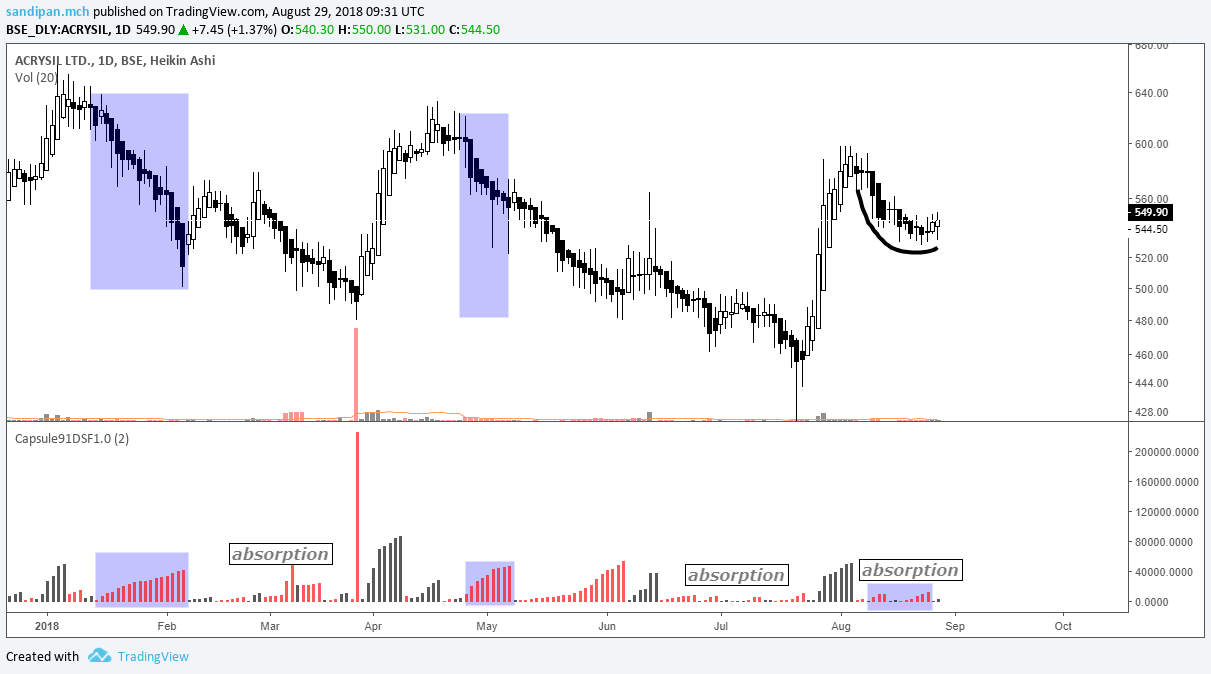
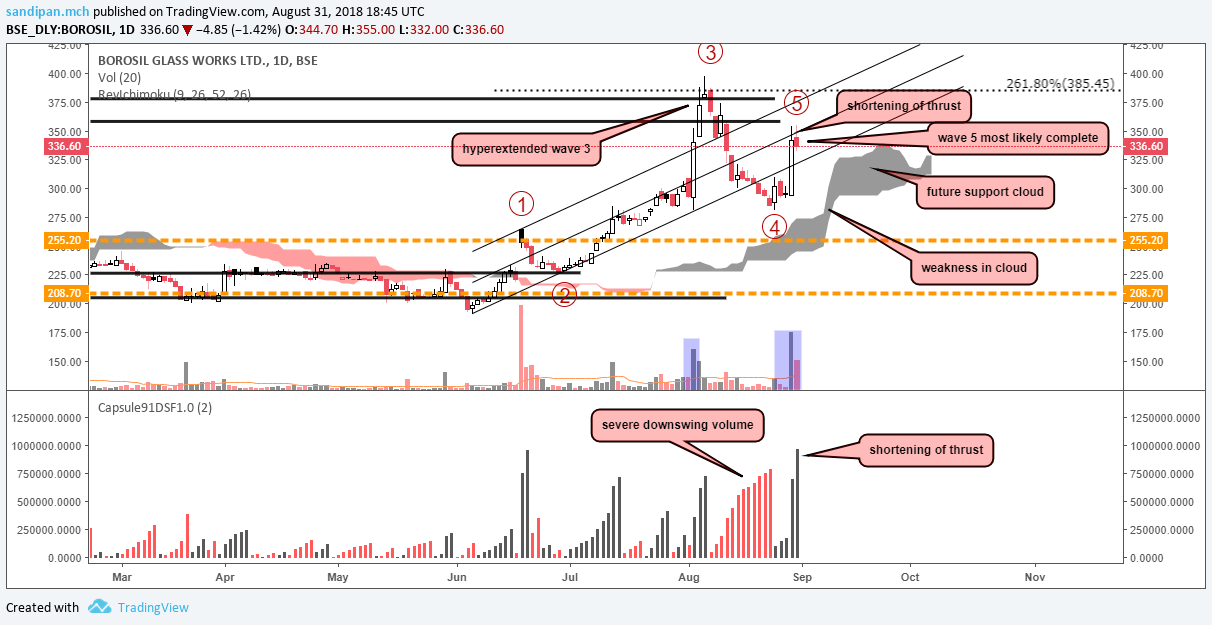
i note a massive volume comeback on the first downswing of the rotation, and this is being followed by a very high volume, even higher than the volumes encountered in the 3rd motive wave impulse, but the result as yet is not similar to the effort, hence for now i will be calling it as a shortening of thrust…
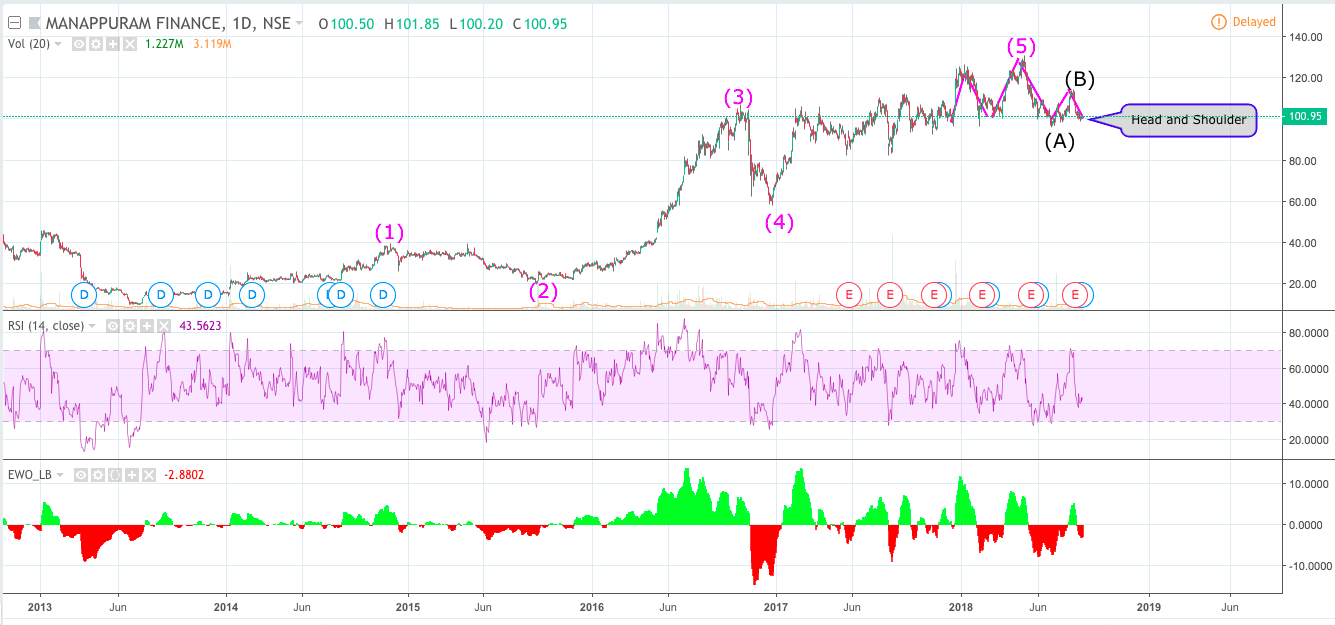
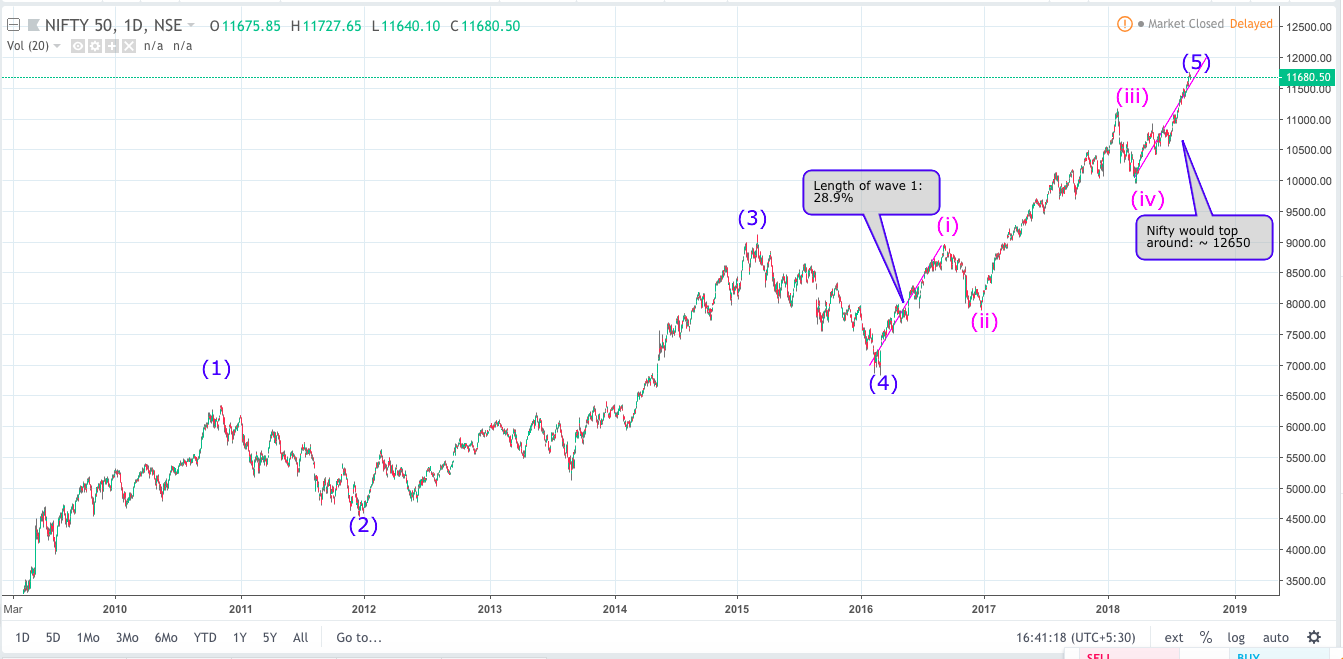
also, when the wave 3 is hyperextended, as a common observation of the elliot waves, wave 5 forms the same length of wave 1[or 1.618times wave 1 length], in this case, both the waves wave 1 and wave 5 marked, are of same length of 74 points as of now[rupee terms]…
as the present upmove can be a b wave of the corrective move…
considering all the points at hand, i will be very cautious with this chart, and if i was in position, i would definitely have started booking partial profits if i am positional trading …

looking forward, since the volumes in wave 5 seem to be more than what we had in wave 3, there is a possibility that there might be hyper extension of wave 5 too, if that happens, that would be an excellent situation to book and protect the massive short term gains one might have had recently from this scrip, near about at the previous top…

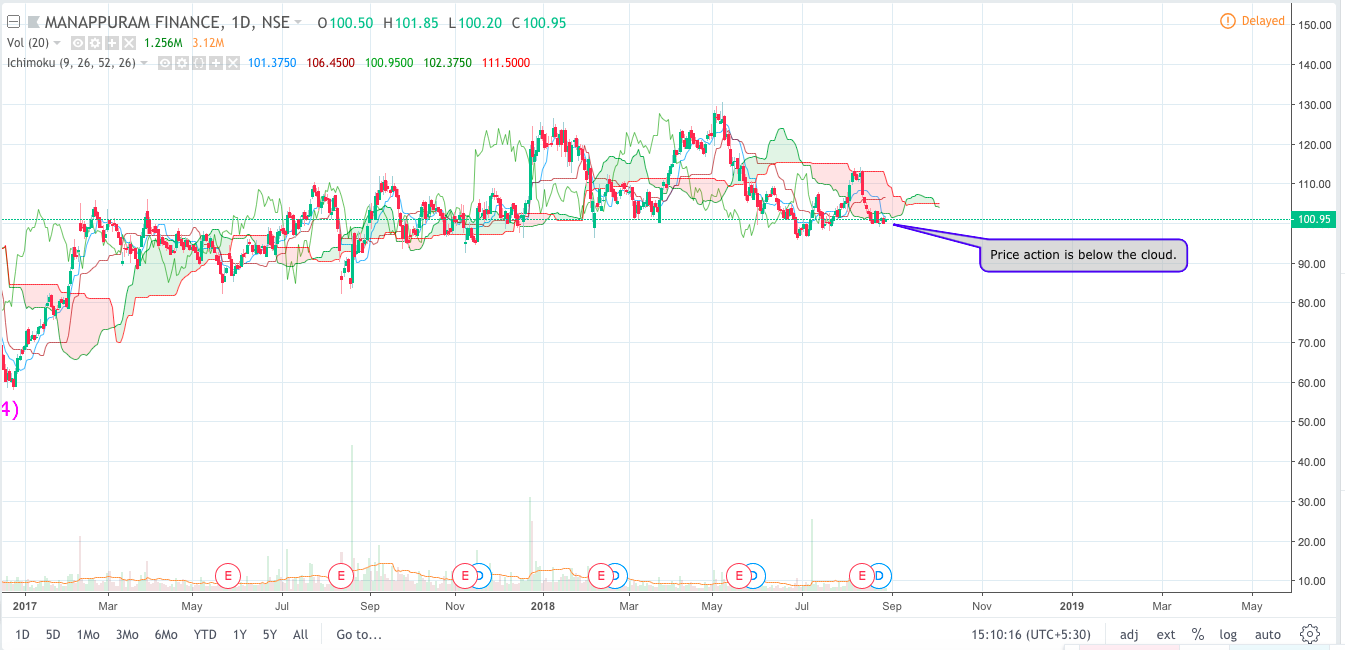
i will have a bearish medium term view on this[based on almost complete exhaustion of demand]

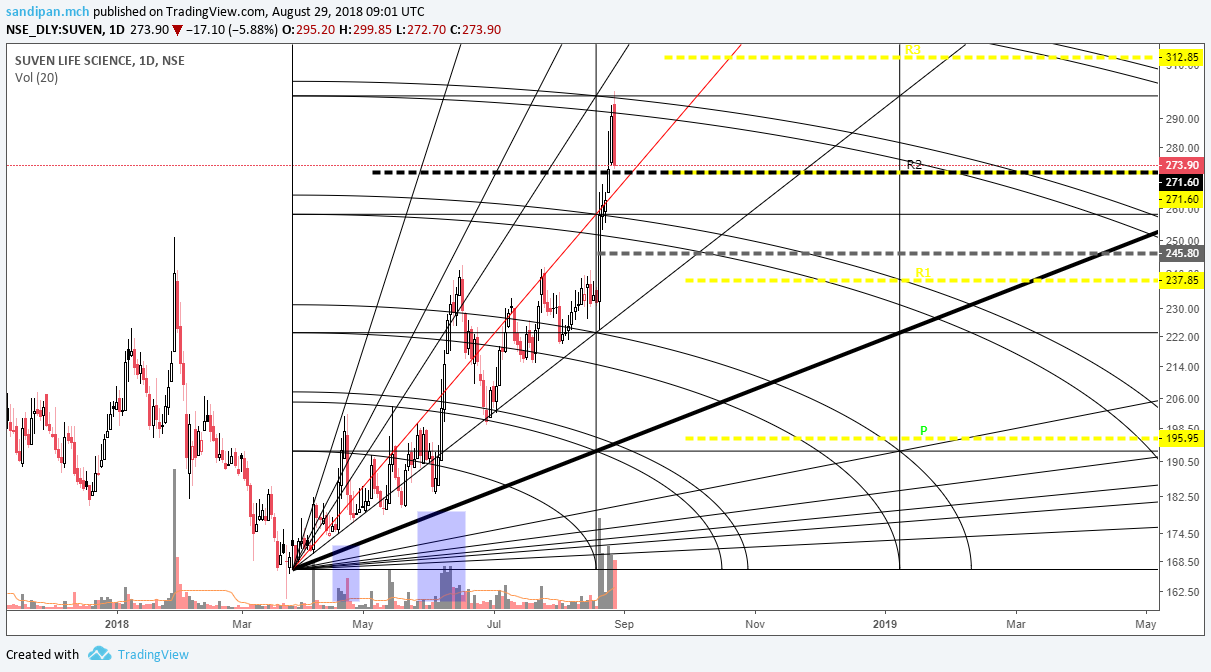
[there is a grey area marked, which has a weak thin zone and a wide support zone, the price might take a breather and consolidate in the grey support zone, before turning down…]

please correlate fundamentally…

disclaimer… no position present or prior…

very very disappointing week in persistent…

action fell out of the triangle, for now, the kumo cloud of ichimoku system , acting as a support, hope it continues to be so, hence i am still biased on this downswing being more of a shakeout rather than a true breakout of the trend…
its hard to ignore the accumulation that had been in place throughout the base formation, and the mark up targets have been no where reached, there was a massice gap down action a few months back, and that might have warranted need for more absorption and hence slowing don of the price action and the stock becoming much much weaker than cnx nifty it…


the weekly heikenashi is indecisive , with a bearish bias…

looking at the volume of this downswing, as of now, its not spectacular as shown in the lower indicator panel… Chart Image — TradingView

smells like a shakeout…

happier chart in suven…


taking support from the gann level and the R2 resistance which i was expecting if the trend is to remain bullish for a new high formation…
indecisive heinkenashi as of now…
contd…

acrysil…
too much momentum , not to break out


[ps ordered sternhagen quartz tiles for the washroom and carysil quartz skin, for my new home under construction a couple of days back, damn costly, but looks magnificent ]

ador is a special mention today, as i opened one of the previous live charts on which i had drawn a gann square a month back…

there are 2 gann squares here, the pink rays belongs to the global chart , one of the arcs [resisting arc]actually [looking almost like a straight line here, almost like earth as it used to seem flat before we stopped being myopic :rofl:]
and the short term gann squar’s final resistance arc broken out, on a beautiful on demand rally…

so change of character across the lifetime chart and the short term chart…

it should be a sight to see the wave 3 take the action off the trading range into markup of phase E of the ongoing 4 year long reaccumualtion

disclaimer… averaging up

cont posts…

updates on the old rating angency stock charts…

icra… looking good, after the spring action]

crisil… couldnt start a trend after the spring action, a drop for a spring retest is still very much a probable idea

care… i am growing increasingly uncomfortable with the accumulation theory here


the gravestone doji/ shooting star, wht ever one might call it, on volume spikes, brings a lot of questions in mind, next will be interesting…

all the scrips are far away from reaching the completion point of accumualtion where the trend can start upwards…

there was a sense of accumulation in greaves cotton, with some short term glitch coming in the price action…

the marked resistance area in the above post still seems to be generating supply…

this acquisition can be interesting going forward…

The current elliott impulsive wave has started from 2009, and the last impulsive wave of 5 is going on at present, also the subwave of wave 5 is maturing too, all in all we are heading for a correction. Most of the times, the wave 5 would reflect wave 1’s character. In that case, Nifty would top around 12600-12700 (applying same length of wave 1). In case if the wave 5 gets extended (which is unlikely due to the tricky political situation in India next year), it won’t go more than 13200.

Enjoy the ride and be cautious when Nifty touches 12600, since when the current cycle ends, things would be looking ugly.

4 Likes