
any updates on the stock??
the company has for the most time trade at twice the cash in hand with good FCF…thus aleways been a cash play…directors take no renumeration as well
I was doing some socks shopping on amazon.com and found this. It spoke about some material called polypropylene from which this pair was made. I know jackshit about raw materials used in making socks.

Curiosity piqued , i did a basic websearch on PP and found that it was some sort of Non-Woven fiber as opposed to woven fiber. Woven fiber needs to be weaved into fabric ( cotton, wool , silk etc ). Non Woven is bonded or meshed together by some process. PP is plastic or more specifically a thermoplastic.
Ok i said lets find out how interested people are in woven fabrics vs non woven fabrics in shopping. I guessed that woven will trump the hell outta non woven. After all, clothes are woven right? So i went to google trends and did a comparison. This is what i found.
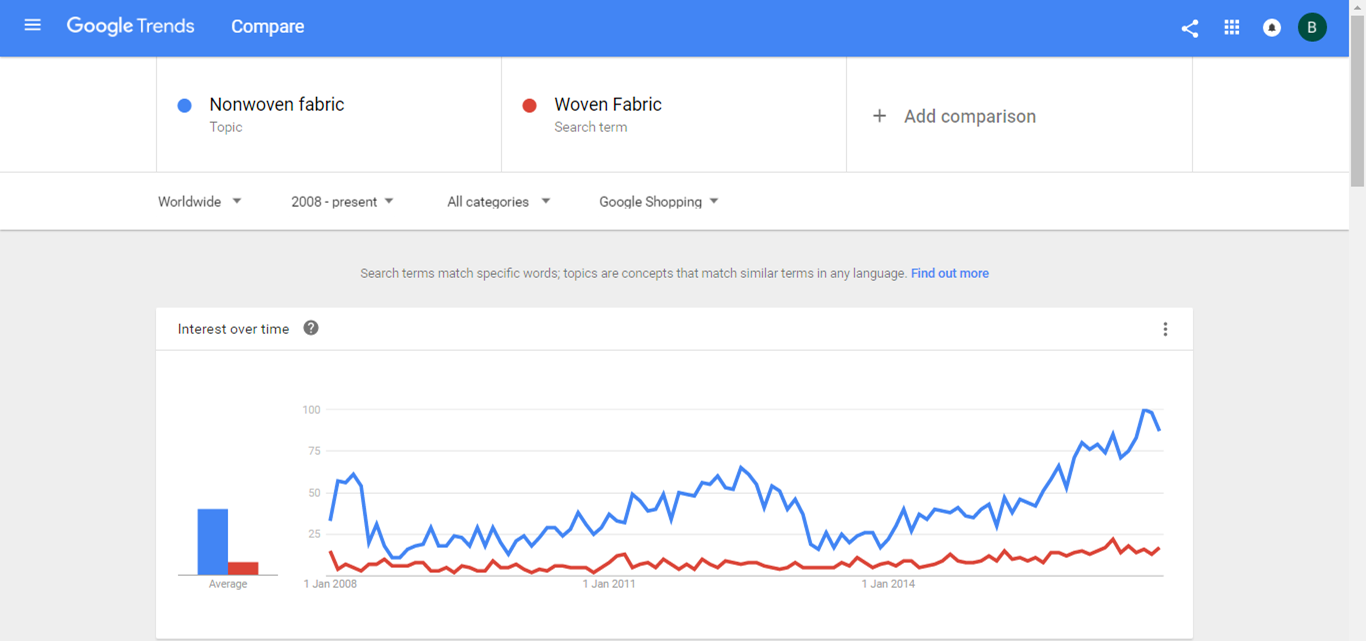
Non Woven to put it gently is hitting the ball out of the park here. the graph sure looks like that.
The equation slowly forming in my head is - Textiles → Non Woven → Polypropylene → ?
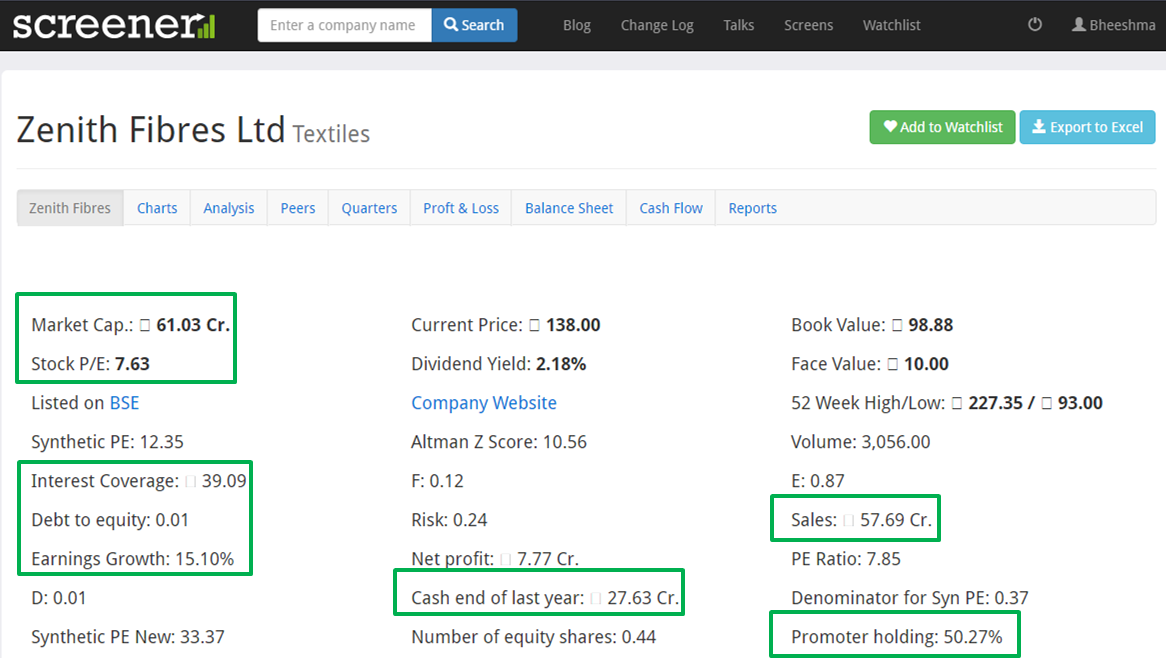
The “?” and its a big one led me to do a websearch on leading PP fiber players and enter Zenith Fibers. So i entered Zenith Fibres into gods gift to mankind , screener.in, and out popped this
As of now i am looking at all the possible products that can be manufactured using PP and the list is endless… diapers, surgical masks, guitar capacitors, bags, shoe soles, thermal wear ( a 3 layer PP outfit helps its wearer stay warm in sub-zero temperatures), plaster, roads, clothes, jewelry, lids , carpets, curtains, floor mats, packaging, PP mesh is even used in Hernia operations!
I will add to this thread soon… but a quick scan of this product is very very interesting. Hope others can add to this
Thanks and happy investing - Bheeshma
4 Likes
I had a look at this script in the past and the numbers look very good as you pointed out. But my only concern is the muted sales growth for last many years. Also there is not much info available about the company specially on its capex plans. So I am not sure if the management is hungry enough.
As a member posted above this is what dr vijay malik said about the stock to which I agree -
“However, in order to generate higher growth rates of 20-25% & above and to generate significant wealth for shareholders, Zenith Fibres Limited needs to expand capacity of its operations. An investor should keep a track of the company to follow up on any capacity expansion plans it may have in future.”
disclosure - not invested.
here are some numbers
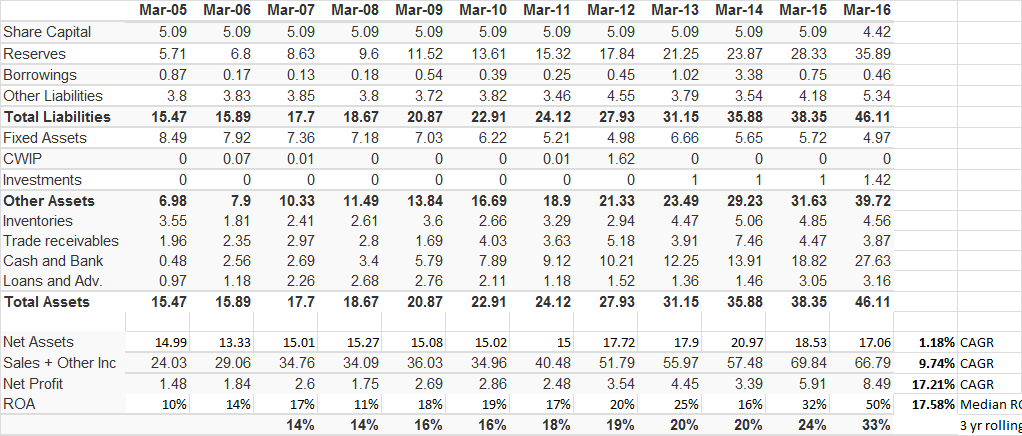
Net assets ( Net of Investments & Cash) employed in the business have grown only by 1.18% in the last 12 years while revenue has compounded by 9.74% and PAT at 17.21%. It seems to me that Zenith is able to generate FCF with little or no investment marginal assets. Infact, in the last 10 years it has compounded its cash balance by whopping 29.54% without redeploying it anywhere. Maybe all the cash is for an unannounced capex plan. Maybe for an acquisition. I really dont know and i am not looking at the cash at all. What is exciting to me is that the business is generating a lot of money from a product that seems to be in an industry with a lot of interest (Non-Wovens).
Here are some additional numbers. We all know that Return on Capital has two main drivers. Net Margins and Capital Turns. and as seniors on this forum have pointed out - its rare to find a company that increases margins and capital turnover over time ( refer to @Donald comments in the Ambika Thread ![]()
I am looking at the NOPAT margins and capital turns of Zenith for the past years and here they are
Margins have increased from 8% in '07 to 13% in '16 and the biggest improvement has been in capital turns - which has increased from 2.28 in '07 to 3.74 in '16. Both the key drivers of ROCE have gone up significantly. In my opinion this is because of the expanding interest in non-wovens ( see my earlier post). And all these performance improvements have been done while remaining DEBT FREE
3 Likes
Thanks Bheeshma fo the heads up. Been noticing your good work in several posts.
Just to clarify for other learners, I think you wanted to mention Operating Margin (not Net Margin) and Capital Turns as the 2 main drivers of Return on Invested Capital
RoIC = NOPLAT/ Invested Capital = EBIT/Invested Capital x (1 - Tax rate)
and EBIT/Invested Capital = [EBIT/Revenues] x [Revenues/Invested Capital] = Op Margin x Capital Turnover
Or, Operating Margin and Capital Turns are the 2 main drivers
and Yes, its rare to find both going up at the same time.
That is the starting point to spark our interest in a potentially promising business transition. Now we need to answer why this is happening in this business. And is it likely to be sustainable, and why? perhaps some of these are already answered in the thread?
I am not familiar with this business, will take some time out in the next couple of days to read this thread, and check other vital stats :)…in the middle of something, as usual.
3 Likes
Hi Bheeshma,
Almost all of Margin improvement has come in FY16. What was the reason for the same?
Is it sustainable?
If Sept quarter results are true indicator, margins have started to go down again. What is the reason for the fall?
thank you for your encouragement!
In the meanwhile, i’ll try to gather all the dope i can on this company and its business. Ive already added a new word researching this business - Denier - its the weight 9000 metres of fiber weighs. Silk has a denier of 1, 9000 metres of a single strand of silk weighs only one gram! Zenith manufactures fiber ranging from 2.5 denier to 40 denier. I am guessing lower the denier the higher the price realization
Here’s a small gift for your work
Zenith Fibres.xlsm (85.4 KB)
(Disable Macros and ignore Links while opening)
You may like to use this template as a fist-level comprehensive 10-year look-in for any business you want to start investigating. If anyone is NOT already using the uber cool custom excel feature of Screener.in, here’s how one can do that.
For added perspective, also attaching the same template to compare say an Ajanta Pharma - purely from a numbers/earnings quality perspective (they are form entirely diff sectors for sure ![]() )
)
Ajanta Pharma.xlsm (86.9 KB)
Some folks may like to take the lead in interpreting what the 10 year data-points are pointing to. Let’s start connecting the dots. Whats changing for the positive in this business and why? What doesn’t look good and why?
The more we (collectively and individually) open up and expose the assumptions/interpretations in our minds that we make from the data we see, the better we become at the game (no gainsaying that data may be same but its how a novice learner, senior practitioner, a pro, and finally the domain-insider reacts to the same data points - is where all of us can continuously learn from and get better at the game)
Am travelling for a marriage function from tomorrow, so may not be able to contribute back immediately. Like to see others taking a shot meanwhile at throwing out what they like and maybe do not like in this business
Cheers
5 Likes
Had a brief look at the data for Zenith. The performance looks impressive until June 2016.
However the Sept results are not inline with recent performance. There is no note explaining the sudden fall in revenues.
Besides that, being a small company seems there is a lack of professionalism.
AGM minutes have results being proposed and seconded by the Chairman and his son (I guess).
A special resolution is passed to reimburse the chairman for medical expenses. About 35 lacs was paid as per the Sept results notes.
10cr of the cash has been shown as non-current investment. Need to check where exactly this investment is done.
Overall growth in cash position is positive.
2 Likes
Had a typo/copy-paste error in company name in “Customised” worksheet and “Calculated Data” worksheets. Thanks Saji john for alerting. Details here
Uploaded the corrected Excels for the same in Original post in this thread. Those who might have downloaded the earlier file may please download this again, so there is no confusion.
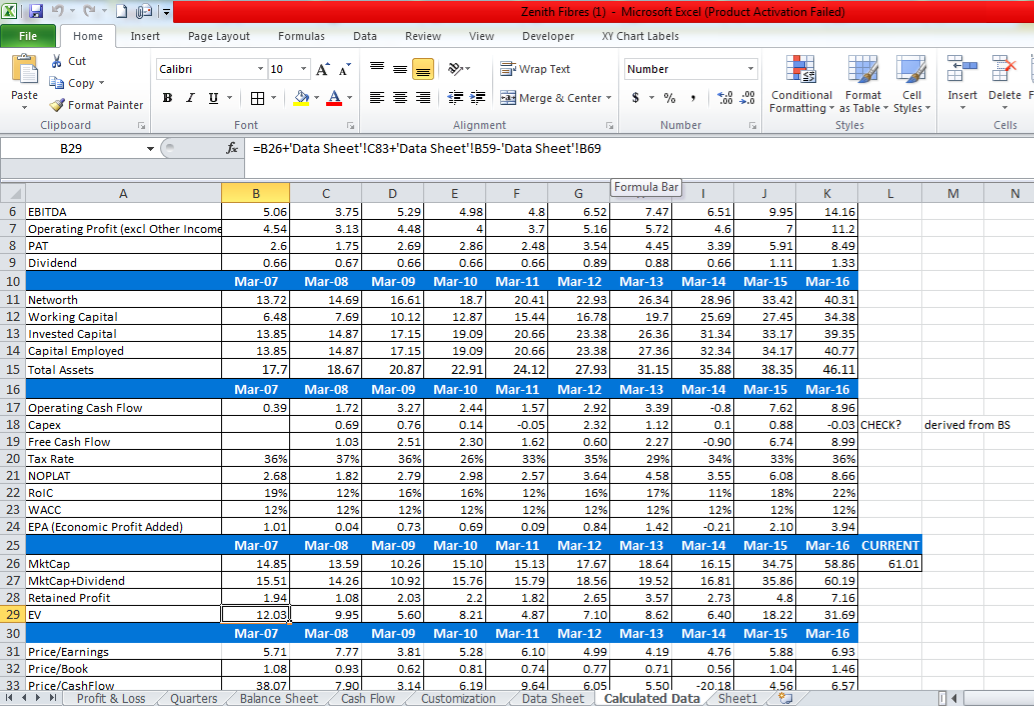
In calculating EV for March 2007 the formula used in the sheet is
B26+‘Data Sheet’!C83+‘Data Sheet’!B59-‘Data Sheet’!B69
where B26 = Market Cap in March 2007
‘Data Sheet’!C83 = Cash from Investing Activity in March 2008
‘Data Sheet’!B59 = Borrowings in March 2007
‘Data Sheet’!B69 = Cash & Bank in March 2007
Is there a reason for adding Cash from Investing activity in March 2008 in arriving at EV for March 2007?
The other technical items that i didnt understand are
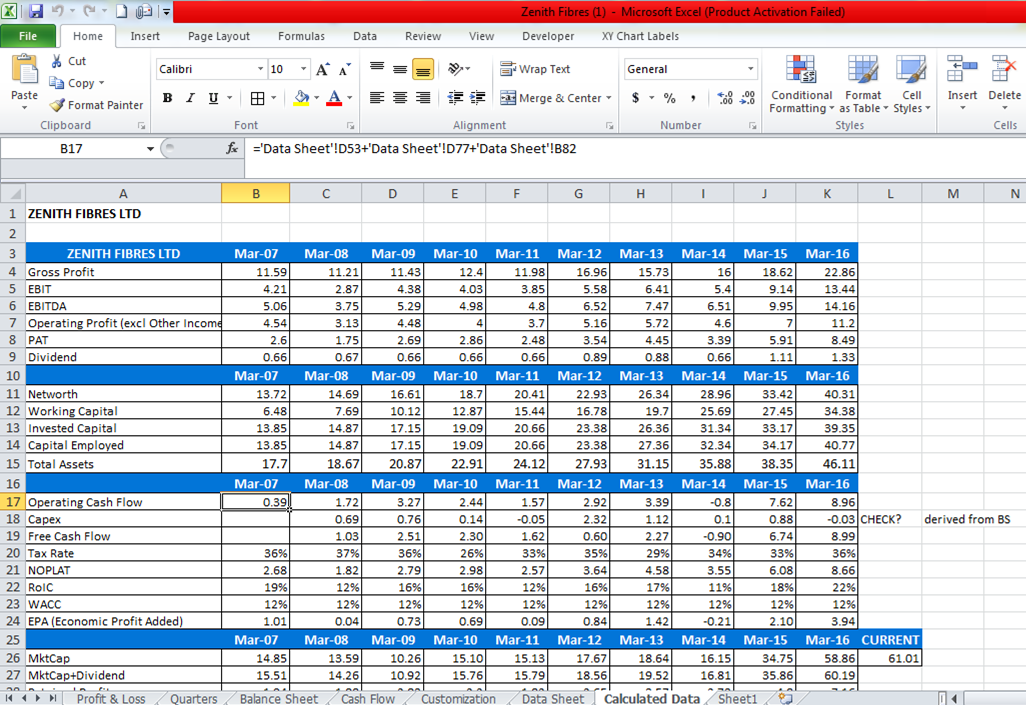
Operating Cash flow for 2007 is calculated as =‘Data Sheet’!D53+‘Data Sheet’!D77+‘Data Sheet’!B82
‘Data Sheet’!D53 & ‘Data Sheet’!D77 are blank cells. Is that intentional ?
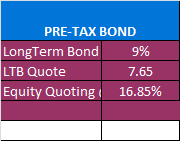
Another one that i couldnt grasp is in the sheet “Customization”. I am unable to get what LTB is.
2 Likes
Thanks for sharing this very insightful sheet.
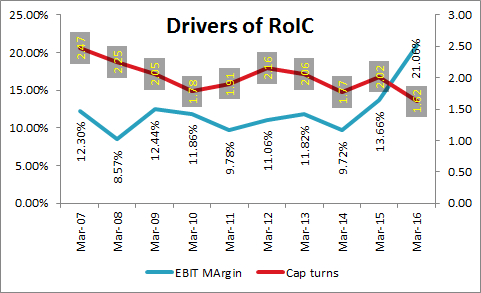
From the data it seems its the improved EBIT Margins that are driving the improvement in RoIC. EBIT margins have been improved since '14. But the Cap turns have been going down ( contrary to what i deduced earlier. I was calculating Capital invested and profit differently compared to the sheet shared).
For reference find attached the Ajanta Chart
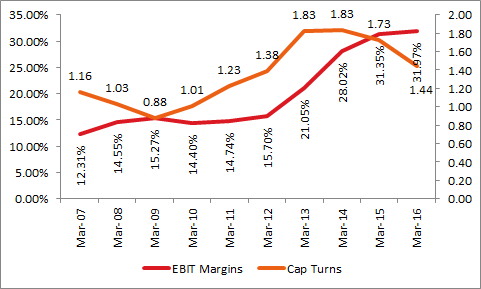
I have also tried to compare market cap added to EPA added having Ajanta as the ref point
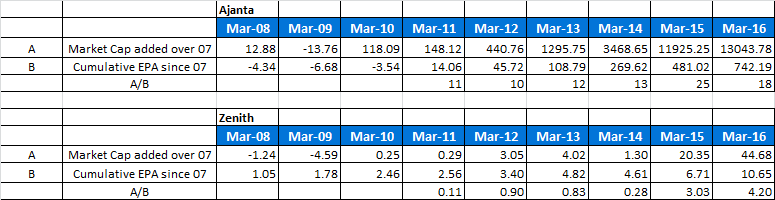
Sometime in March 11, Cumulative EPA for Ajanta turned positive, every crore of EPA added by Ajanta added 11cr to its market cap - an equation that more or less remained unchanged till 2014 after which an addn crore added 25cr in 2015 which has come down to 18cr in '16.
Looking at the Zenith numbers, an additional crore in EPA added about 0.11 cr in 2007 which has gone up substantially to 4.2 cr since.
Can we say by way of an initial hypothesis that Mr Market values each addn unit of EPA equally regardless of whether it came from Ajanta or Zenith? ( lets say each additional crore in EPA adds 10 cr to the mcap , it could be less or it could be more )
1 Like
Fiber web india, too is in similar space and margins of this company too jumped a lot in last 2 years.
Mgmt indicated its mainly due to fall in PP prices
Some things that i could cull out on the industry and zenith
Zenith Fibres manufactures something called PPSF or Polypropylene Staple Fibre. The main raw material it uses is Polypropylene (PP). It procures PP and converts it into fibre of varying thickness ranging from 2.5 denier to 40 denier. A denier is a measure of the fineness of fibre more specifically it refers to how much a 9000 meter strand of that fiber weighs in grams. Silk has a denier of 1 i.e 9000 meters of silk weighs 1 gram. A human hair has a denier of 20. PP is a plastic - more specifically it’s a thermoplastic. There are 16 types of thermoplastics (https://en.wikipedia.org/wiki/Thermoplastic) and PP is one of them along with the popular ones ( Nylon, Teflon, Polystyrene etc ).
Zenith operates in an industry called Technical Textiles, which falls under the Ministry of Textiles (http://technotex.gov.in/)
There are 12 segments in Technical Textiles as defined by the ministry and they are as follows:-
- Agrotech (Agriculture, horticulture and forestry)
- Buildtech (building and construction)
- Clothtech (technical components of footwear and clothing)
- Geotech (geotextiles, civil engineering)
- Hometech (components of furniture, household textiles and floor coverings)
- Indutech (filtration, cleaning and other industrial usage)
- Meditech (hygiene and medical)
- Mobiltech (automobiles, shipping, railways and aerospace)
- Oekotech (environmental protection)
- Packtech (packaging)
- Protech (personal and property protection)
- Sportech (sport and leisure)
The overall size of the technical textile market in India is expected to be 1,16,217 cr in 2017-2018 (http://technotex.gov.in/BSTT_Rev_Final_report%2018042016.pdf) which translates to a CAGR of 13.6% over a 10 yr period (in 2008 it was 36,775 cr).
This growth is going to be led by new textiles that have emerged in the last 2 years. Of this 1,16,217 cr, ~42% is accounted for by packaging , ~11% by household products & ~10% by Automobiles. In short this industry is growing between at a CAGR of 13% to 16%.
Zenith manufactures the fibre/yarn that serves as the raw material input to these industries; by itself it doesn’t manufacture any of the applications of PPSF. It’s just a raw material supplier to companies like Fiber Web (@jatin)
On the supply side
The Capacity of PPSF in India as on 2012-2013 was 9000 MTPA (http://technotex.gov.in/BSTT_Rev_Final_report%2018042016.pdf) and as per Zenith website (http://www.zenithfibres.com/index.php) its production capacity is 8400 MTPA, which implies that it accounts for 93% of the Indian production capacity of PPSF ( something that needs to be verified obviously but various website posts do point to that - http://www.rajbihani.com/raj/25/ ) . In the same GOI report the production was pegged at 4300 MTPA ( page 273) in 2012-2013 which correlates with the figures reported in the Zenith AR 2016 ( 4725 MT ). It does appear that Zenith likely produces more than 90% of Indias PPSF requirement!
Prima facie, it seems to be a monopoly.
On the demand side
Total PPSF consumption in India was 3500MTPA in 2008, which has gone up to 4600MTPA in 2013 which translates to a CAGR of 7.1% ( this also matches with the zenith numbers – sales in 2009 were 3406 MT (AR2010) and in 2016 it is 4725 MTPA)
On the lack of capex - clearly there wont be any plans at least for the next few years as the capacity utilization is around 50% - that seems to be a big positive to me - they will need no addn capex at least till consumption reaches their installed capacity of 8400MT
11 Likes
There is another unlisted co. Nirmal Fibres which claims to have PSF/PPSF total installed capacity of 1500T/month i.e. 18000 MTPA. Source: http://www.nirmalfibers.com/aboutus.html
Considering that numbers in the Government pdf don’t add up
Also I am a bit concerned about the demand and future growth visibility of topline. Besides what are their plans for cash utilization,balance sheet doesn’t look very good from capital allocation pov.
Discl. Small position <1%
Nirmal fibres manufactures Recycled Polyester Staple Fibre (PSF) along with PPSF and other non woven. Zenith manufactures Polypropylene Staple Fibre exclusively. What i want to say is that maybe a large part of the installed capacity could be just Polyester Fibre. The site doesnt give the breakup of the installed capacity anywhere. It would be great if you could share it here
Corrected Excel file.Original post files have been replaced with corrected ones
Zenith Fibres.xlsm (85.4 KB)
-
EV = MktCap+Debt - Cash and Cash Equiv, or in the excel it should be
EV=B26+‘Data Sheet’!B59-‘Data Sheet’!B69
another inadvertent error - don’t know how that crept in
so just deleting that ‘Data Sheet’!C83 would do the job
Everyone using this Excel please make the change. -
Operating Cash Flow doesn’t need any calculations:). Its a straight lift from the Data Sheet B82 from the Cash Flow section

Delete the others ‘Data Sheet’!D53 & ‘Data Sheet’!D77 please and copy across all the columns will do the job. -
LTB = Long Term Bond
Will leave you to do some searching -
EPA to Market Cap correlation - perhaps trying to draw correlations between EPA to MCap - especially across Sectors will be futile. EPA is a hard Tangible value created number every year whereas Mcap can and does have lot of “Intangibles” Value also built-in. Just noticing the EPA trend (higher the better) and comparing EPA/Sales as a ratio was the only meaningful conclusion we could arrive at. EPA/Sales figure is usually seen to be high-teens for sustainable businesses across industries
But please do experiment and tinker around - its good fun - and who knows what you might latch on to
So, thinking about how to value Intangibles in general (as alluded to in teh ART of Valuation thread) and why a Pharma business of Nicholas Piramal is acquired at 9xSales whereas a Chemicals Business or other Industrial Processor may be valued/acquired at only 1-2xSales may start making us thinking in the right direction
Pls check and point out any other such obvious errors that might have inadvertently crept up in my rush to finish the job. Away for next 3-4 days, so hoping no major errors are fund ![]()
1 Like
Got it, makes sense if i think about it now. Quite clearly - Intangibles , all that embedded know how has to contribute to the higher valuation compared to EPA which is just whats happening in the present. I think i got carried away with your sheet  Also i see that you have taken 12% as the WACC as a standard. I am sure different industries will have a different number. I’ll try and get a handle on that, i am sure there is a thread here somewhere that discusses that.
1 Like