
Hi,
I am initiating this thread as starter so that we can dig into the concept further. It has helped me a lot in various ways (Life, Investment and Trading).
Concept - Clustering
Clustering as a concept is widely applicable to many fields, which make its application even more useful in market context. It resembles PARETO PRINCIPLE which states for many events 80% effects come from 20% of causes. In market context, price moves clusters. Big changes often come together in rapid succession, and then come long period of minor price changes or ranged move. Price movement do not follow well mannered bell curve, they follow much violent curve that make investors ride bumpier and rewarding.
Examples - In General Context
1) Clustering of Population - Density of population clusters. Historically coastal cities have far higher density of population - Tokyo, Shangai, Mumbai, New york, etc. To give a sense, If everyone live as densely as they do in Mumbai, entire world’d population will fit into Germany (this analogy can be compared to clustering of volatility in market context ;-)). Similarly, if everyone lives as densely as they do in Canada, we will need 14 earths to fit us all (This can be compared to lack of volatility in market context)
2) Clustering of Natural Calamity - The world’s greatest earthquake belt, the Circum-Pacific seismic belt, is found along the rim of Pacific ocean, where about 81% of world’s largest earthquakes occur (clustering of earthquakes). This belt is also know as “Ring of Fire”.
3) Clustering of Wealth - 86.2% of world’s wealth is concentrated among 8.2% of world’s adult population, while 2.4% of wealth is concentrated among 73.2% of adult population. Classic Inequality. Similarly, 99% of Warren Buffet’s wealth came post age of 58. 3-4 stocks would account for significant wealth creation in Rakesh Jhunjhunwala’s portfolio.
4) Clustering of Natural Resources - Five countries namely China, US, Russia, Australia and Canada accounts close to 50% of Gold’s production. South Africa accounts for more than 50% of world’s chromium production. China accounts close to 50% of world’s iron ore production. Even within countries we will find concentration of various natural resources in certain areas.
5) Clustering of Emotions - Even emotions clusters ![]() Daily working life is largely monotonous in terms of schedule while break clusters during few weeks in a year. Physical love is much more intense (clusters) during initial phase of marriage life ;-).
Daily working life is largely monotonous in terms of schedule while break clusters during few weeks in a year. Physical love is much more intense (clusters) during initial phase of marriage life ;-).
Examples - In Market Context
1) Clustering of Volatility
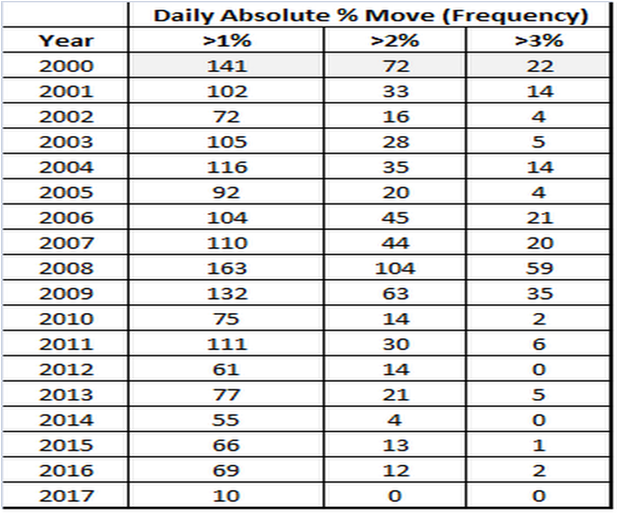
Above data is daily nifty % move in absolute terms. As can be seen volatility in terms of frequency of daily move more than 3% clustered around 2007-2009. While currently we are experiencing lack of such moves (post 2010), clustering of lack of volatility.
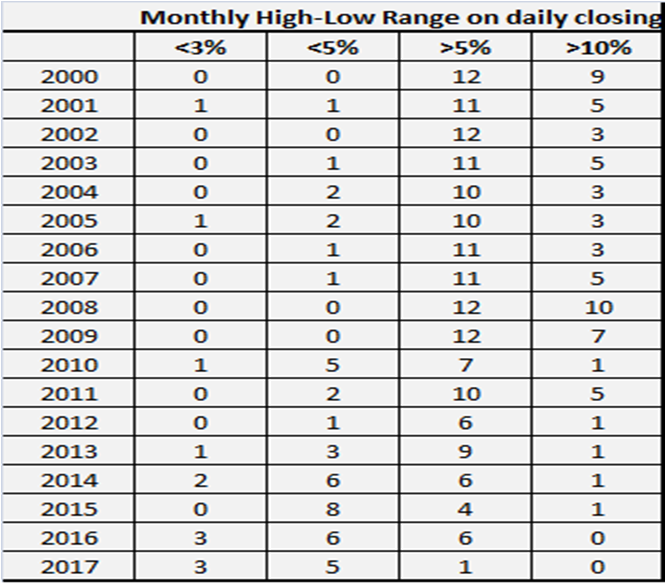
Above data is Nifty’s monthly frequency (number of months) high low range in % terms (again absolute). Again similar conclusion can be drawn as above.
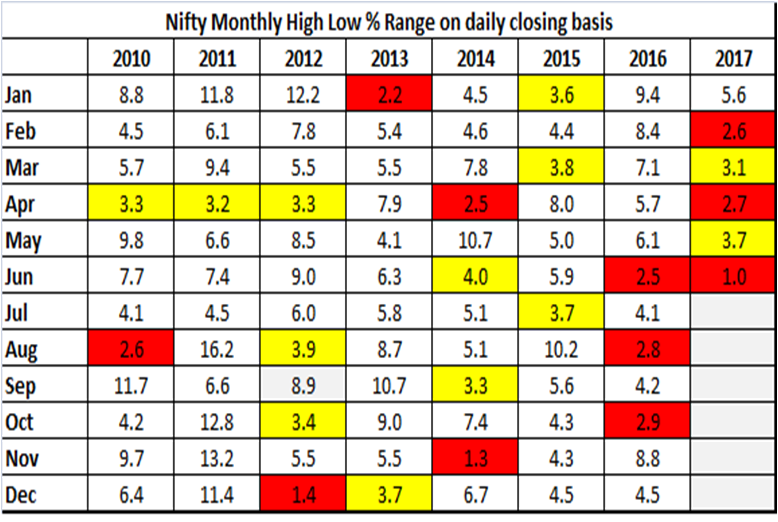
Above is one of my favorite data point ![]() I largely use it to initiate options trade (Hint - it needs lot of waiting). It shows Nifty high low range in % (absolute terms). Red box indicates extreme compression (range of less than 3%). Yellow indicates mild compression (range of less than 4%). One of better time to initiate options buying (broadly straddles) is when Nifty enters Red box. Subsequent month typically have higher volatility. For eg, when I presented this at VP Goa, 9600c + 9400p was available at Rs 130, indicating even a 2% move will make money. Today is expiry and pair is worth (largely 9600c value) Rs 490.
I largely use it to initiate options trade (Hint - it needs lot of waiting). It shows Nifty high low range in % (absolute terms). Red box indicates extreme compression (range of less than 3%). Yellow indicates mild compression (range of less than 4%). One of better time to initiate options buying (broadly straddles) is when Nifty enters Red box. Subsequent month typically have higher volatility. For eg, when I presented this at VP Goa, 9600c + 9400p was available at Rs 130, indicating even a 2% move will make money. Today is expiry and pair is worth (largely 9600c value) Rs 490.
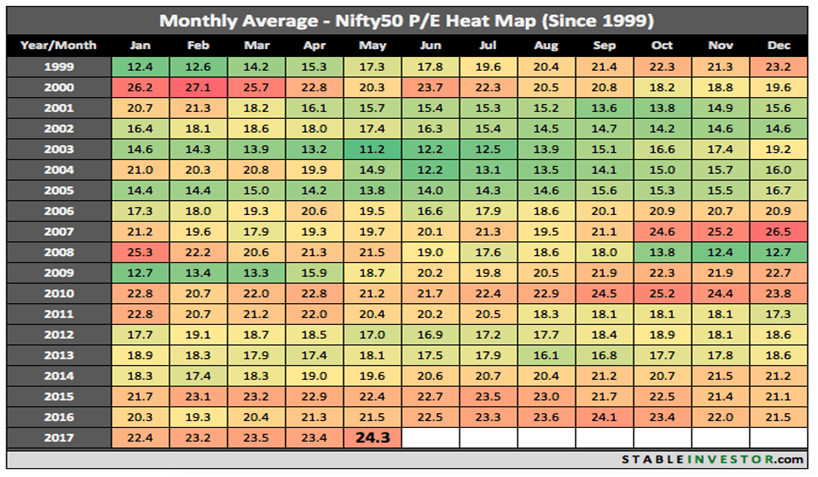
2) Clustering of Valuations - Even valuations clusters. We spend large amount of time either in over valuation or under valuation. Very brief at extreme under valuation or extreme over valuation. Rarely at Fair Valuation ![]()
3) Clustering of Returns -
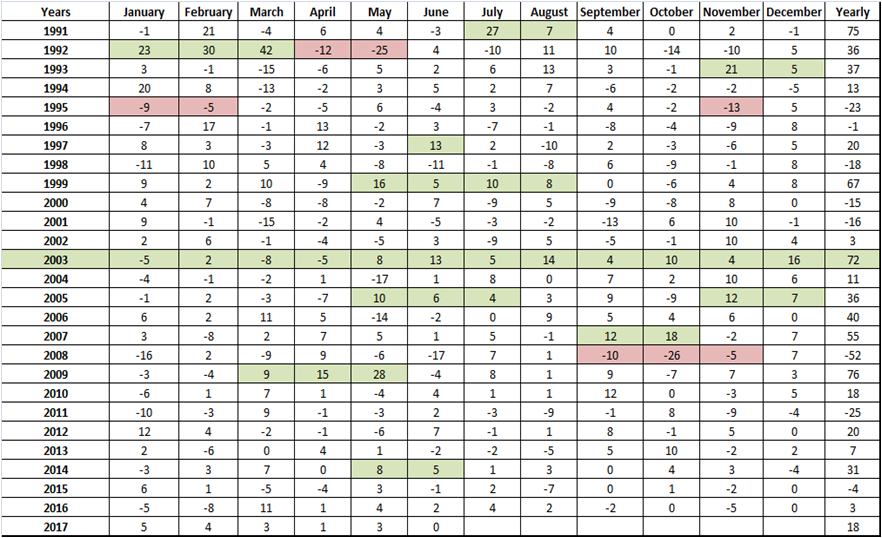
Above data is Nifty’s monthly and year return. Few months will account for large part of yearly move. Only exception being 2003 where returns were pretty uniform. Returns largely cluster.
Similar analysis can be extended to Stocks.
Learning and Application of the Concept
It is important to realize that things in life and markets are not evenly distributed.
-
Effort in terms of research for idea generation could be 80% while output could be 20%. While, only 20% of output could actually make money. Hence, investment process should be diligently followed (without frustration) and right allocation is key.
-
In terms of time and amount of information needed to research an idea. Many a times small amount of quality information/analysis determines the action on the idea. Incremental information and analysis can dilute the overall analysis.
-
Within portfolio few stocks will rise disproportionately. Hence right allocation is key to generate better returns.
-
In terms of trading, timing becomes key if one believes in concept of clustering. Lower number of trades has higher probability to generate money. Since opportunity itself clusters.
-
Since returns are largely clustered followed by long periods of calmness or ranged move. Patience is extremely important. Beyond a point on a larger size compounding becomes very powerful machine. Longer survival ensures very high probability of making money.
6) Be on a lookout for any abnormal move, be it in terms of spike in margins, sudden spike in price move, significant capex, sharp rise in promoter holding, etc. Such clustering itself could throw up lots of ideas. Companies coming out of long period trouble could have clustering of improving performance. Similarly, companies with long period of good performance can have clustering of trouble. STABILITY BREEDS INSTABILITY.
Pls find attached presentation made at VP, Goa Meet. Hope its useful. Thanks. Couple of slides, I had to remove due to size.
Clustering Presentation2.pptx (2.9 MB)