Myself and Abhishek Basumalik presented on Technicals for long term investors.
Aim was to sensitise long term investors on the use of technicals for better entry exit decisions. These patterns and parameters can often be used to screen for stock ideas to dig deeper and try and find fundamental picks.
Unless and until the market agrees with us, its not possible to make money and thats what the essence of combining technicals (to some extent) to fundamental analysis.
Please find attached the presentation.
disclosure: This presentation may contain some examples to explain the various patterns and should not be construed as recommendations. It is only for learning purposes.Technical Analysis For Investors.pptx (2.0 MB)
Also i find Guppy on weekly, a good indicator for investors. Entry points are the uptrend (Short term MA’s above Long term MA’s) and exit when downtrend starts (Long term MA’s above Short MA’s). I see Guppy being used by you from the attached PDF. Can you share your insights on Guppy?
Of course agree that 90% is fundamental and 10% technical
GMMA - guppy multiple moving averages employs two sets of moving averages. The short term moving averages are from 3 to 15. usually 3,5,8,10,15
Long term moving avgs 30 to 60 period exponential moving averages. usually 30,35, 40, 50, 60.
One can change the value of these moving avgs within these ranges.
Idea is to divide the trend into two parts. The longer term moving averages signify the long term “investors” and short term depict “traders”.
The buy signal is generated when the whole bunch of short term moving averages move above long term moving averages and ideally once the long term moving averages also have sorted themselves out with 30 being topmost and 60 at bottom within the bunch. This sets up a trade set up for a buy. Ideal place to put trade is when the short term moving averages are above LT MA and after brief correction the short term MA are compressing and then breaking out in an upward fashion.
The strength of the trend is dictated by the width seperating the LT MA. IF these LT MA are very close its not considered a healthy uptrend. Plus ideally we dont want the short term MA coming into the region of upward moving LT MA. Even during short term corrections, the short term moving averages should compress and finally move up slightly above the LT MA group. This signifies strong trend.
The other use of this method is to better visualise some typical patterns like cup and handle, double bottom, inverted h&s, etc as here the whipsaws are taken out and the chart assumes a much smoother appearance.
You can google guppy multiple moving averages book and usually its a free download.
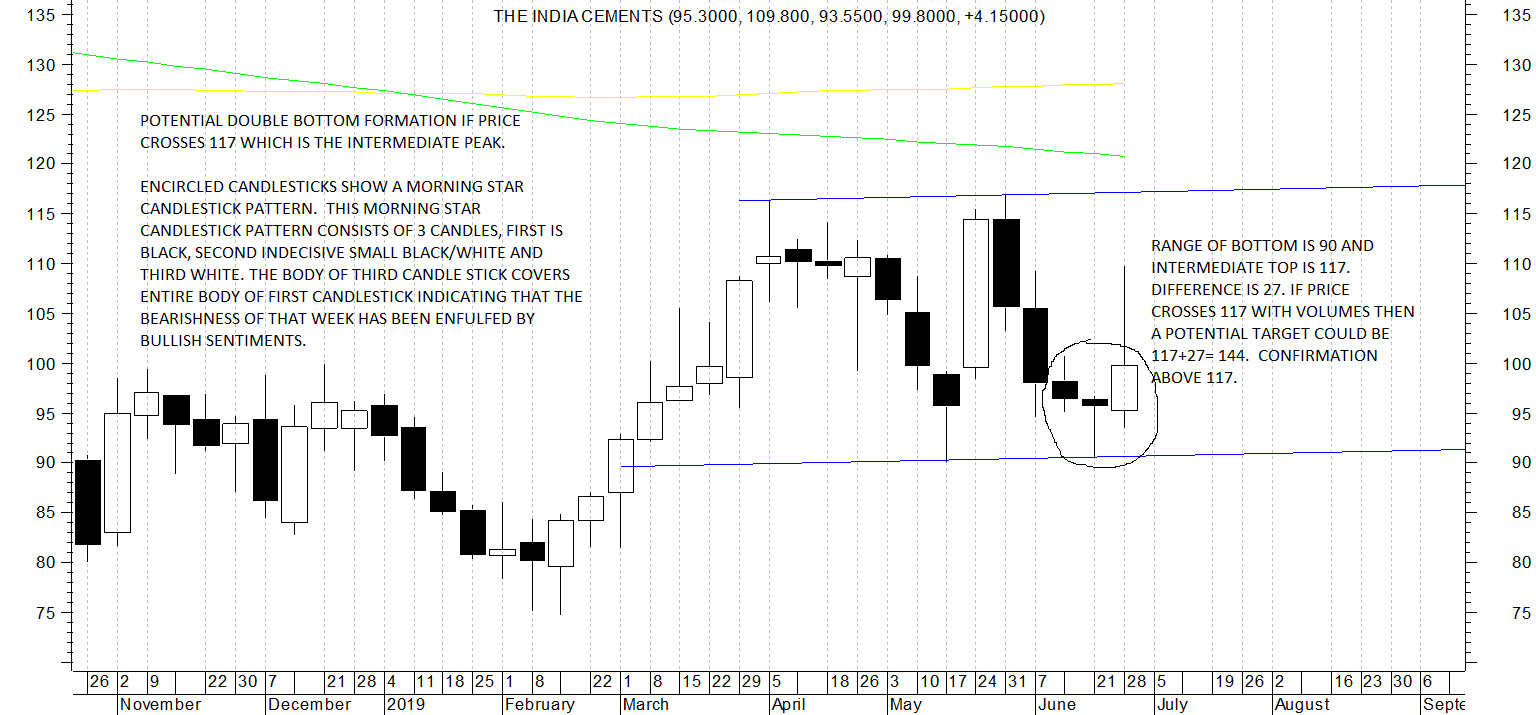
Continuing with examples of patterns mentioned in the presentation, attached chart of India cements where a possible double bottom can occur if stock price closes above 117 on weekly time frame. cmp 99. (disc: small tracking position to test the hypothesis with a stop loss of 93 which is just below weekly low)
Also mentioned morning star candle stick pattern. Anyone interested can google morning star candlestick and read the definition/explanation and try to correlate with the chart observation.
Thanks Hitesh. Very interesting thoughts on how technical analysis benefits long term investing. I have couple of questions.
How do we choose between weekly charts or daily charts if i am still looking for medium to long term trends with different types of technical parameters?
Choice between exponential moving average and simple moving average - will it make any significant difference while analyzing same parameters/trends. Or is there any specific parameter/trend when one of these should be used over other.
How do you normally approach identifying the stocks with particular trends? Is it some analysis type based alerts or you have some shortlisted set of stocks whose charts you manually monitor frequently? I personally feel this is the most challenging aspect to have an efficient way of getting to know about a trend in a particular stock being relatively passive investor.
@hitesh2710 Bhai, Thanks very much for sharing your wisdom with us here.
Using technical analysis in conjunction with fundamentals for investing purpose fascinates me, but have never been able to pursue lot of things due to lack of time. It was your posts on VP which introduced me to this concept and I definitely want to learn more because I end up getting into certain stocks too early and also somehow end up getting into turn around stories quite often, and both these things lead to lot of opportunity costs!
Till the time I am able to devote much time to it, I get excited by your posts and end up trying to apply these patterns to certain stocks (mostly to stocks I own - Camlin being one of them).
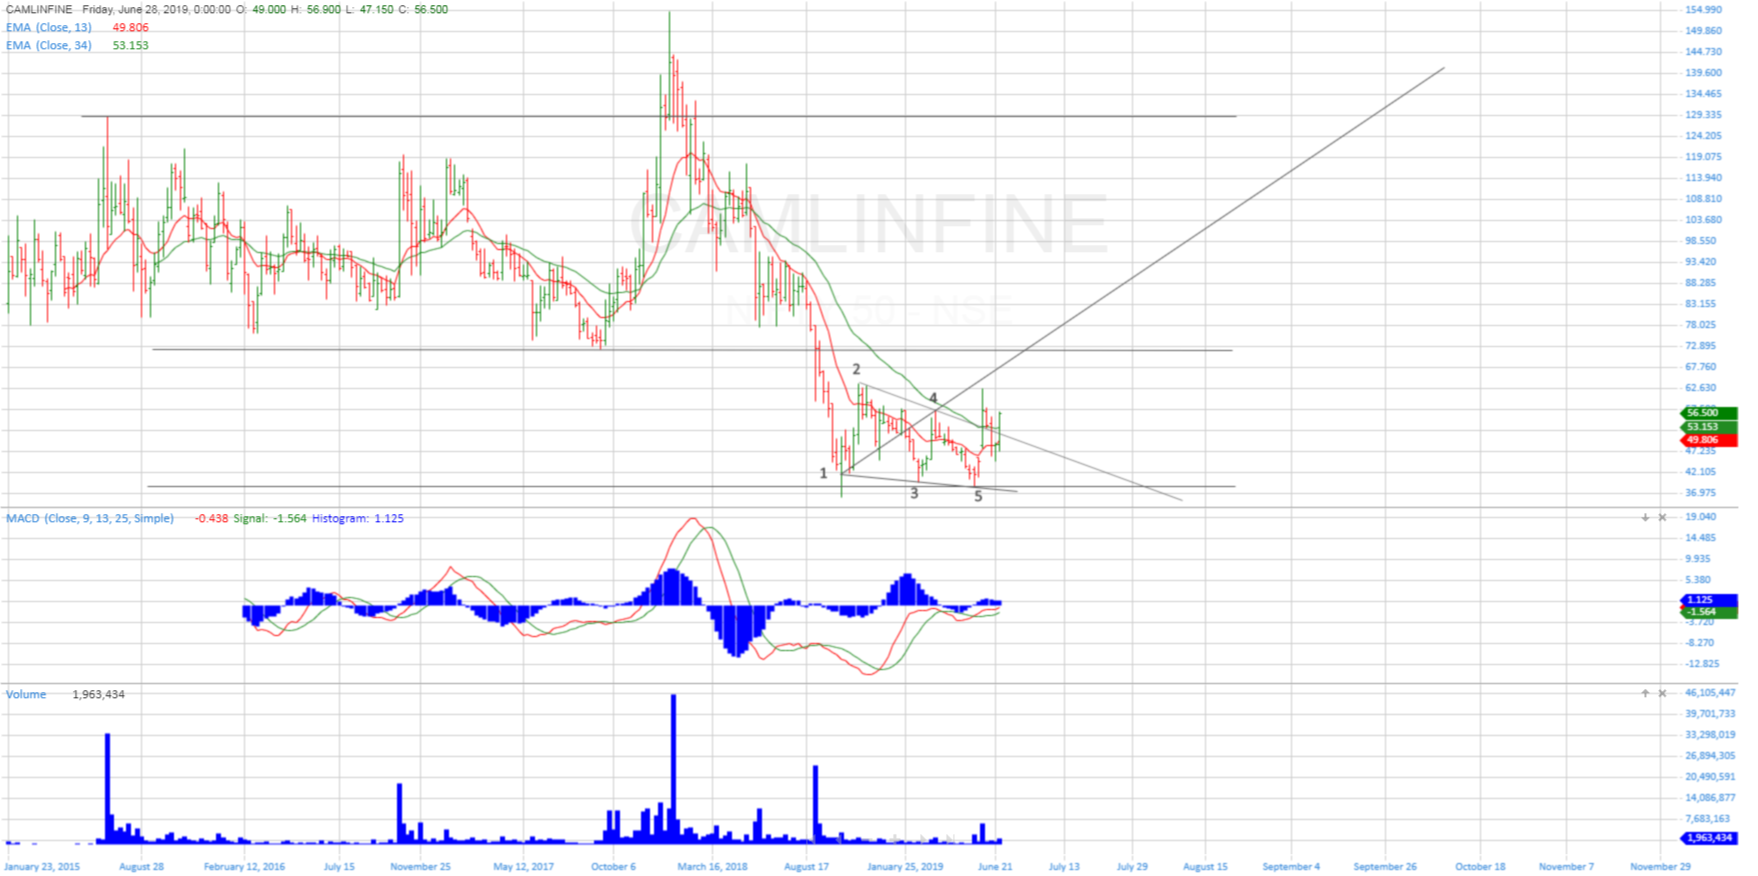
In the attached chart of Camlin Fine Sciences am I correct in seeing a WW pattern and a double bottom pattern?
Ideally for medium to long term the charts to look are weekly or monthly time frames. Daily would help in precise entry point if there is anything specific in the daily charts. e.g Stock consolidating above 200 dma or above other support zone or breakout from a small tight range or something similar. We can also see if on daily charts the stock is overbought or oversold etc, though I dont attach too much significance to these momentum indicators except to see divergences.
Choice between simple and exponential moving avgs – Usually exponential moving avgs are more preferred by analysts.
There is no specific method on how to identify stocks with particular trends. Usually while looking up and reading details about good companies guides me to charts. If I find something specific on charts it intensifies my interest. Sometimes its the other way around. If stock price on a chart starts showing strength I get interested and try to read annual reports, and lilsten to concalls if available. e.g There is the transfer of consumer products from tata chemicals to tata global. I tried to figure out which one is the better choice. Each tata chem shareholder gets 1.14 share of tata global plus the residual businness of tata chemicals. I tried putting in rough figures but could not make much headway so thought about watching tata global instead. It has moved up in past few weeks but if it cools down and comes to consolidate around some support range I would consider looking at it.
Good spot on the chart of camlin fine science. It is an example of wolfe wave. Target is in range of around 70 on daily/weekly chart. These targets are usually minimum targets if pattern is successful and can often be exceeded.
Ideal thing post successful breakout is to trail stop loss at a convenient place e.g 40 or 50 day moving avg or some weekly moving average which we find works well for placing stops.
Thanks Hitesh for the clarification. Really helps.
Regarding:
“If stock price on a chart starts showing strength I get interested” - Do you use any technical analysis live tools which give alerts on specific parameters or trends to find these stocks? or is this a manual exercise ?
Thanks Hitesh for the info.
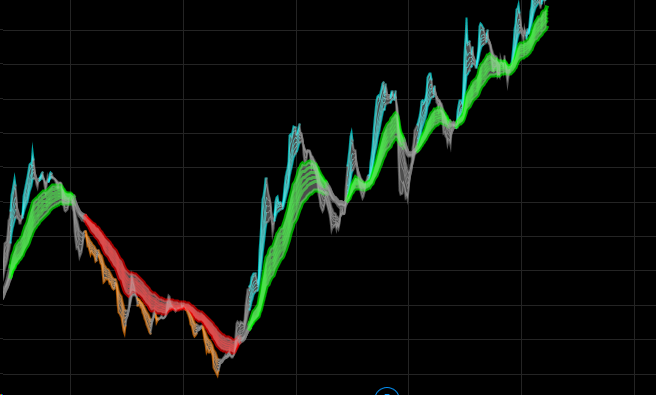
To add some more info I am using a programmed Guppy on tradingview. The Blue for short term MA’s and Green for Long terms MA’s if the lesser one is above the higher one. This indicates a buy. The reverse for Orange and Red (Sell indication). The Grey one’s indicate the MA’s are confused : ) (neither in uptrend nor in downtrend)
Hitesh,
Can you suggest the software that you use for Technical Analysis? We as investors don’t require live data (EOD or weekly should be enough).
I am currently using TradingView but the querying capability to scan stocks is limited. Looking for a low cost software which has some querying capability (like query all stocks on Guppy, lower MA > Higher MA).
I am using “chartink” to query. Then i analyze the list and pick some which i know and in my COC and then do Fundamental Analysis. If a low cost charting software does the job then it would save time
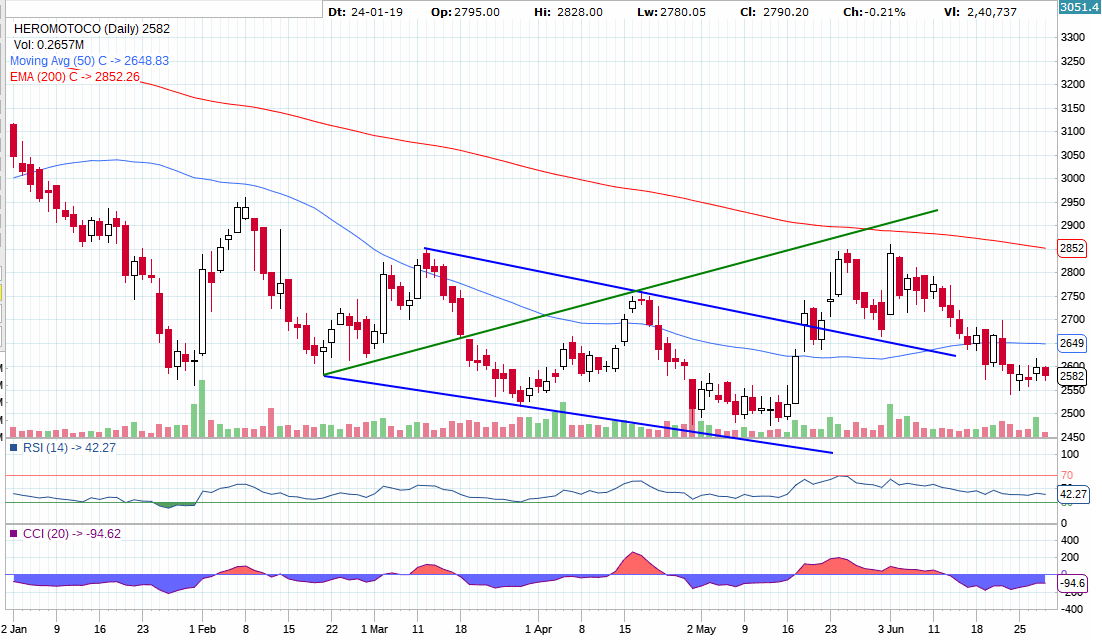
Hero had formed WW and tgt nearly achieved. In these kind of formation even though target line may not be touched one can take some money off the table to lock in atleast some profits
Thanks Hitesh. Since upper and lower bands were not converging soon (Blue lines) I had doubts if the price action could be considered as target price or the pattern is conclusive. So I take that the price crossing the green line as the first target price and convergence of the blue line may not be always mandatory to determine the possible target prices.
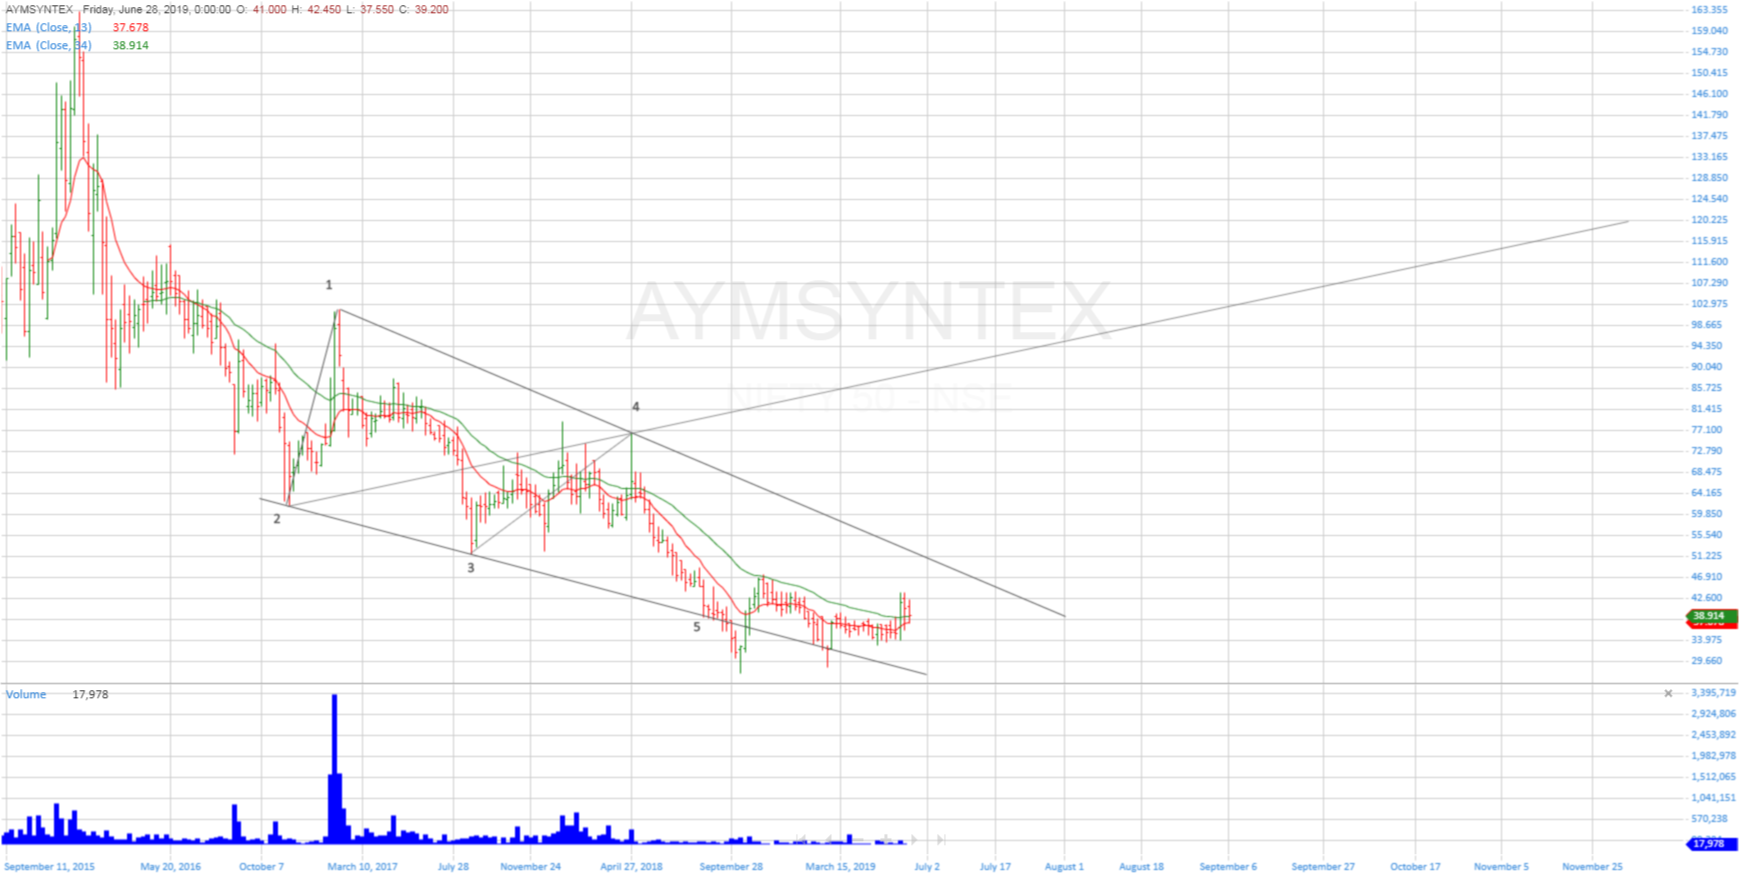
I guess the same pattern is visible in one of my other patience testing holdings Aym Syntex as well. Will learn more about such reversal spotting patterns. I had gone through your presentation, but are their any other similar reversal spotting patterns that you might suggest to read up on?