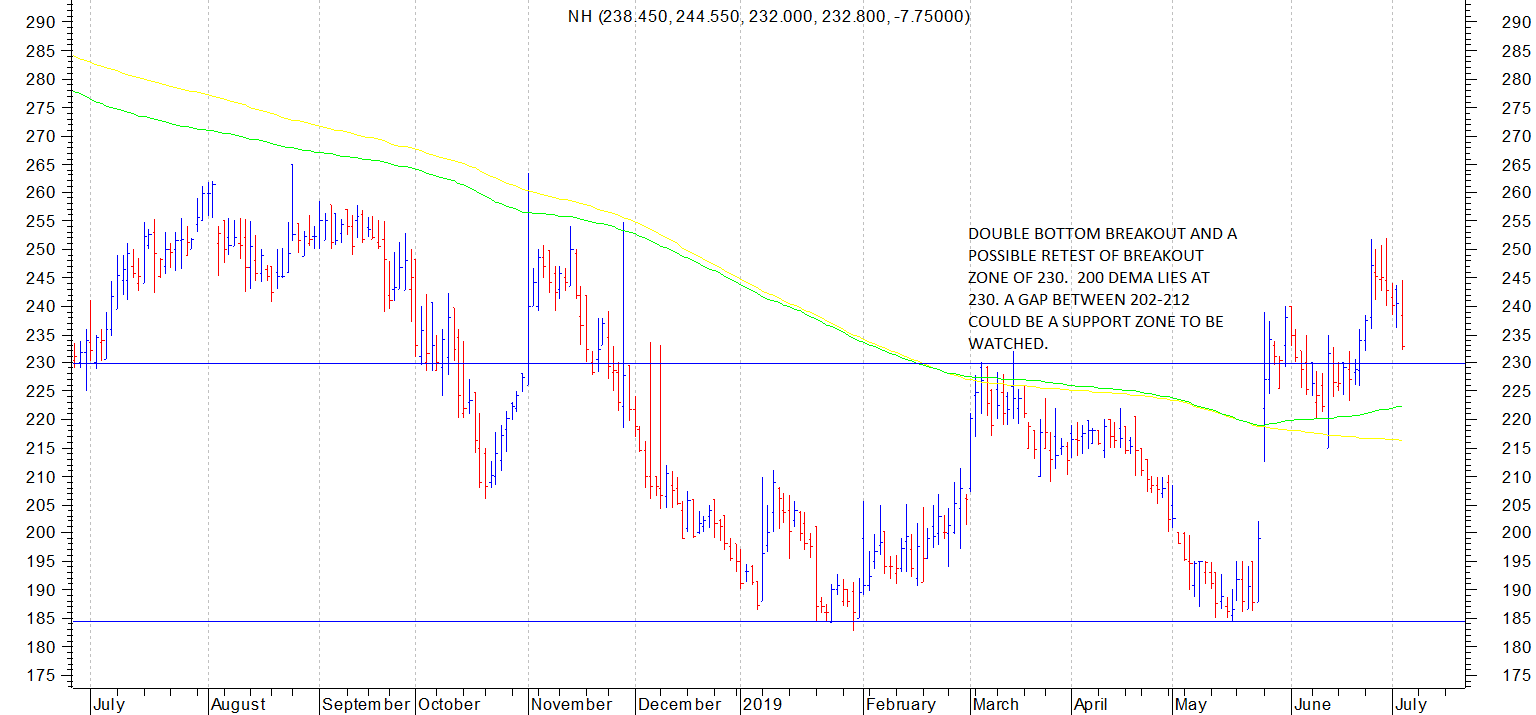
Apollo Hospitals chart was discussed in the presentation at VP goa 2019 meet and chart details were put up. Another company from same sector Narayana Hrudyalaya had some time back broken out of a double bottom above 230. Now after posting a swing high of 251 stock is correcting and now looks like testing the breakout level of 230. 200 dema around 222 could be a good level to watch out for support. Yet another level as mentioned on the chart is a big gap up zone of 202-212 which could offer good support if stock goes to that zone. Ideal thing to do in such situations is to wait for the short term correction to run its course and once stock starts moving up, buy it if convinced about the fundamentals of the company. Two leading companies of same sector making bullish patterns makes it an interesting space to watch out for.
disc: no positions in apollo or NH as of now. Under watchlist.
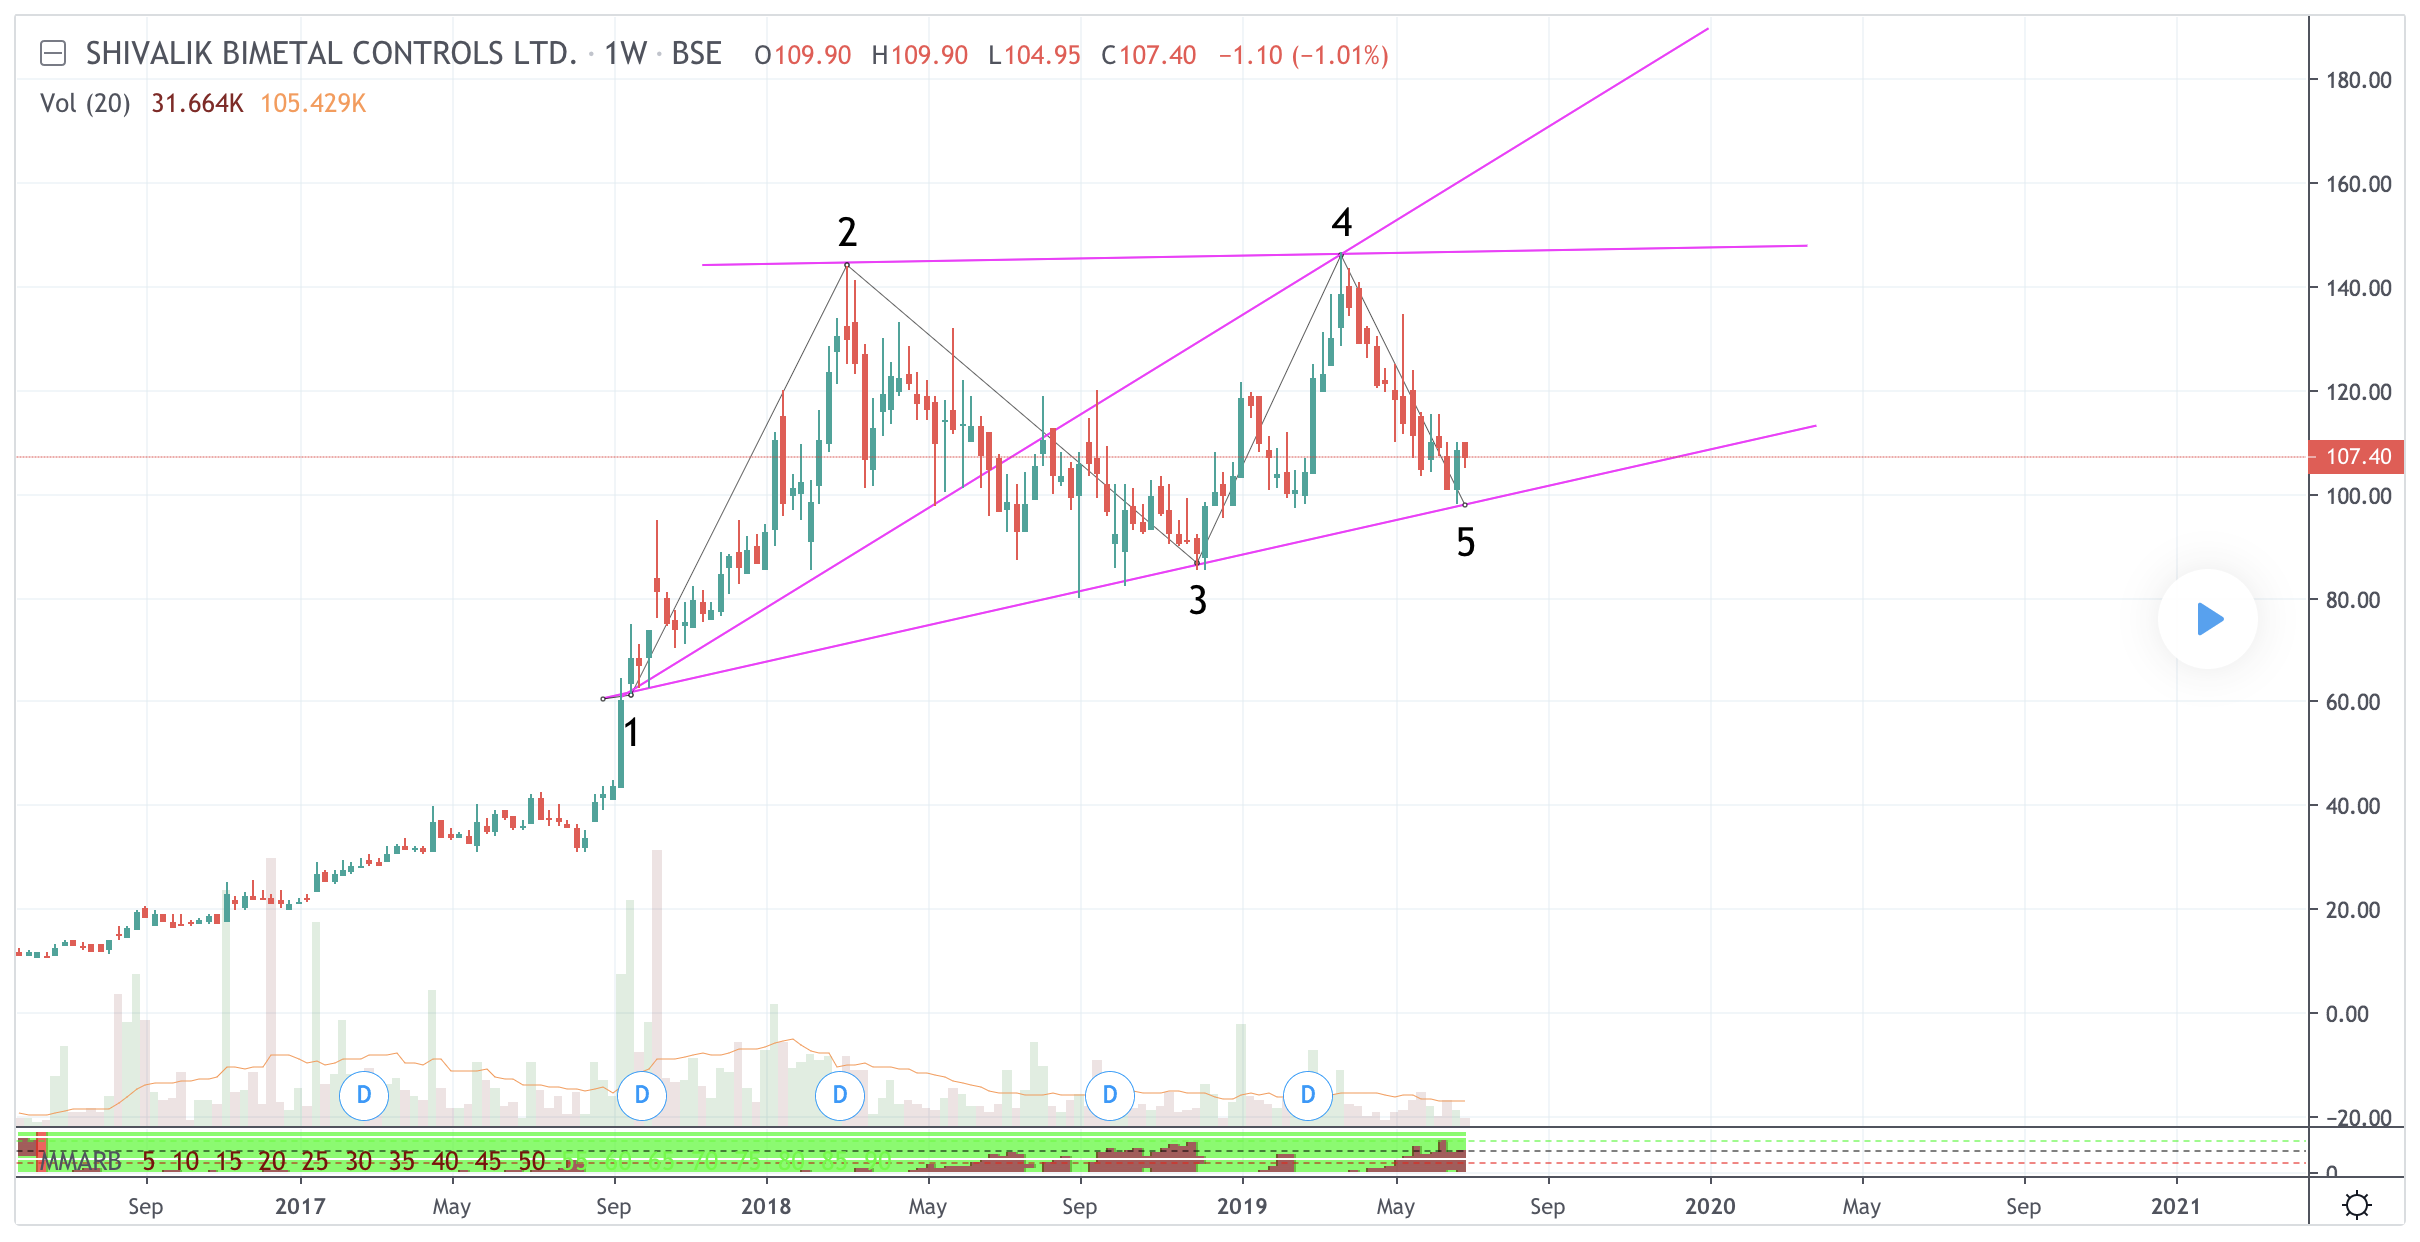
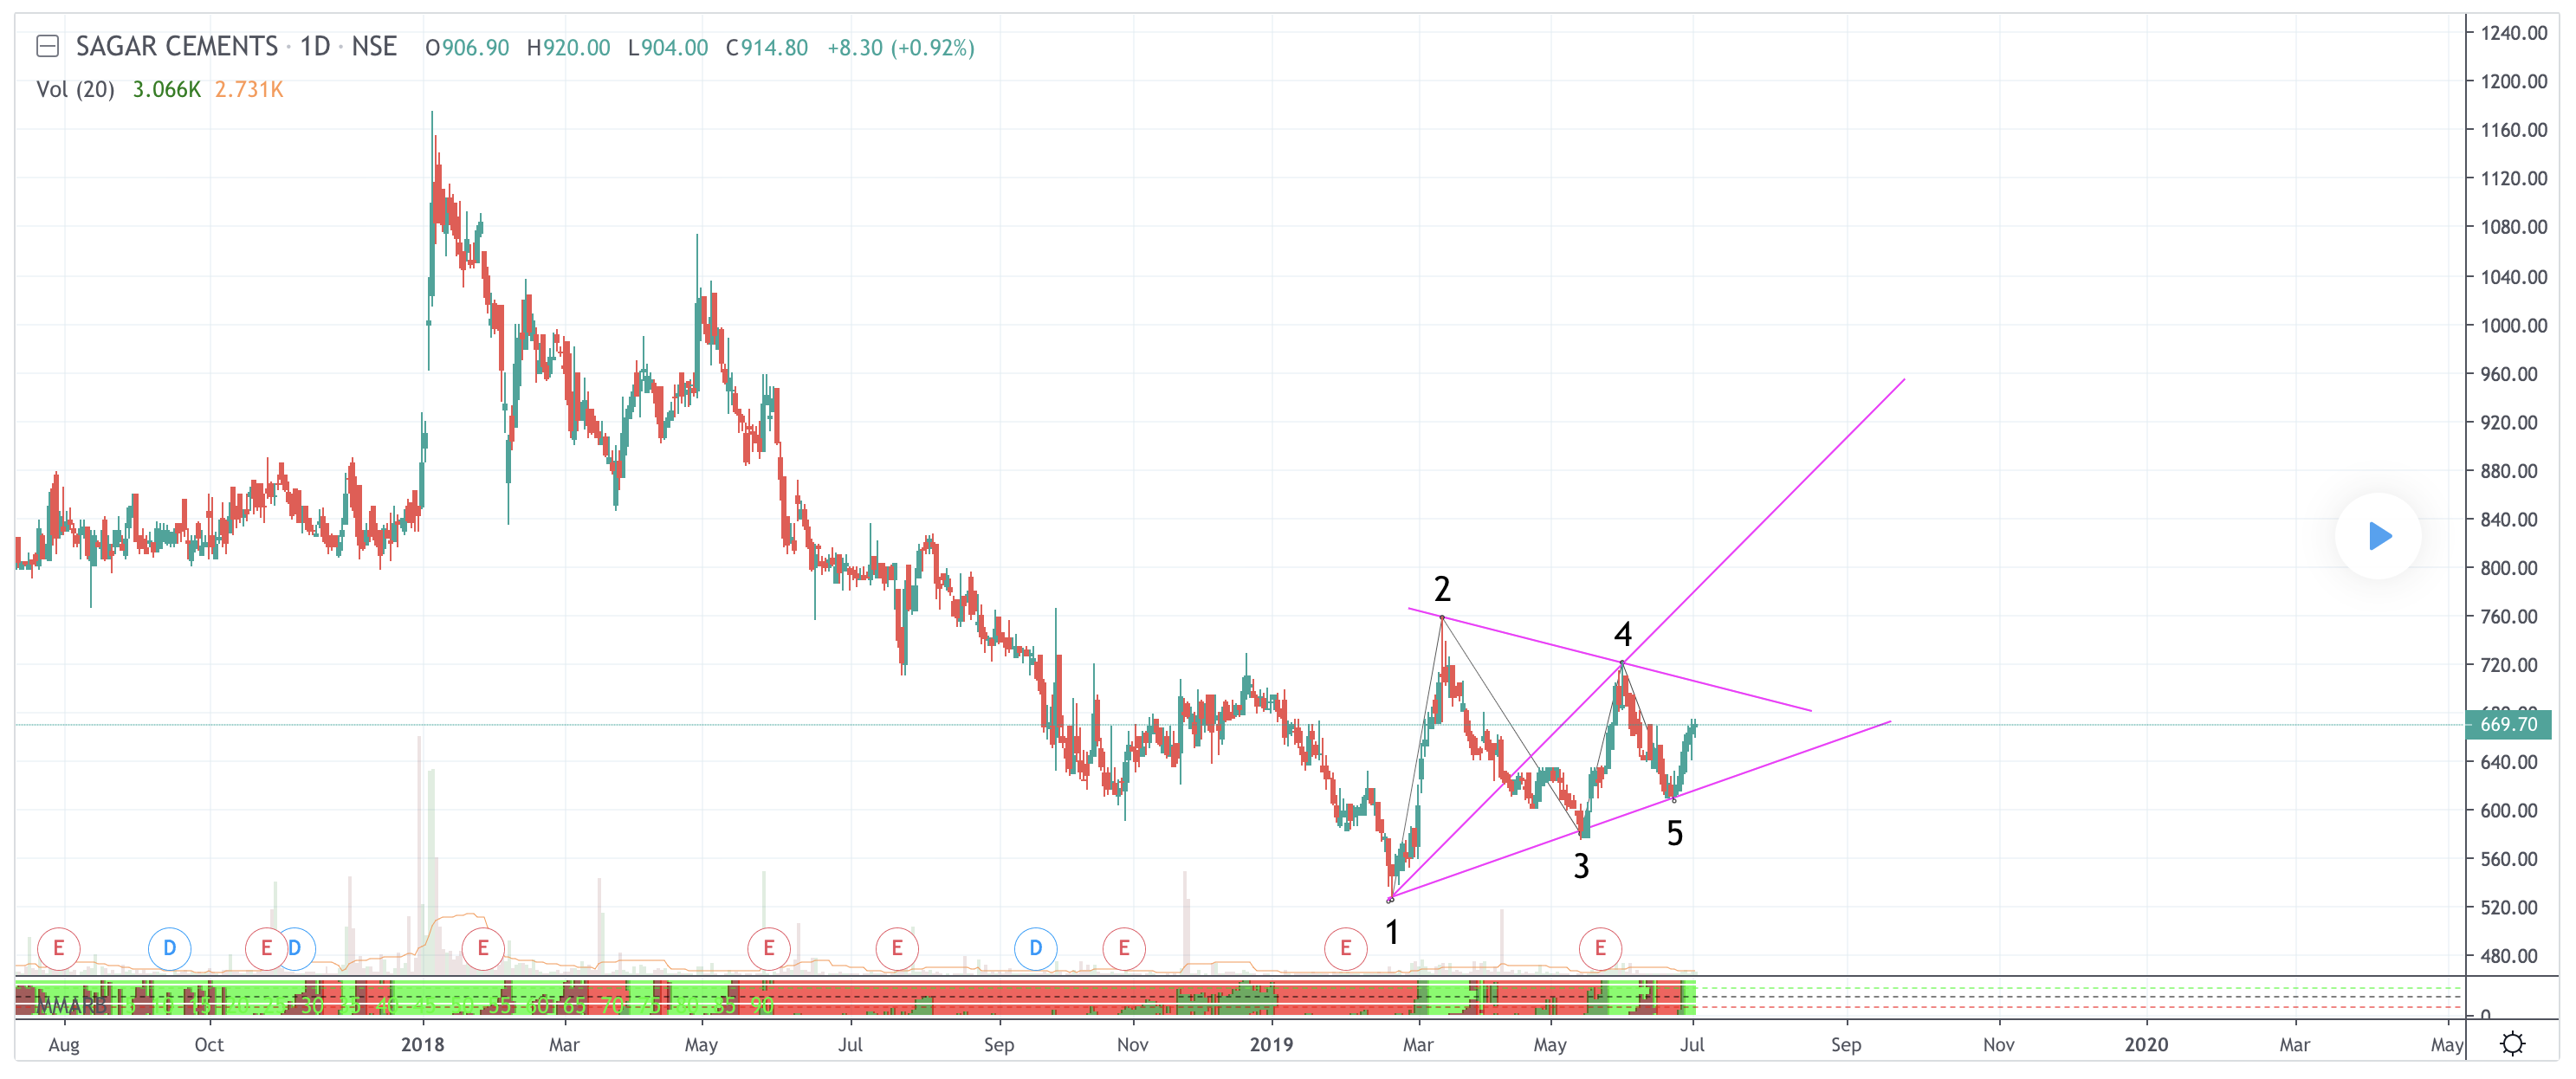
Side note: After the bounce from February lows, a lot of cement stocks are moving in sideways, but sagar cement corrected and made this pattern. Guess, one can form a basket approach in this sector.
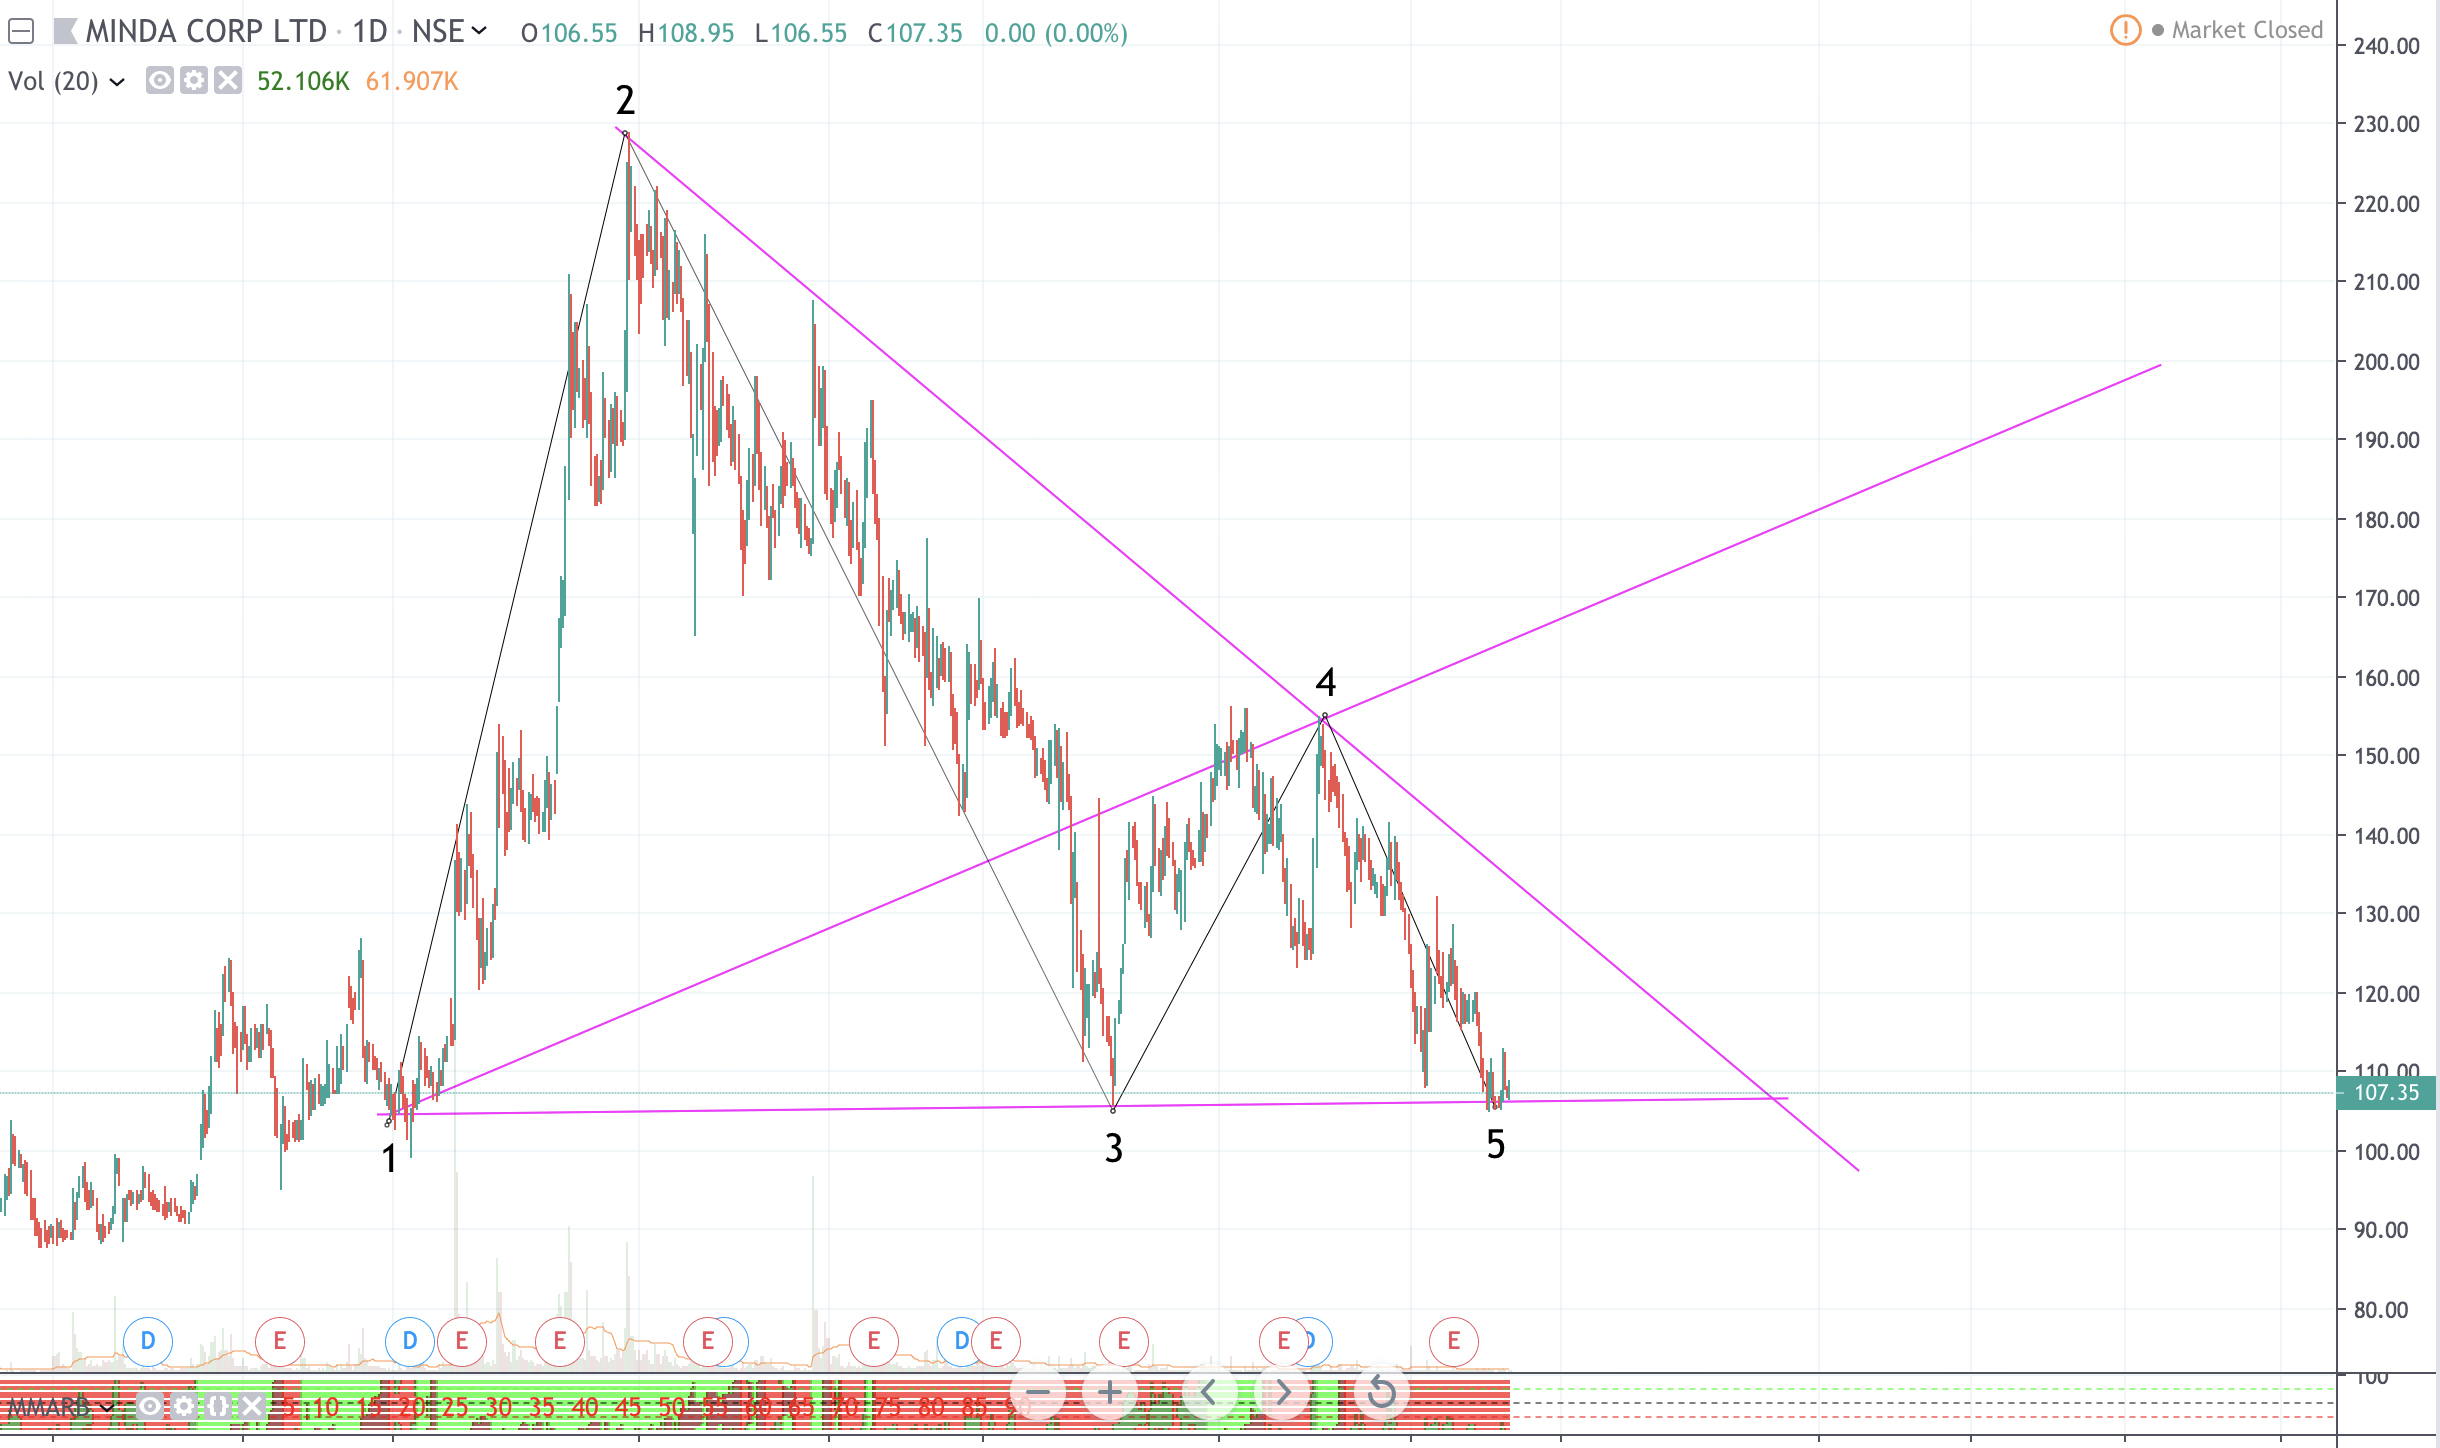
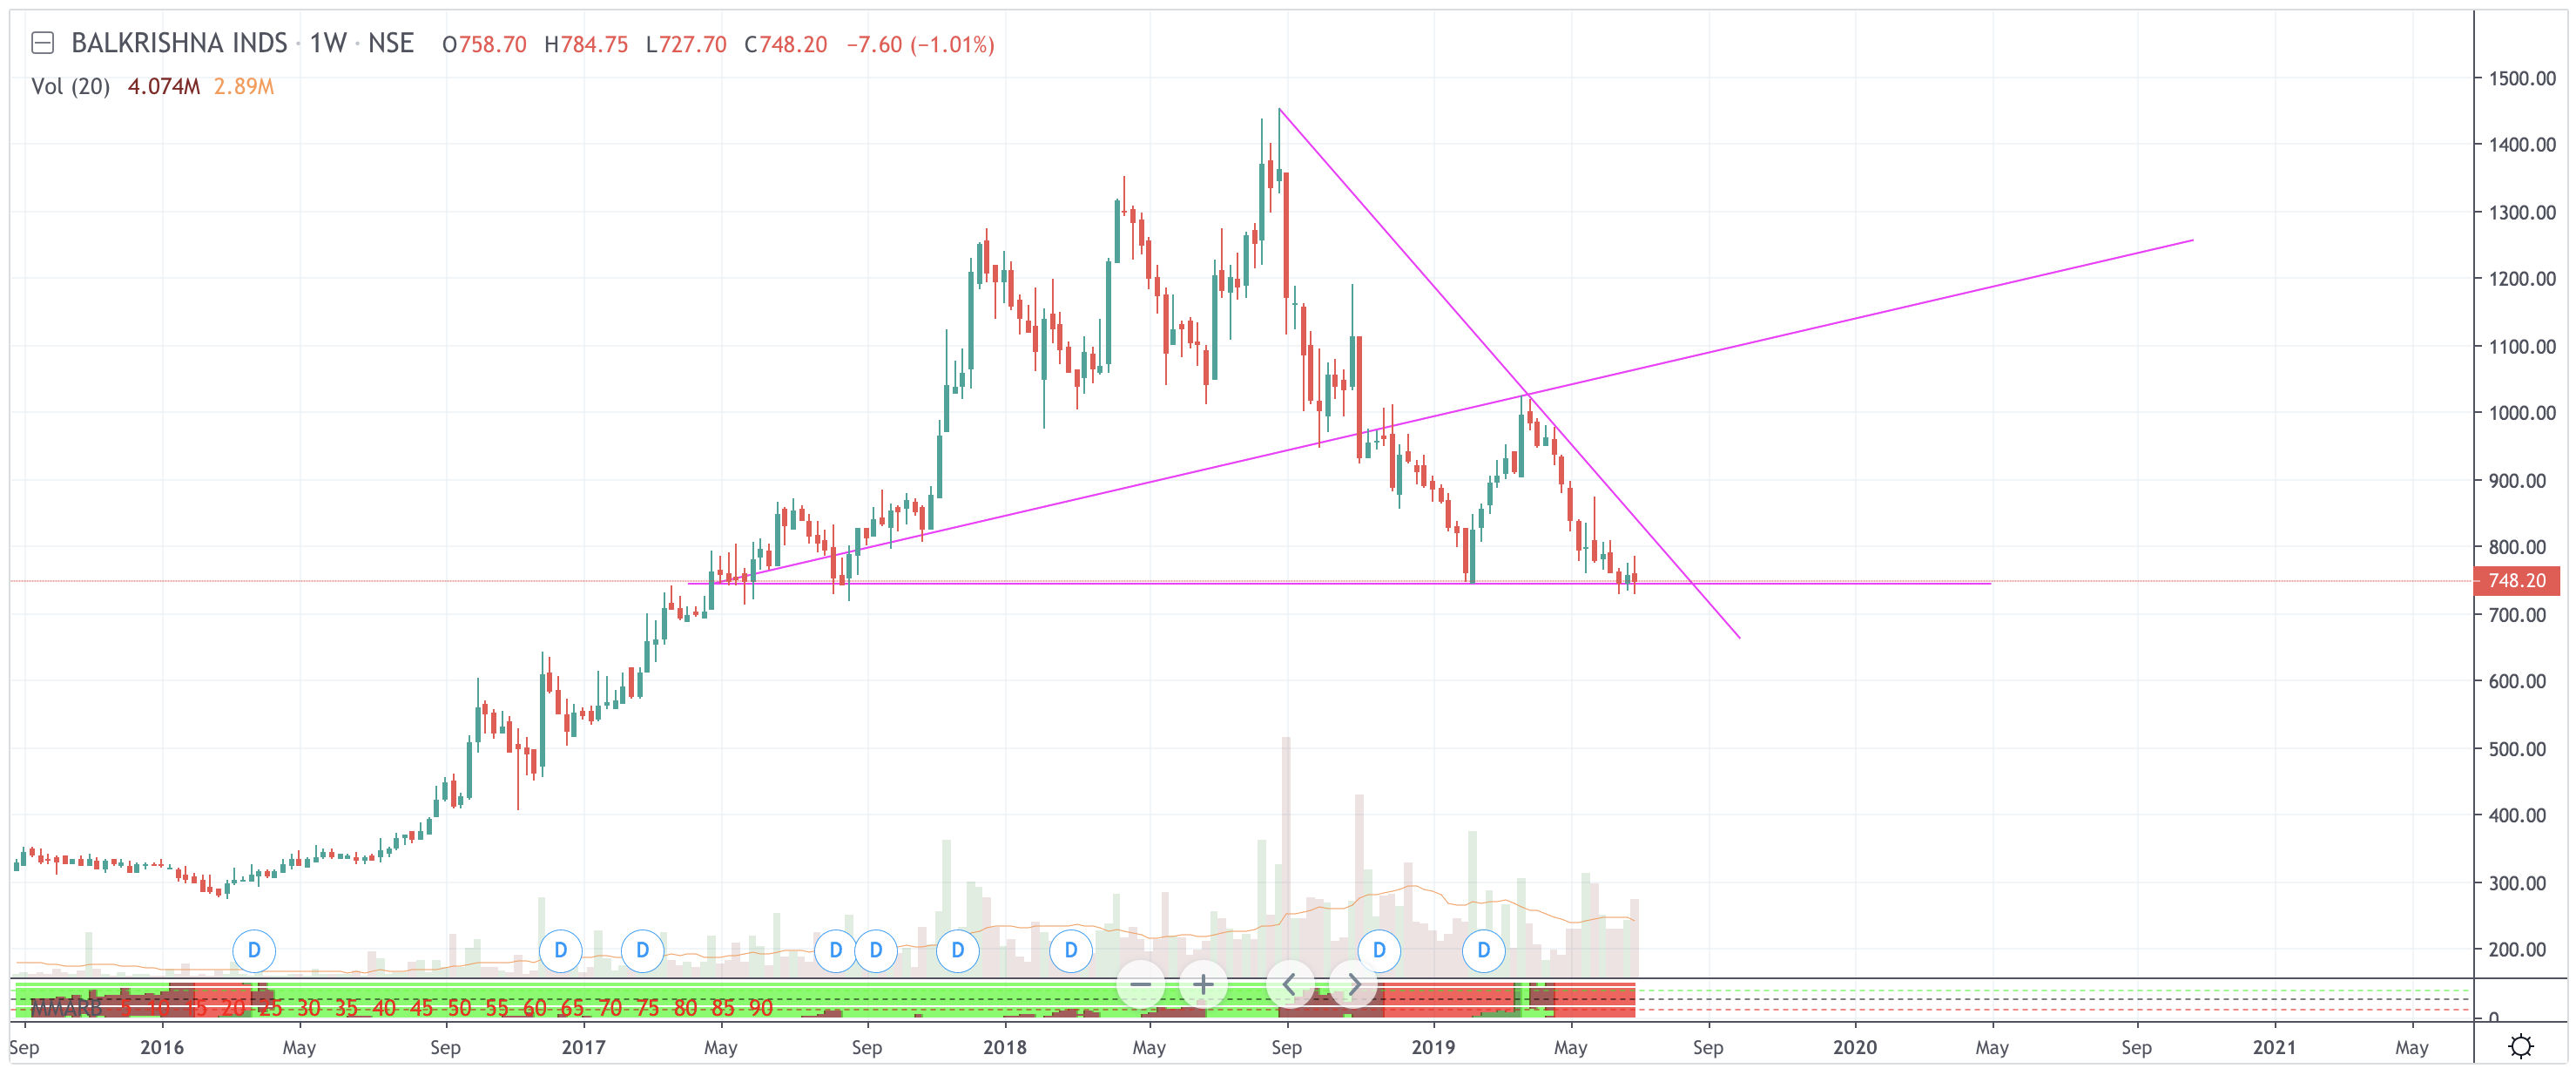
Can the following (Minda corp & BKT) chart a valid one? Have observed most of the wolfe wave examples are much similar to channels or wedges (slightly triangular). But as far as this chart is concerned the rules are matching: a triangular chart, with which consists 5 waves, but the correction is steep. Requesting your guidances in understanding this pattern.
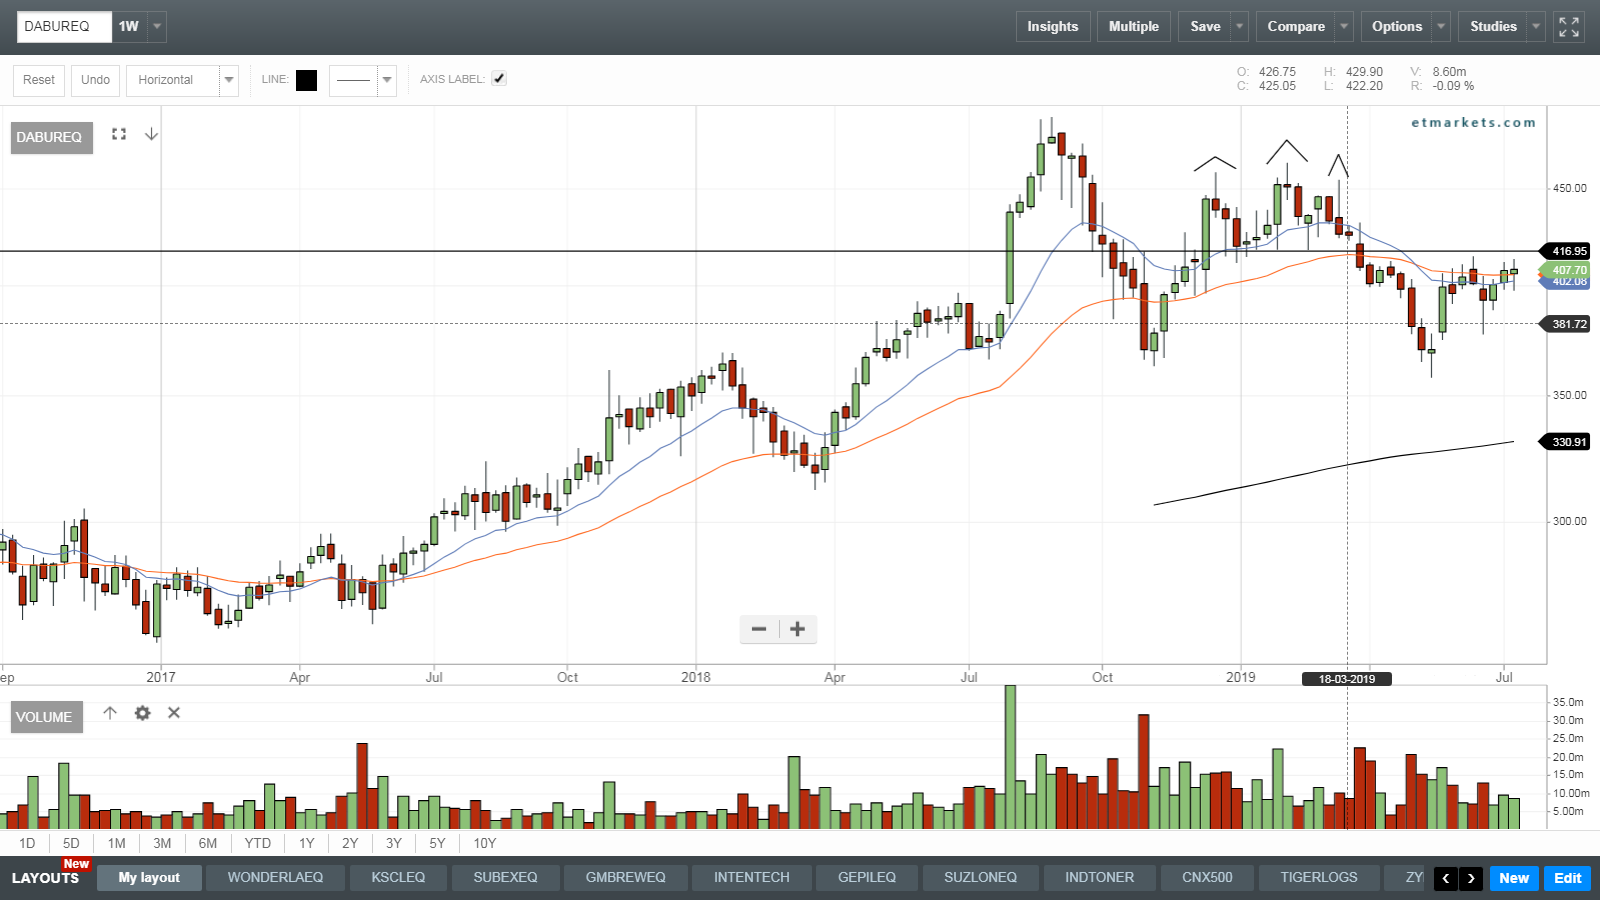
Another query: The bad news are no more affecting some of the good auto & auto ancillary cos, which made double bottoms, can this be considered as bottom ?
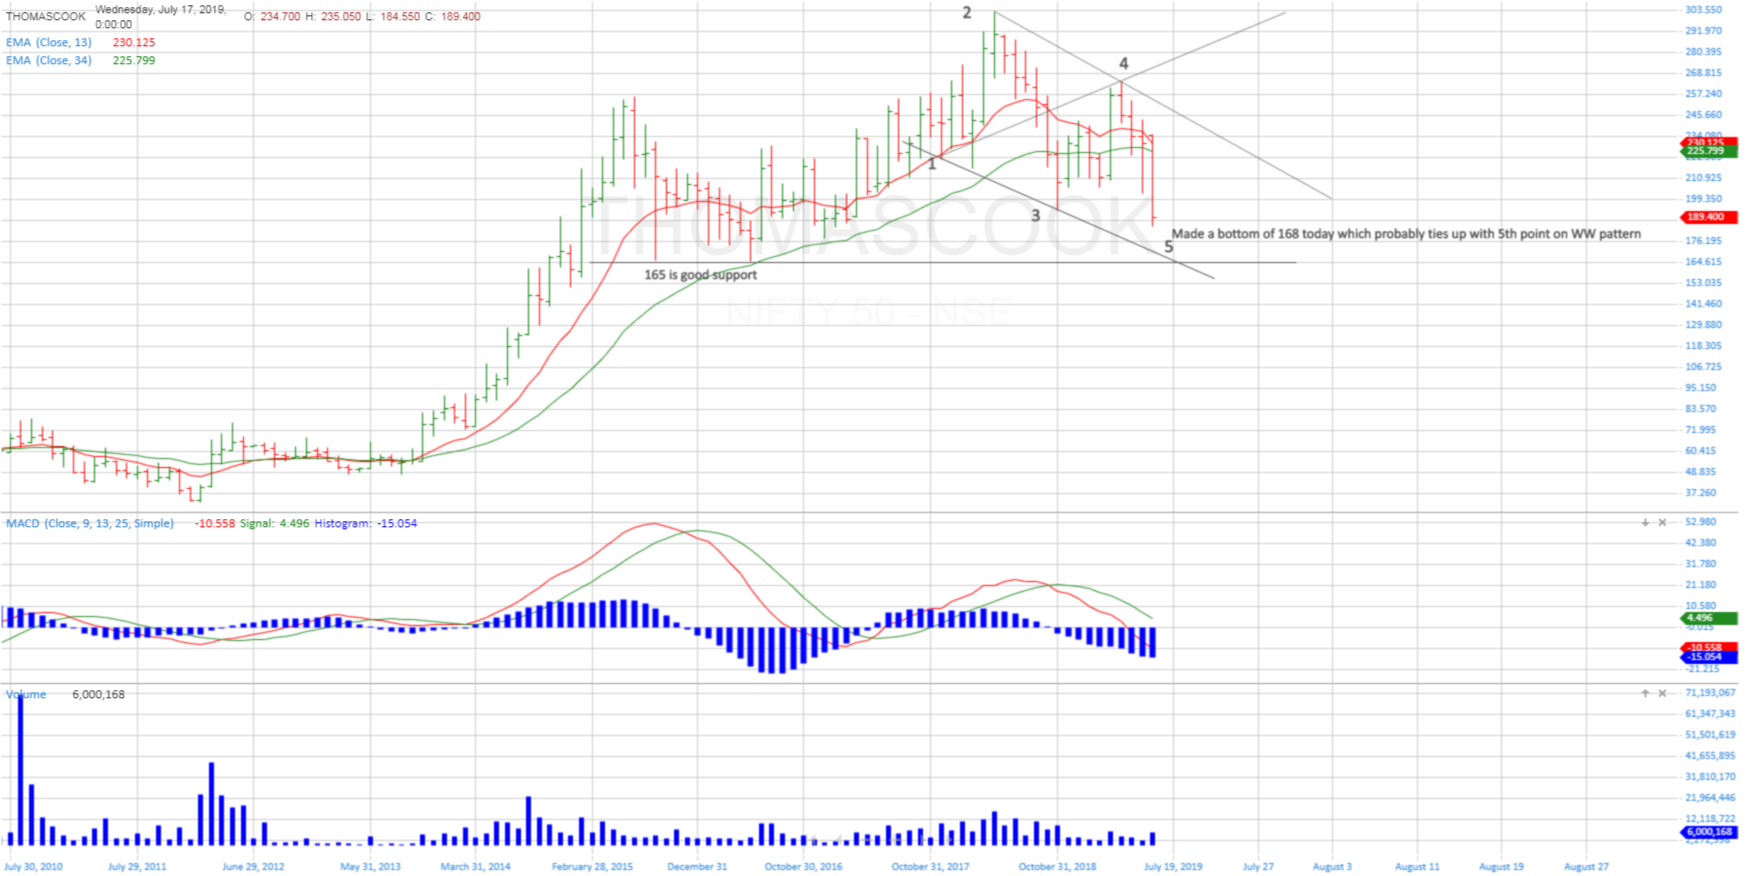
Probable WW pattern in Thomas Cook upon today’s intraday fall.
Relatively safer way to play Quess as well, due to probable arbitrage opportunity as a result of TC shareholders getting 0.1889 shares of Quess for every 1 share of TC.
In a typical Wolfe Wave pattern, the lower line joining waves 1-3-5 is usually sloping down but should not be too vertical. It should be a gradual decline.
The chart of Minda corp among all others posted seems to be the best example of WW though there are often much better classical type of patterns. I will post them as and when I find them.
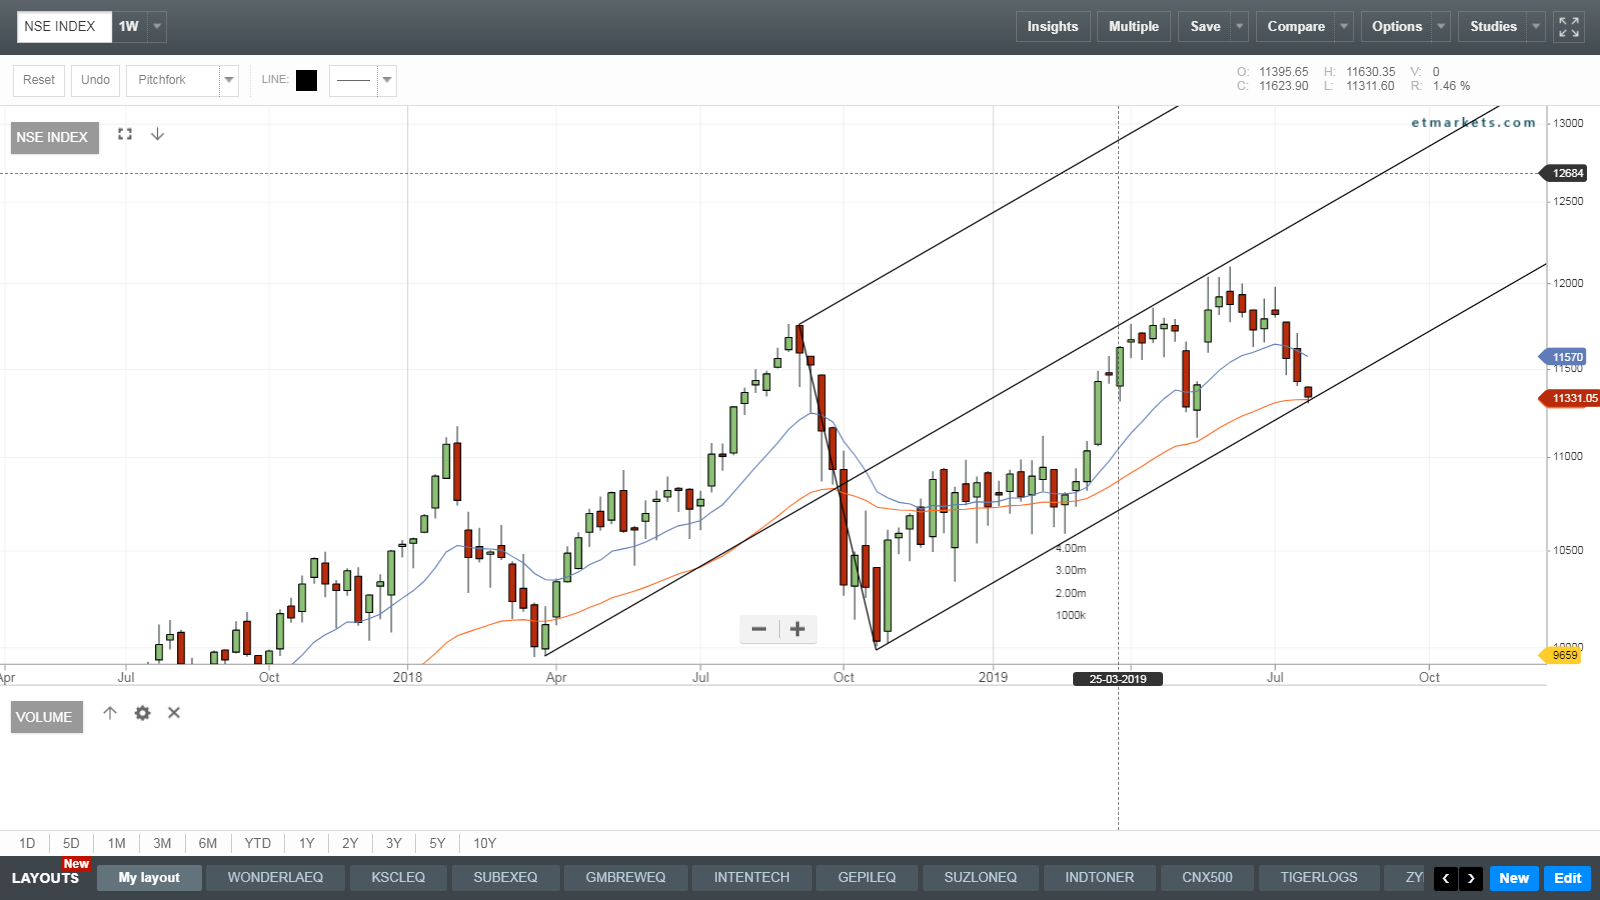
The nifty50 is following a picture perfect pitchfork. The overall market trend IMO is biased upward and the market is hugging the lower channel. Minor concern is inability to break the median line but thats ok.
L&T came out with very good results yesterday with order book rising by 9% and profits rising by 20%. So there is an additional impetus for the market to move upwards.
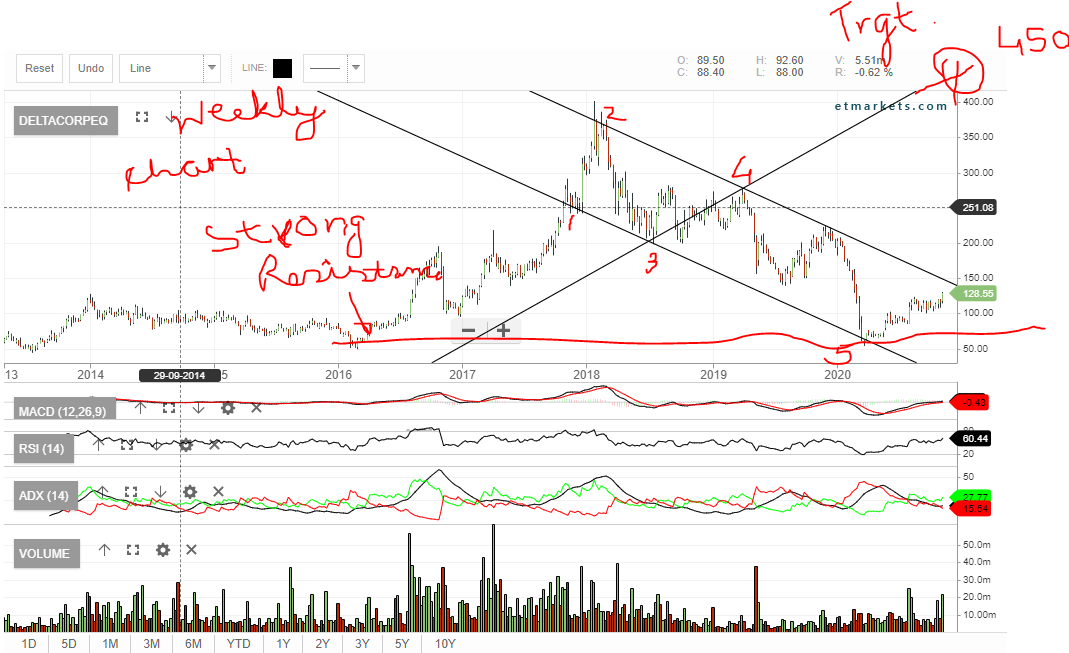
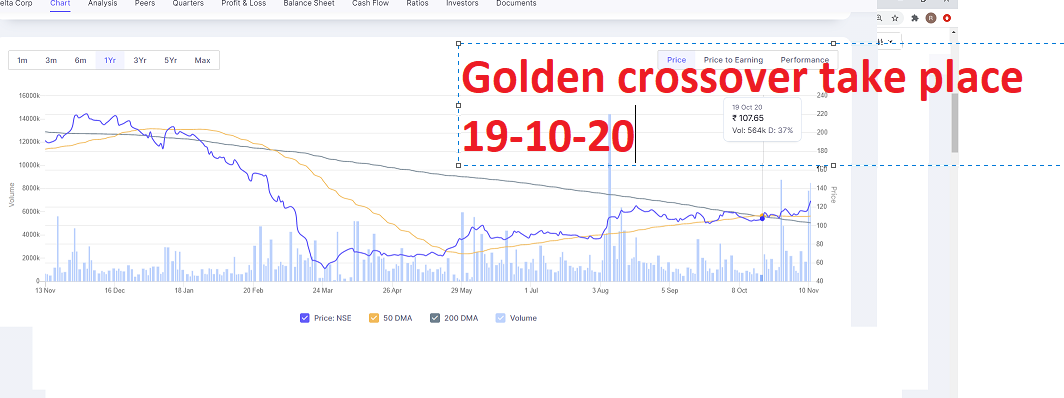
@hitesh2710 s @bheeshma@basumallick Lockdown norms are relaxed and people won’t change their habit too soon I think based on the chart Delta corp is forming a good Wolfe wave . Could you please guide . MCAD signal along with the volume increase also support the belief . Trend in ADX is also positive Chart is weekly on Et market
I don’t follow Delta so don’t know much about it. However, the chart posted here suggests that prices are in a downtrend with lower lows and lower highs. To me, if prices cross 220 levels then maybe there is a case for an upside else the chart is not looking great.