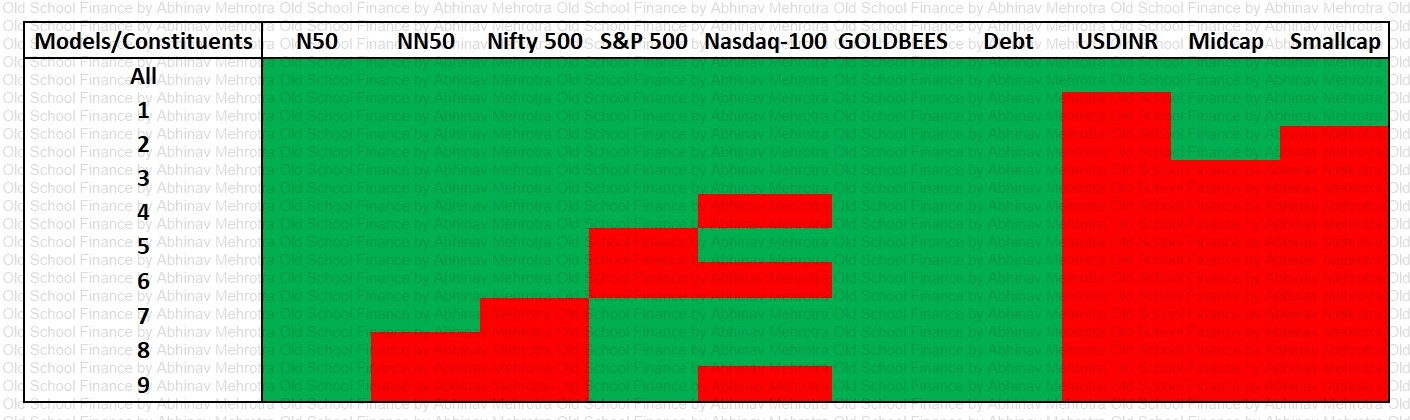
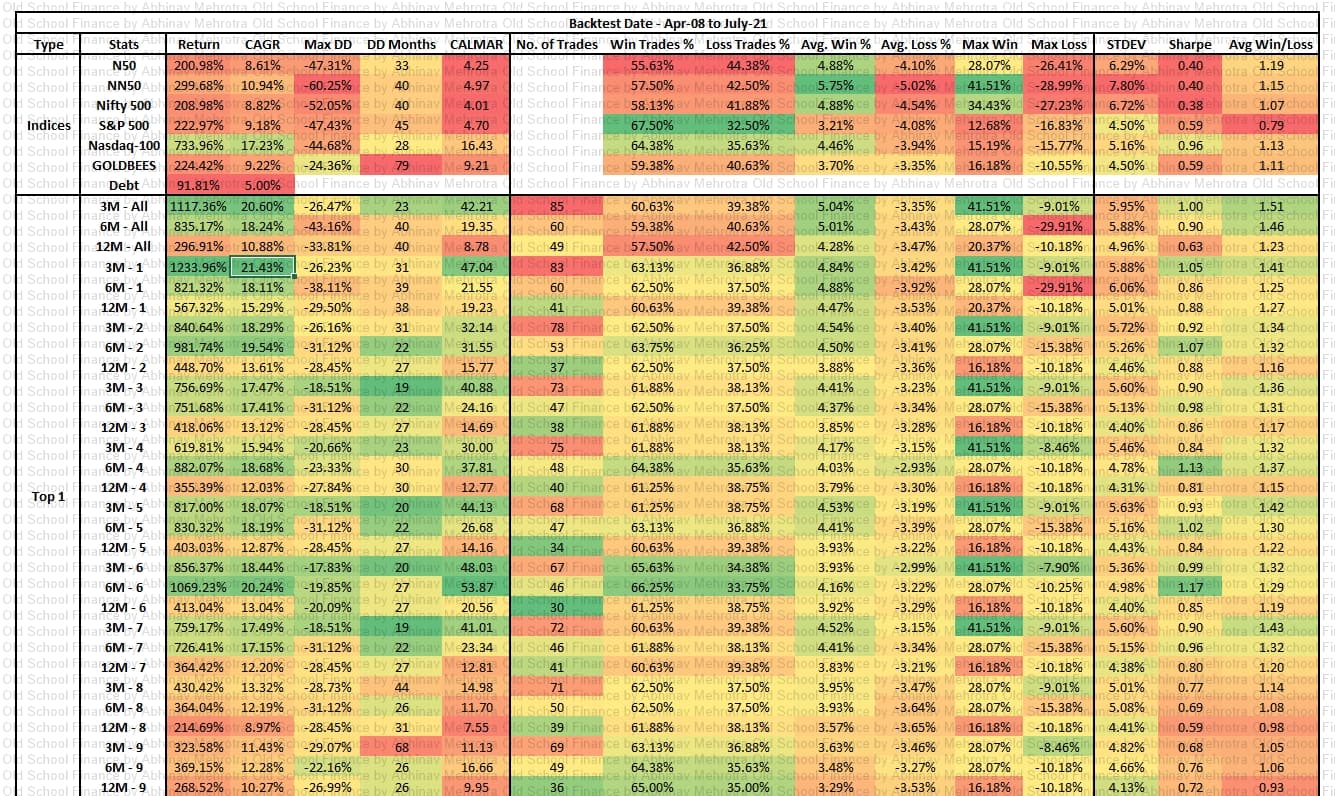
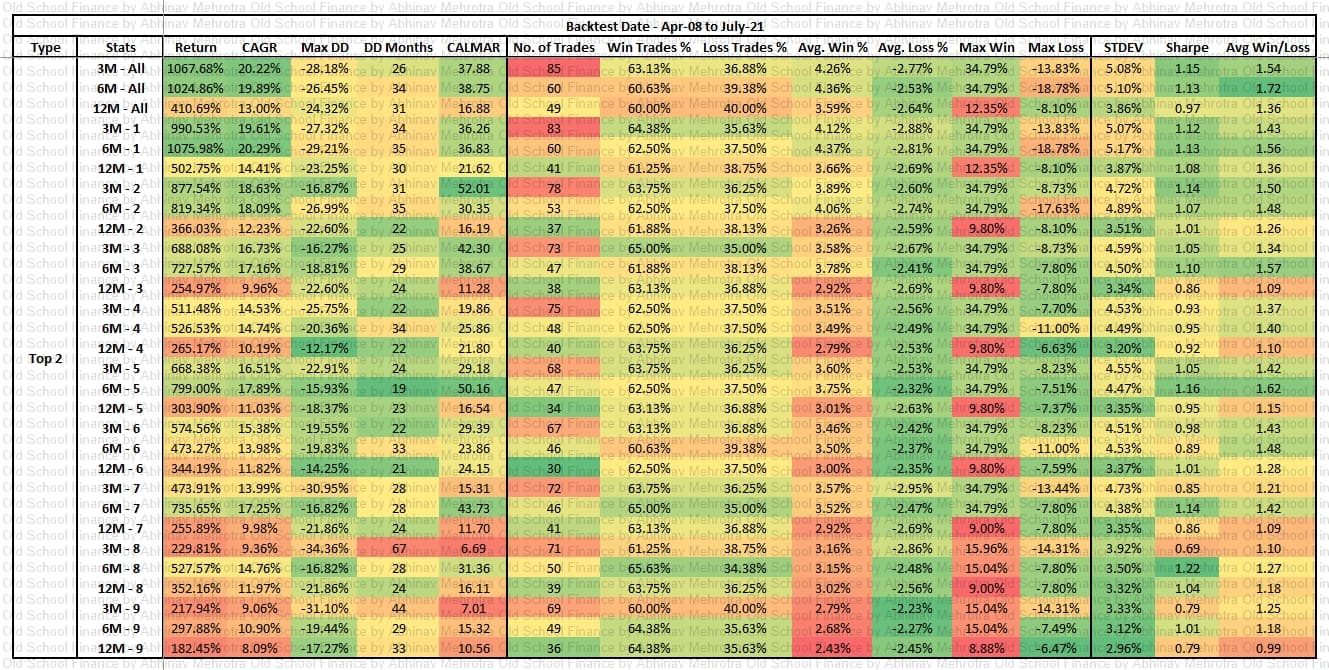
Volume Turnover (T/O) Breakout (B/O) Test PF:
Week 8 - 19th July to 23rd July
NSE:CAMS
NSE:MOTILALOFS
NSE:BSE
NSE:JMFINANCIL
NSE:WELSPUNIND
NSE:MHRIL
NSE:SOBHA
NSE:VTL
NSE:LTTS
NSE:IBREALEST
NSE:SUNCLAYLTD
NSE:ZENSARTECH
NSE:VMART
NSE:CDSL
NSE:WELCORP
NSE:SUNTECK
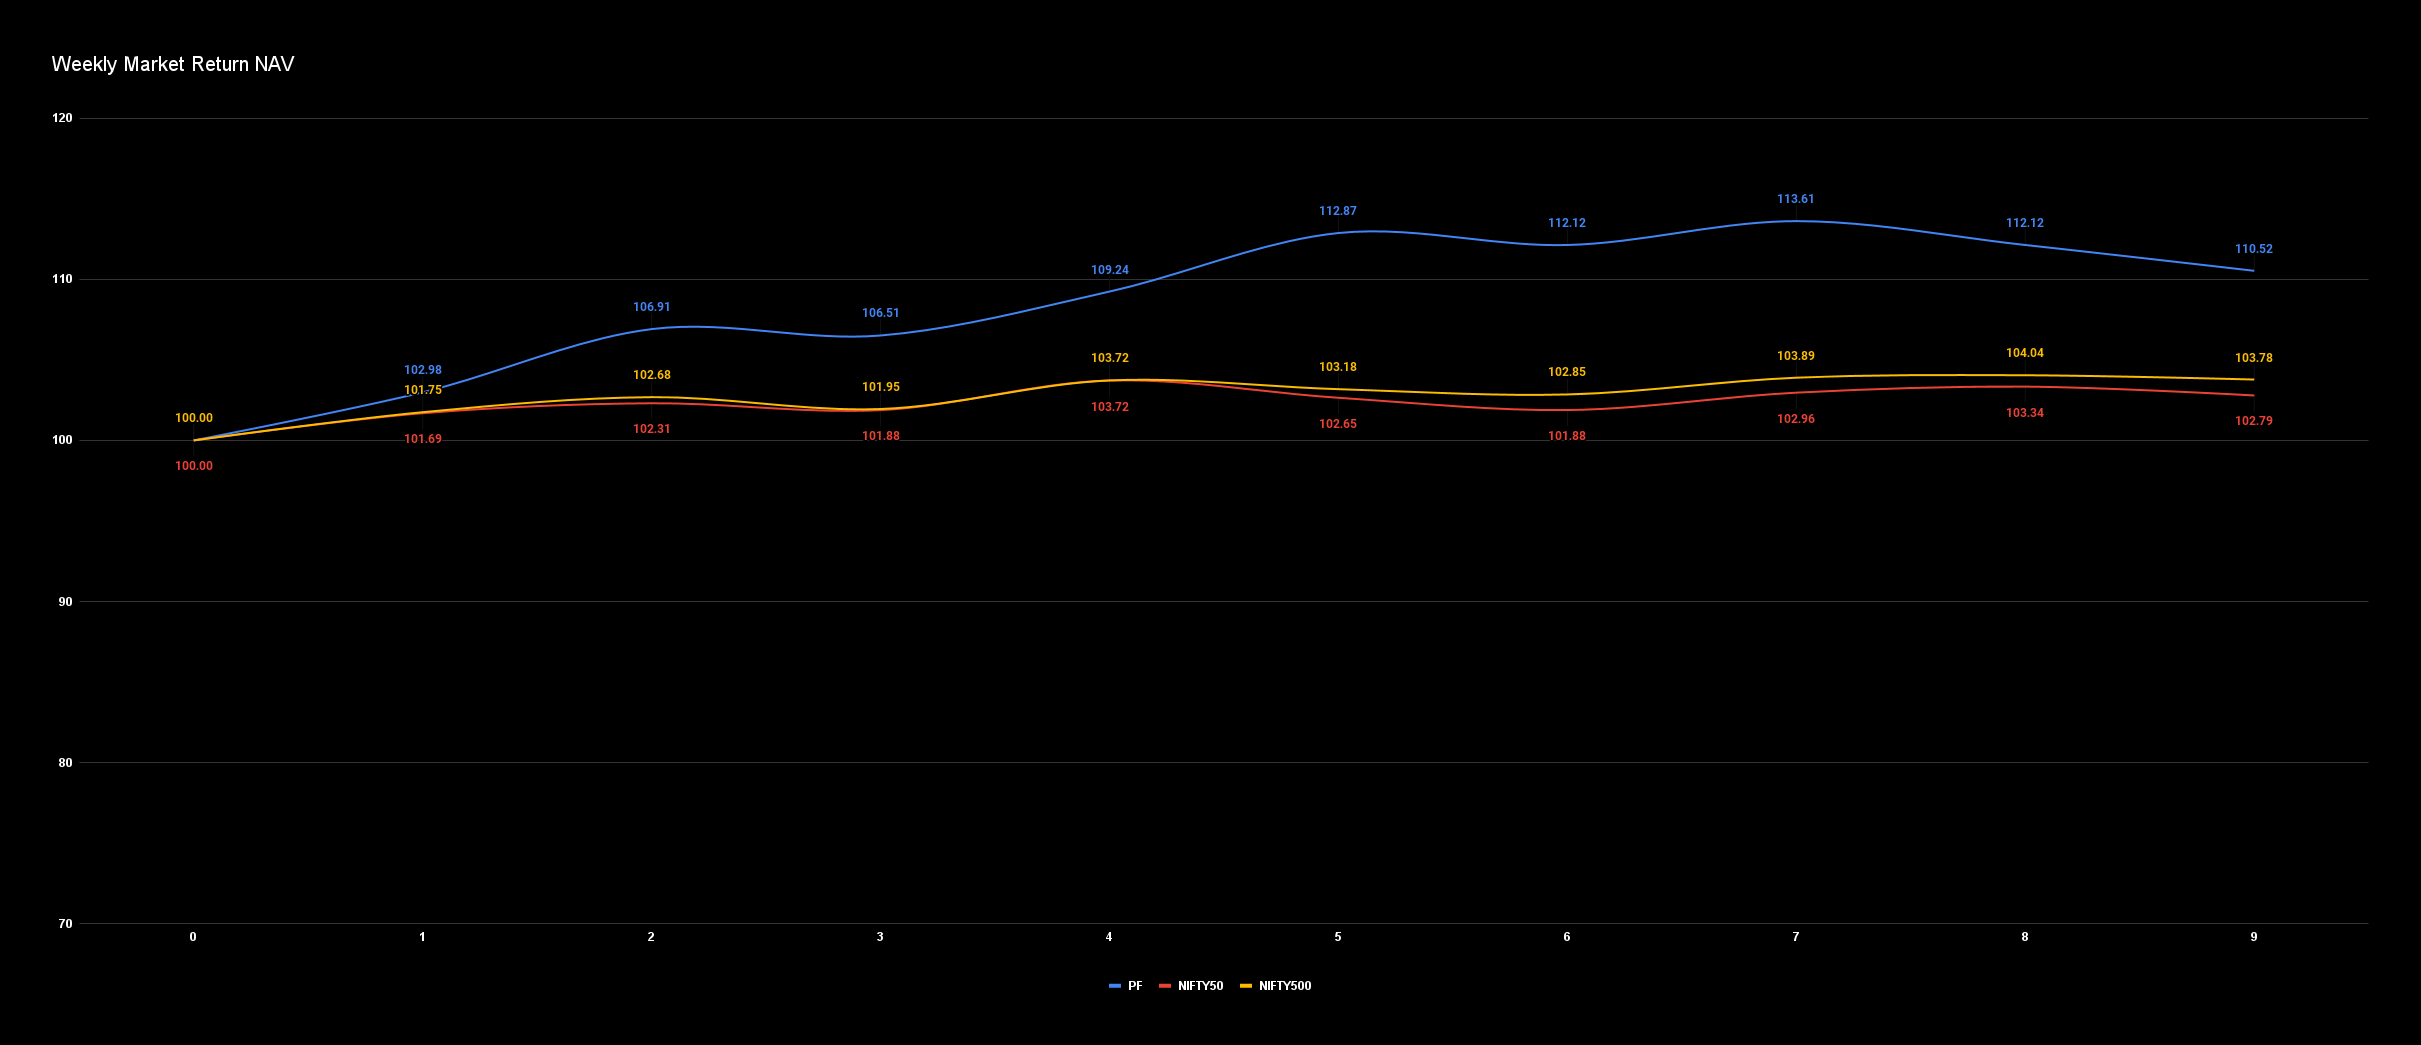
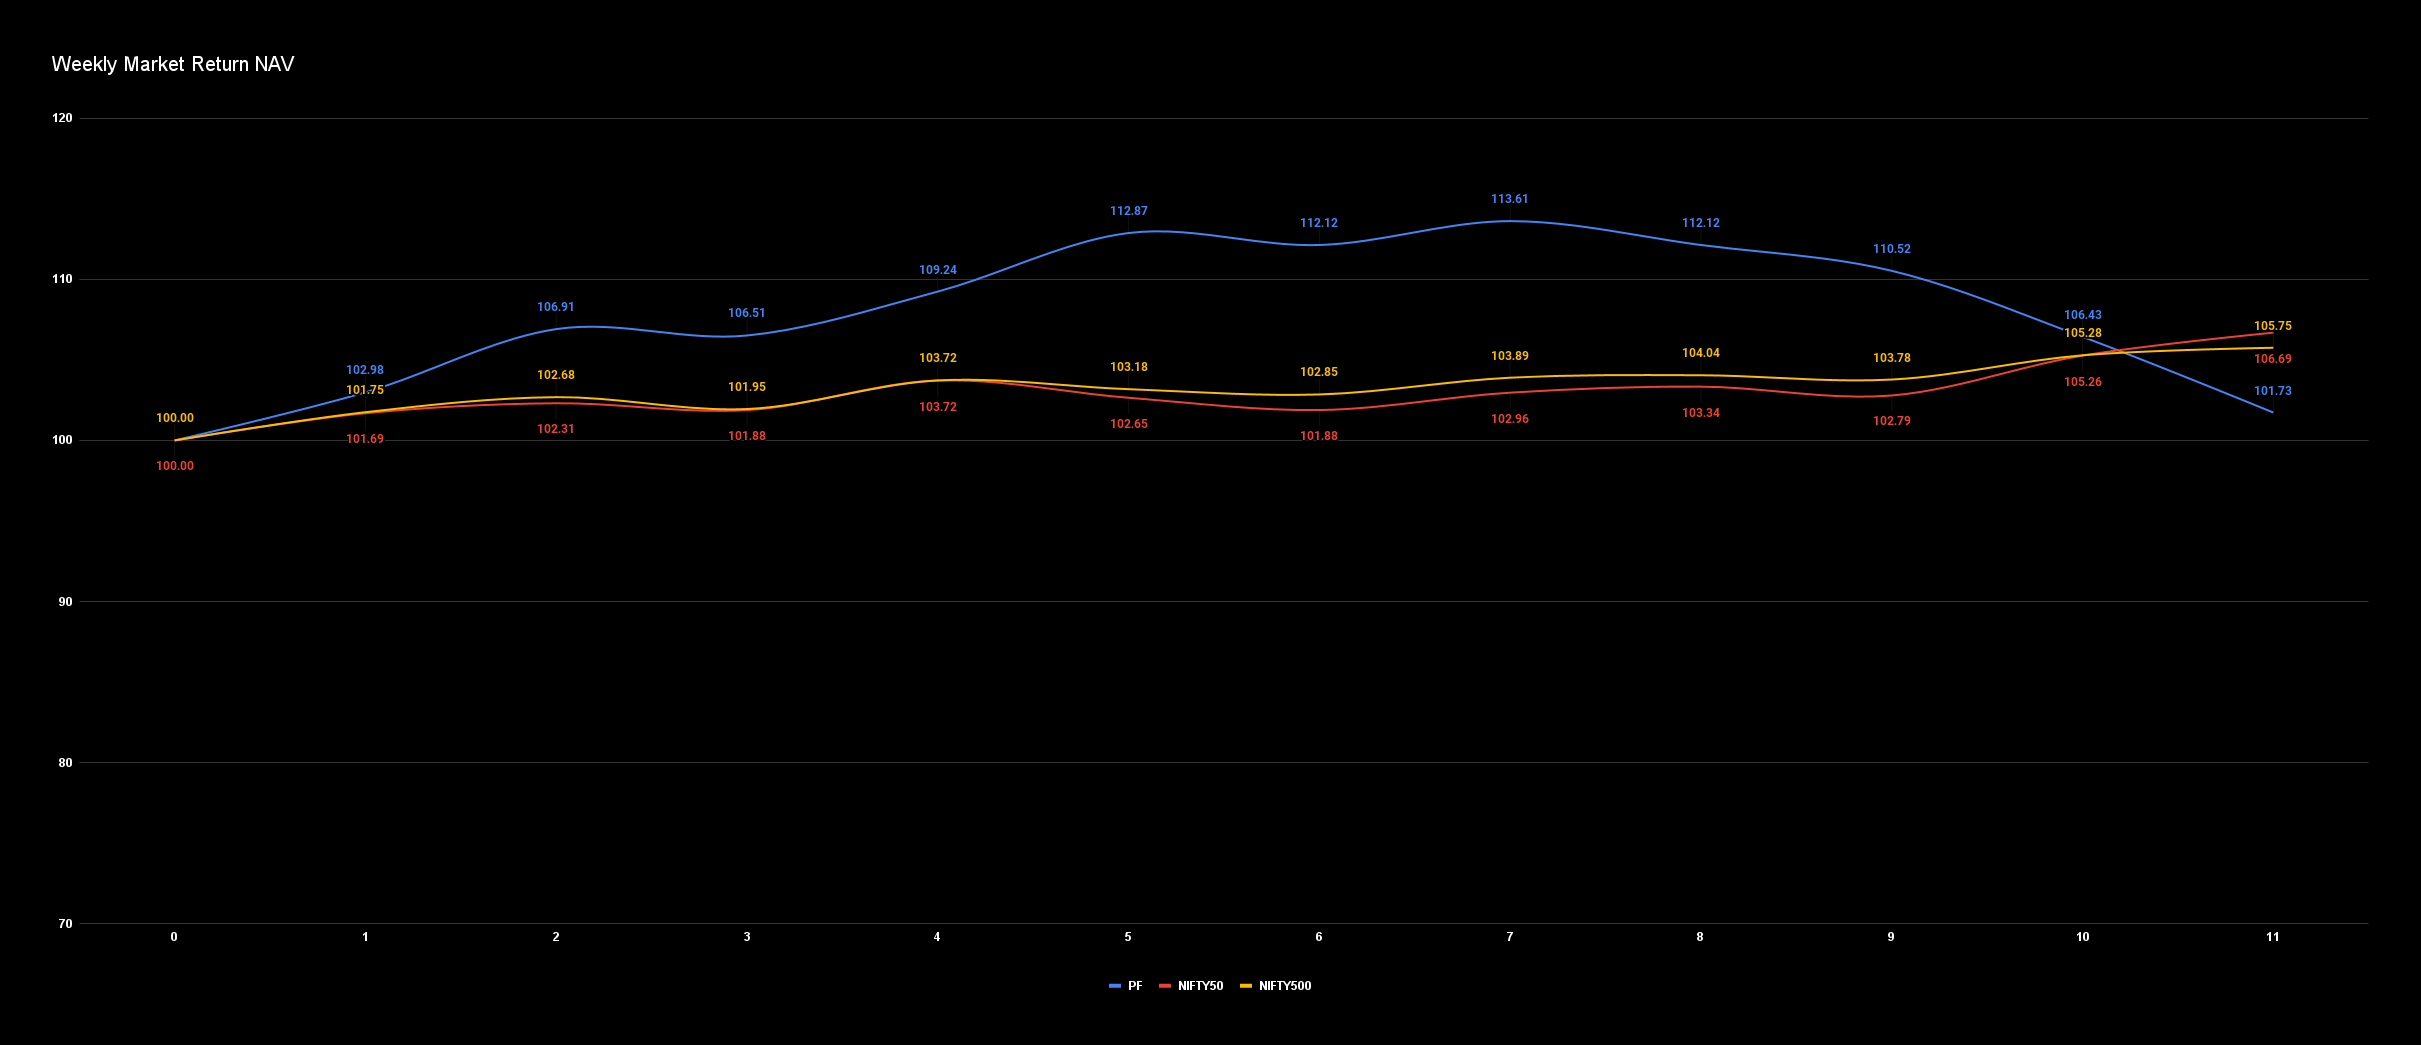
Weekly Relative Return:
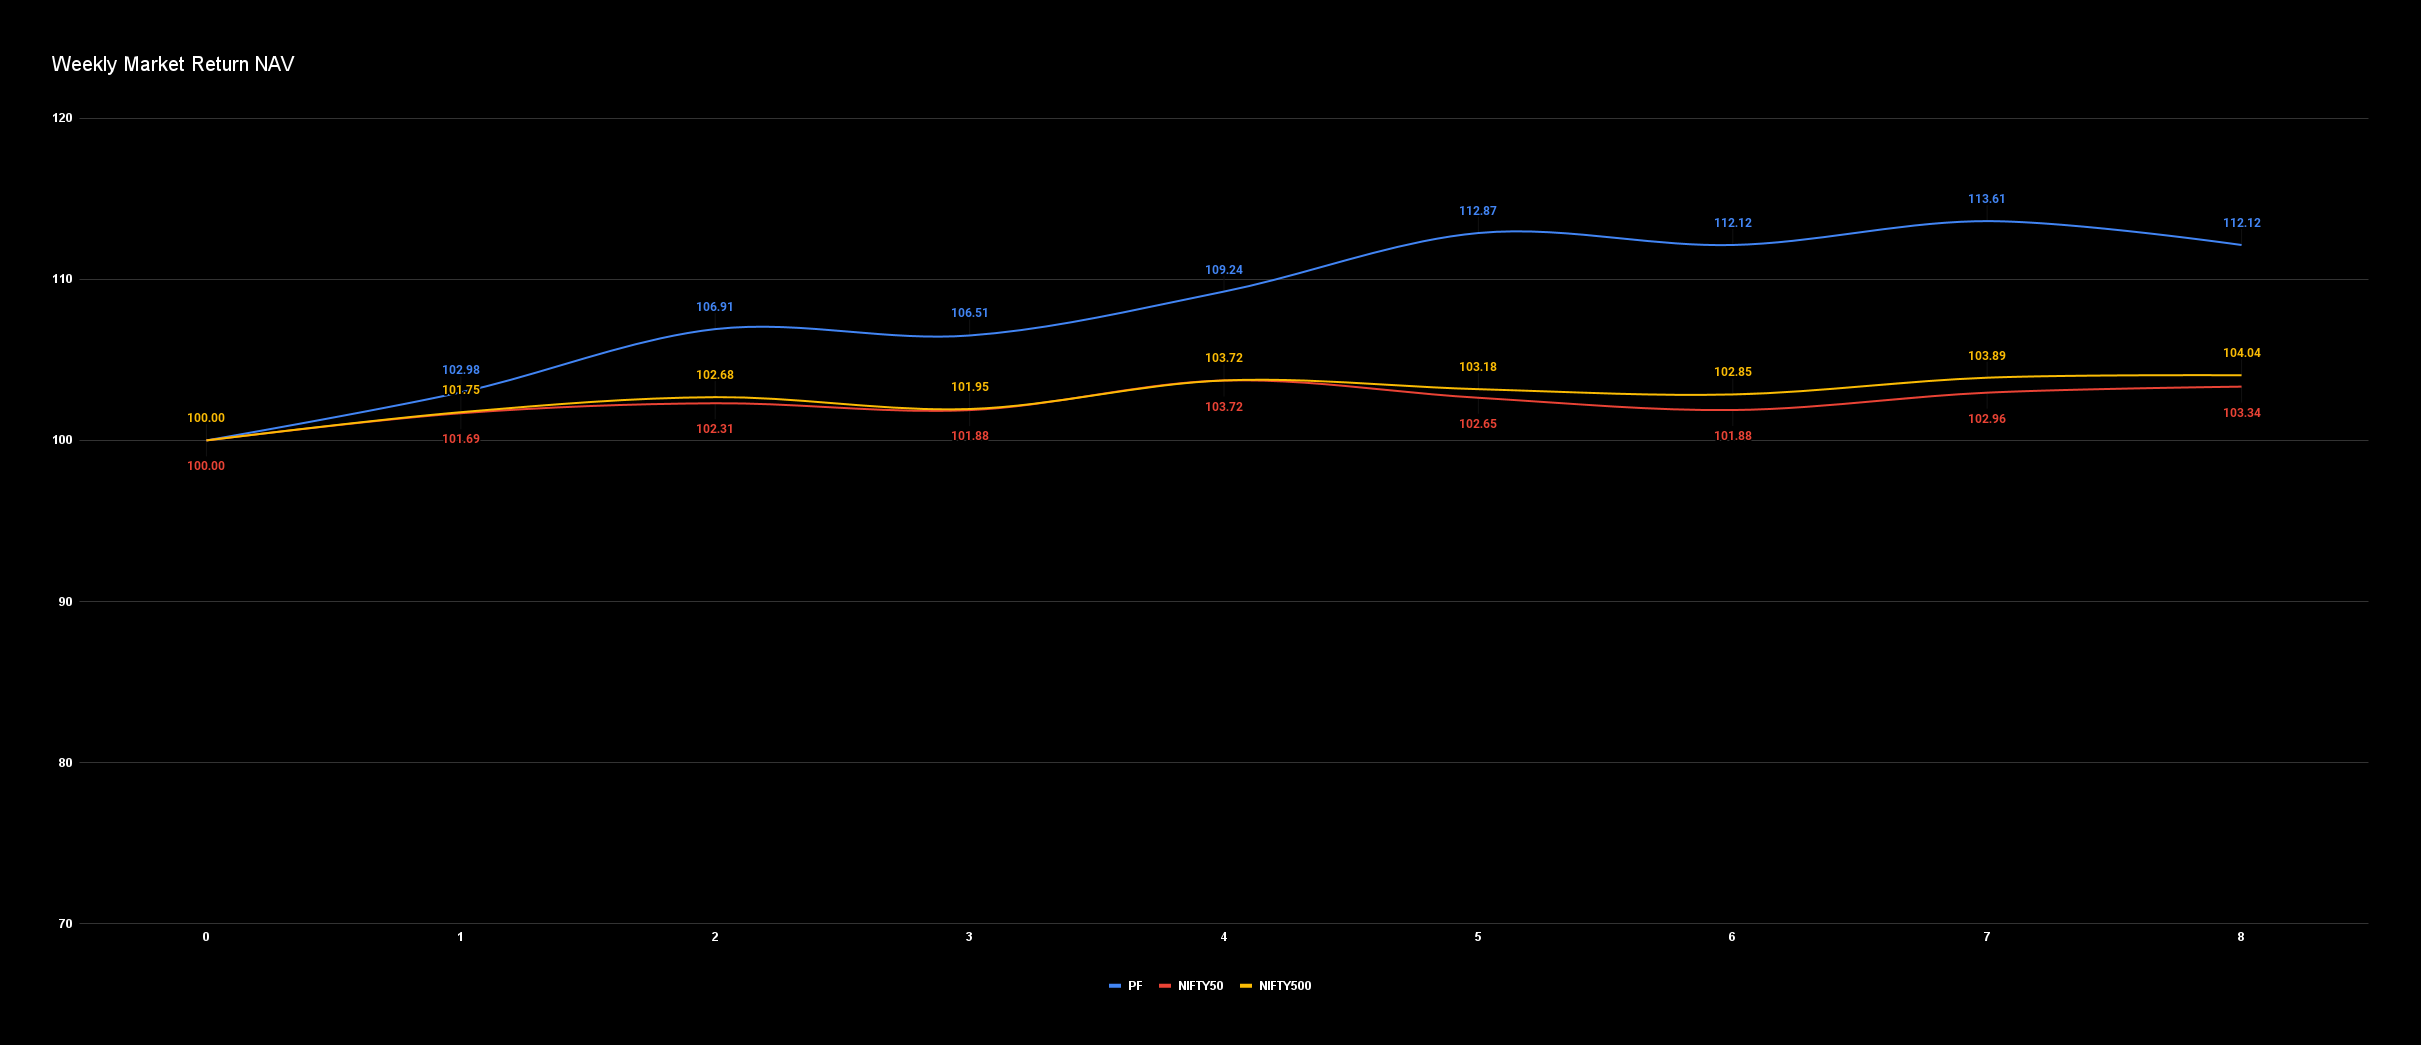
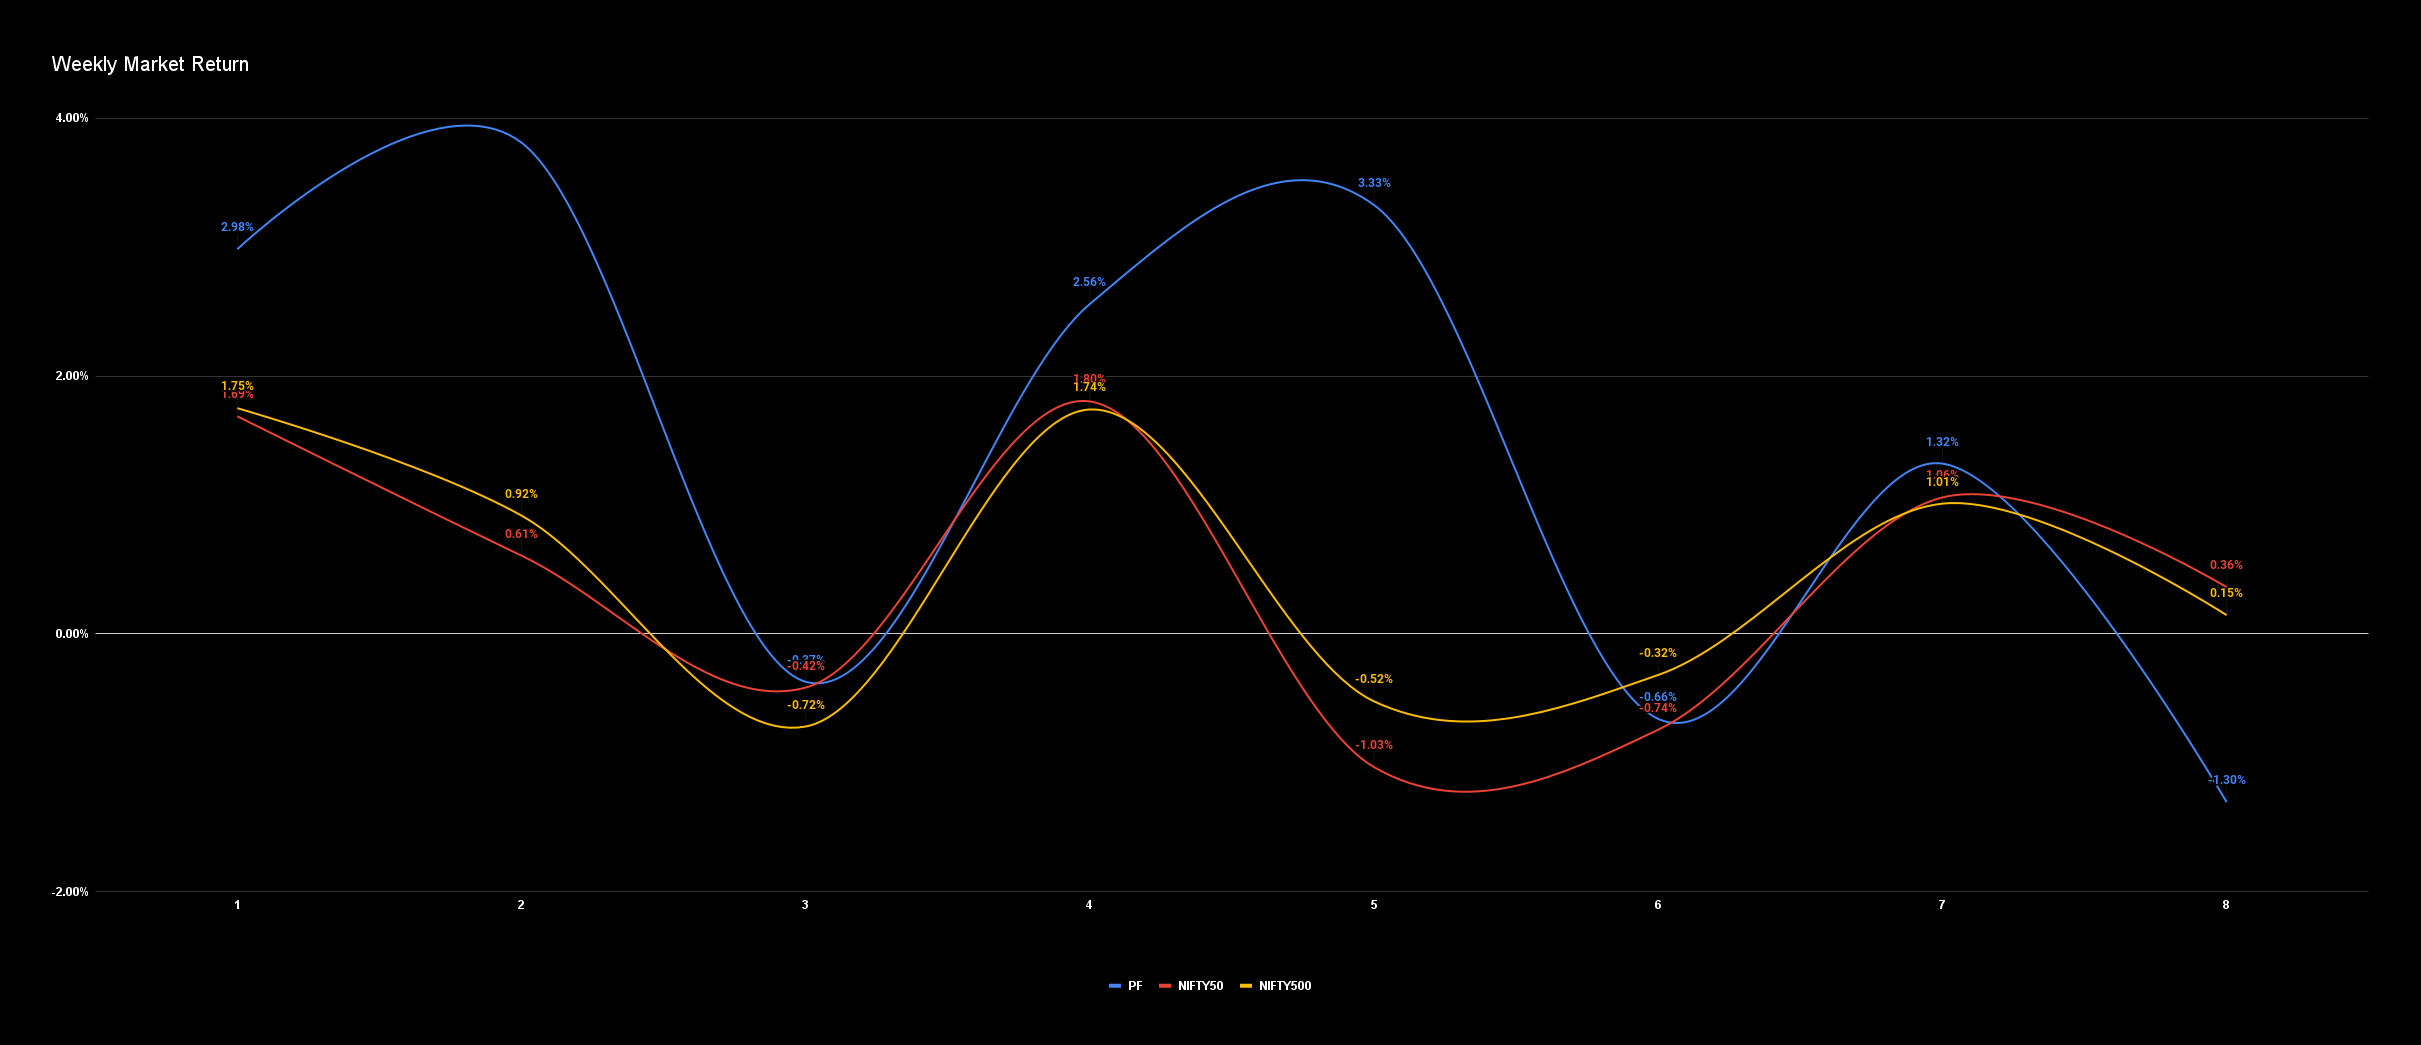
PF Return: -1.30%
NIFTY50: 0.36%
NIFTY500: 0.15%
Cumulative Indexed Relative Return:
PF Return: 12.12%
NIFTY50: 3.34%
NIFTY500: 4.04%
Trade Stats:
Total Trades: 98
Win Trades: 46
Loss Trades: 52
Biggest Win: 17.63%
Biggest Loss: -10.59%
Average Trade: 0.88%
Avg. Win Trade: 6.22%
Avg. Loss Trade: -3.85%
% Win Trades: 46.94%
% Loss Trades: 53.06%
PF for 26th July to 30th July will be shared tomorrow.
Disc. - Entries are recorded at 10 AM on Mondays and exits at 3PM on Fridays. This strategy is in the testing phase and not a recommendation to buy/sell.
I have started testing different P&C of parameters as well. Testing 6 for now.
Strat 1: -1.30%
Strat 2: -5.59%
Strat 3: -3.16%
Strat 4: 1.27%
Strat 5: -3.71%
Strat 6: -3.94%
NIFTY50: 0.36%
NIFTY500: 0.15%
2 Likes
PF for 26th July to 30th July
NSE:CRISIL
NSE:SCHAEFFLER
NSE:SUNCLAYLTD
NSE:JSL
NSE:ANGELBRKG
NSE:IBREALEST
NSE:JSLHISAR
NSE:VTL
NSE:TCIEXP
NSE:UTIAMC
1 Like
PF for 26th July to 30th July
Strat 1:
NSE:CRISIL
NSE:SCHAEFFLER
NSE:SUNCLAYLTD
NSE:JSL
NSE:ANGELBRKG
NSE:IBREALEST
NSE:JSLHISAR
NSE:VTL
NSE:TCIEXP
NSE:UTIAMC
Strat 2:
NSE:CRISIL
NSE:SCHAEFFLER
NSE:JSL
NSE:IBREALEST
NSE:JSLHISAR
Strat 3:
NSE:JSL
NSE:JSWENERGY
NSE:SCHAEFFLER
NSE:IBREALEST
NSE:JSLHISAR
NSE:CAPLIPOINT
NSE:JUBLFOOD
NSE:CRISIL
Strat 4:
NSE:SUNCLAYLTD
NSE:ANGELBRKG
NSE:VTL
NSE:TCIEXP
NSE:UTIAMC
Strat 5:
NSE:SCHAEFFLER
NSE:MPHASIS
NSE:PERSISTENT
NSE:JSL
NSE:MHRIL
NSE:MAHSCOOTER
NSE:INTELLECT
NSE:JSLHISAR
NSE:MAHLOG
NSE:JSWENERGY
NSE:SPARC
NSE:TATACOFFEE
Strat 6:
NSE:SCHAEFFLER
NSE:JSL
NSE:JSLHISAR
1 Like
Volume Turnover (T/O) Breakout (B/O) Test PF:
Week 8 - 19th July to 23rd July
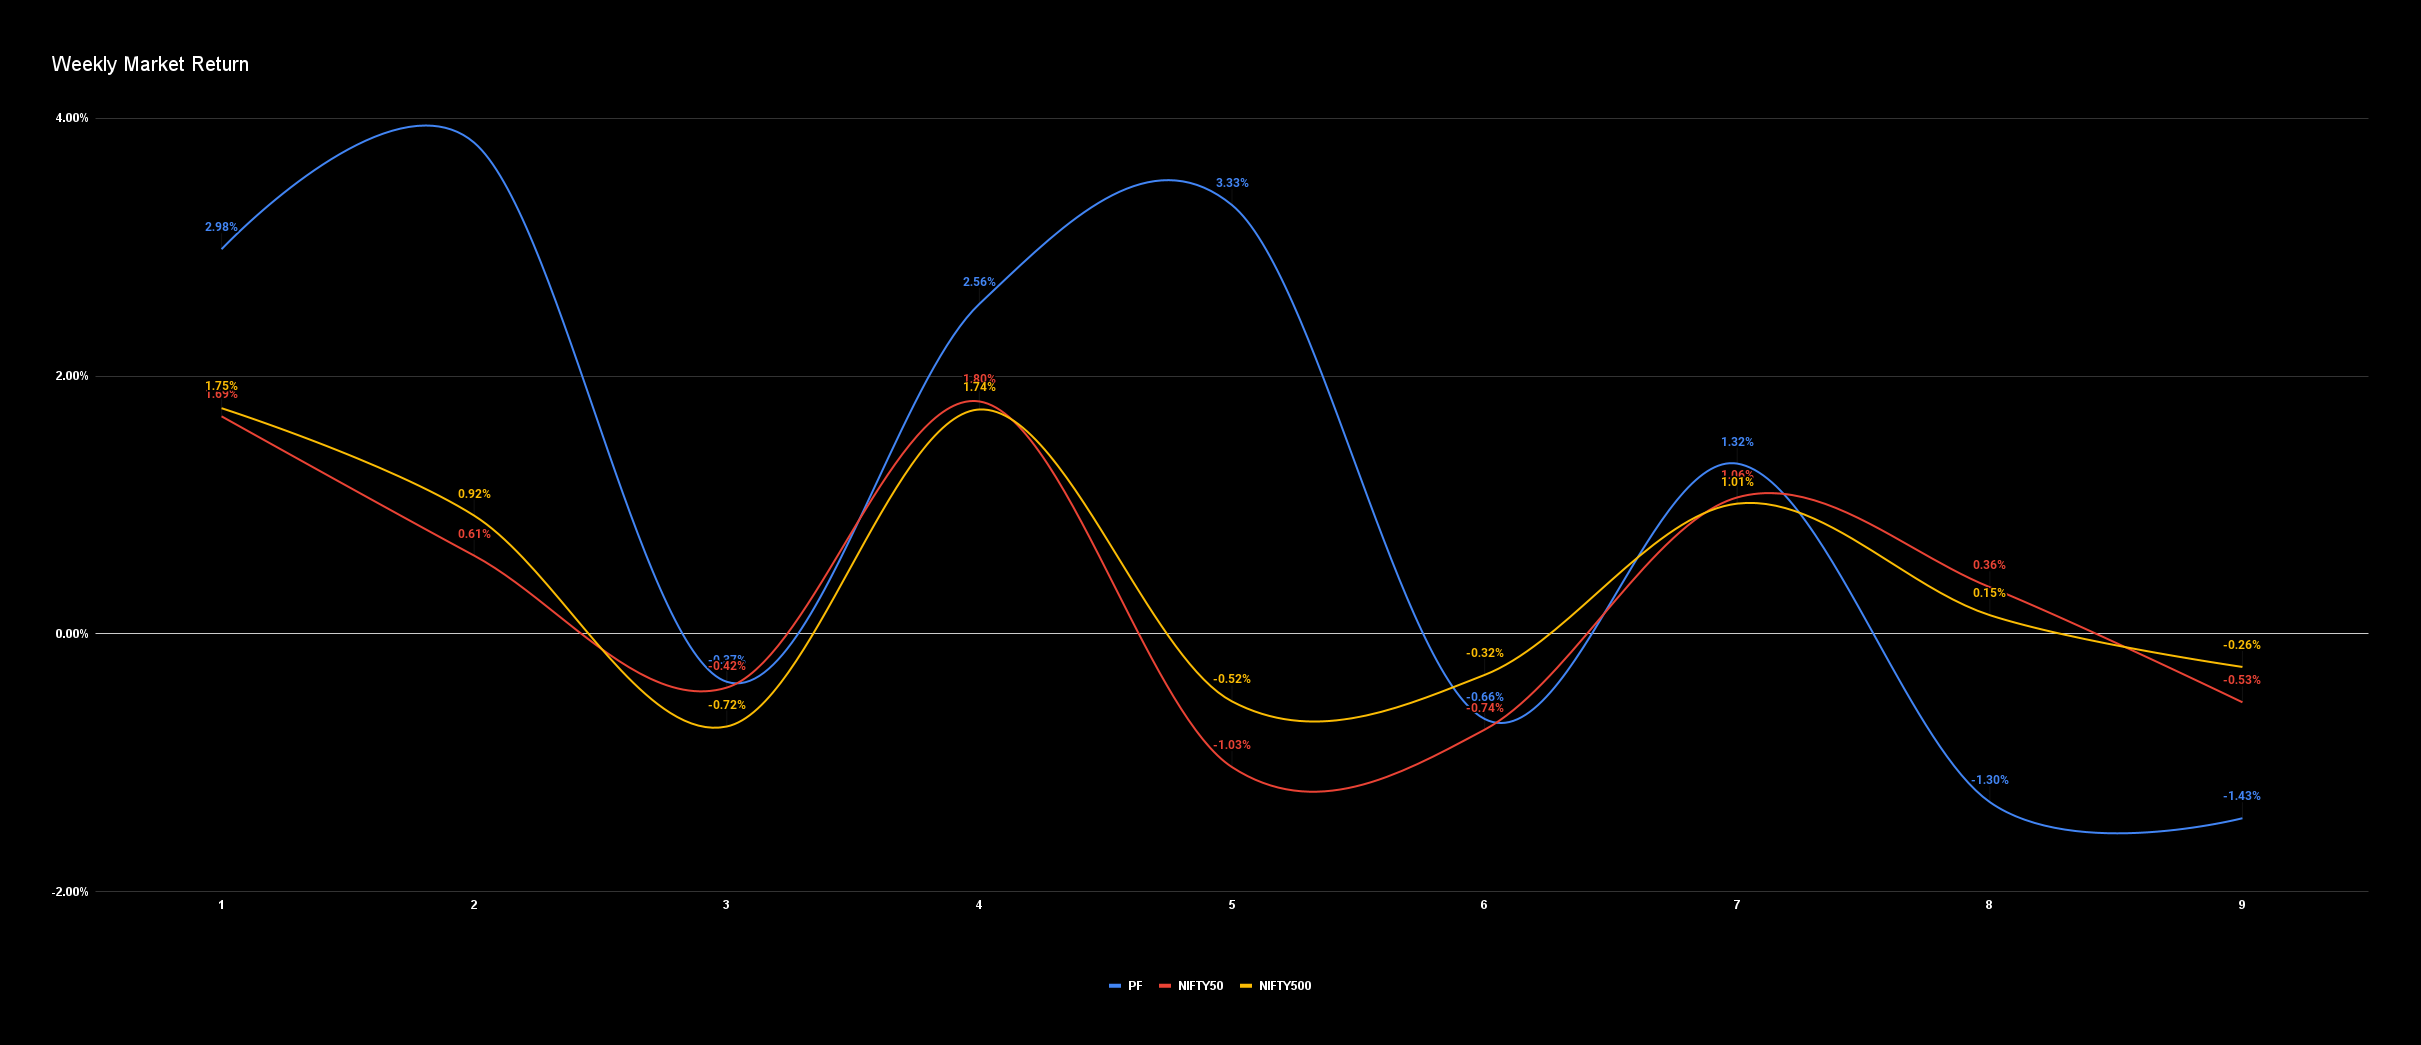
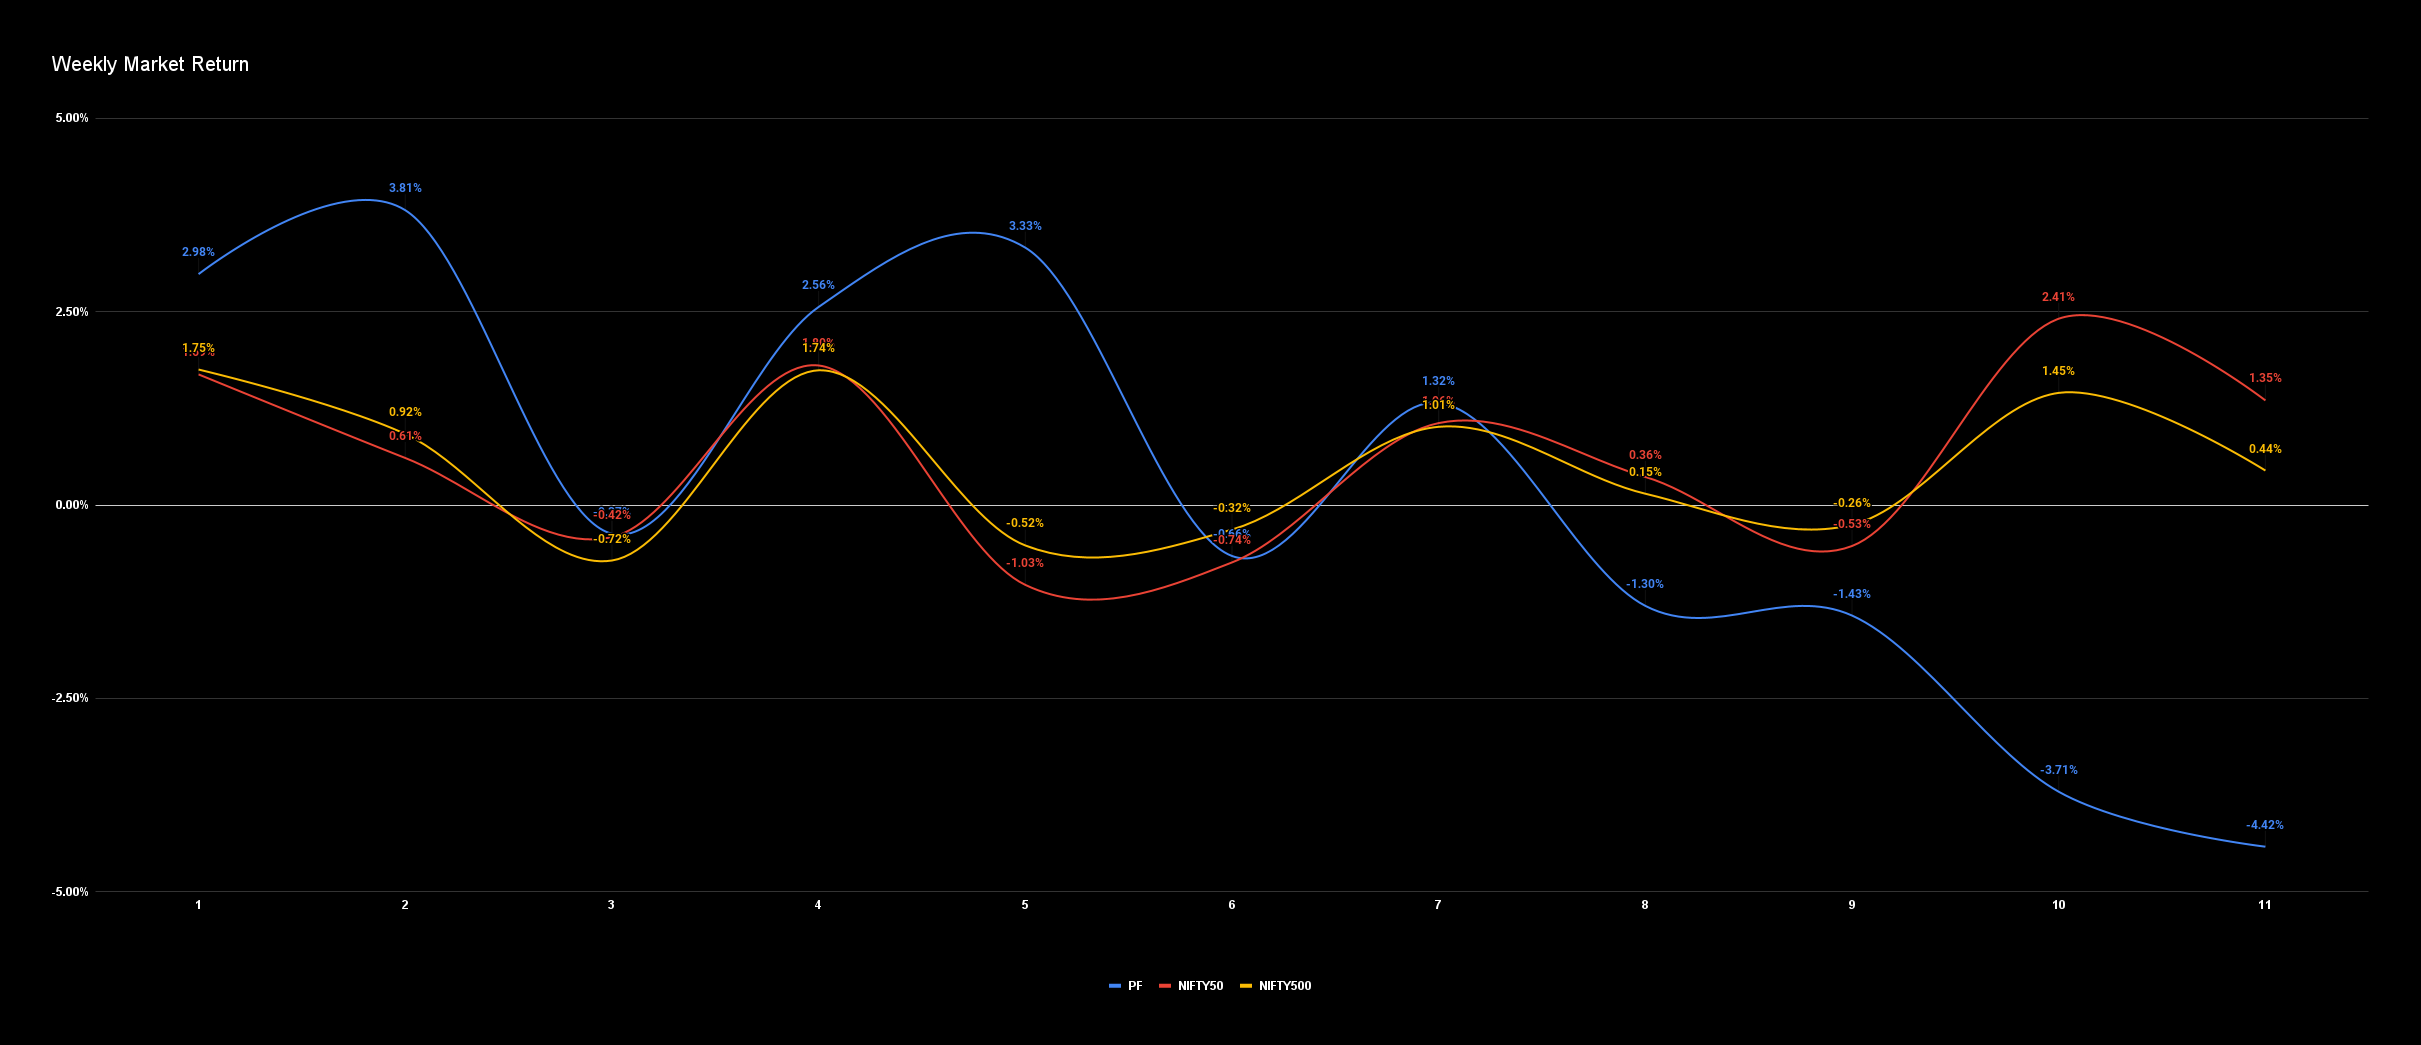
Weekly Relative Return:
PF Return: -1.43%
NIFTY50: 0.53%
NIFTY500: 0.26%
Cumulative Indexed Relative Return:
PF Return: 10.52%
NIFTY50: 2.79%
NIFTY500: 3.78%
Trade Stats:
Total Trades: 108
Win Trades: 51
Loss Trades: 57
Biggest Win: 17.63%
Biggest Loss: -11.89%
Average Trade: 0.66%
Avg. Win Trade: 6.10%
Avg. Loss Trade: -4.20%
% Win Trades: 47.22%
% Loss Trades: 52.78%
PF for 2nd Aug to 6th Aug will be shared tomorrow.
Disc. - Entries are recorded at 10 AM on Mondays and exits at 3PM on Fridays. This strategy is in testing phase and not a recommendation to buy/sell.
I have started testing different P&C of parameters as well. Testing 6 for now.
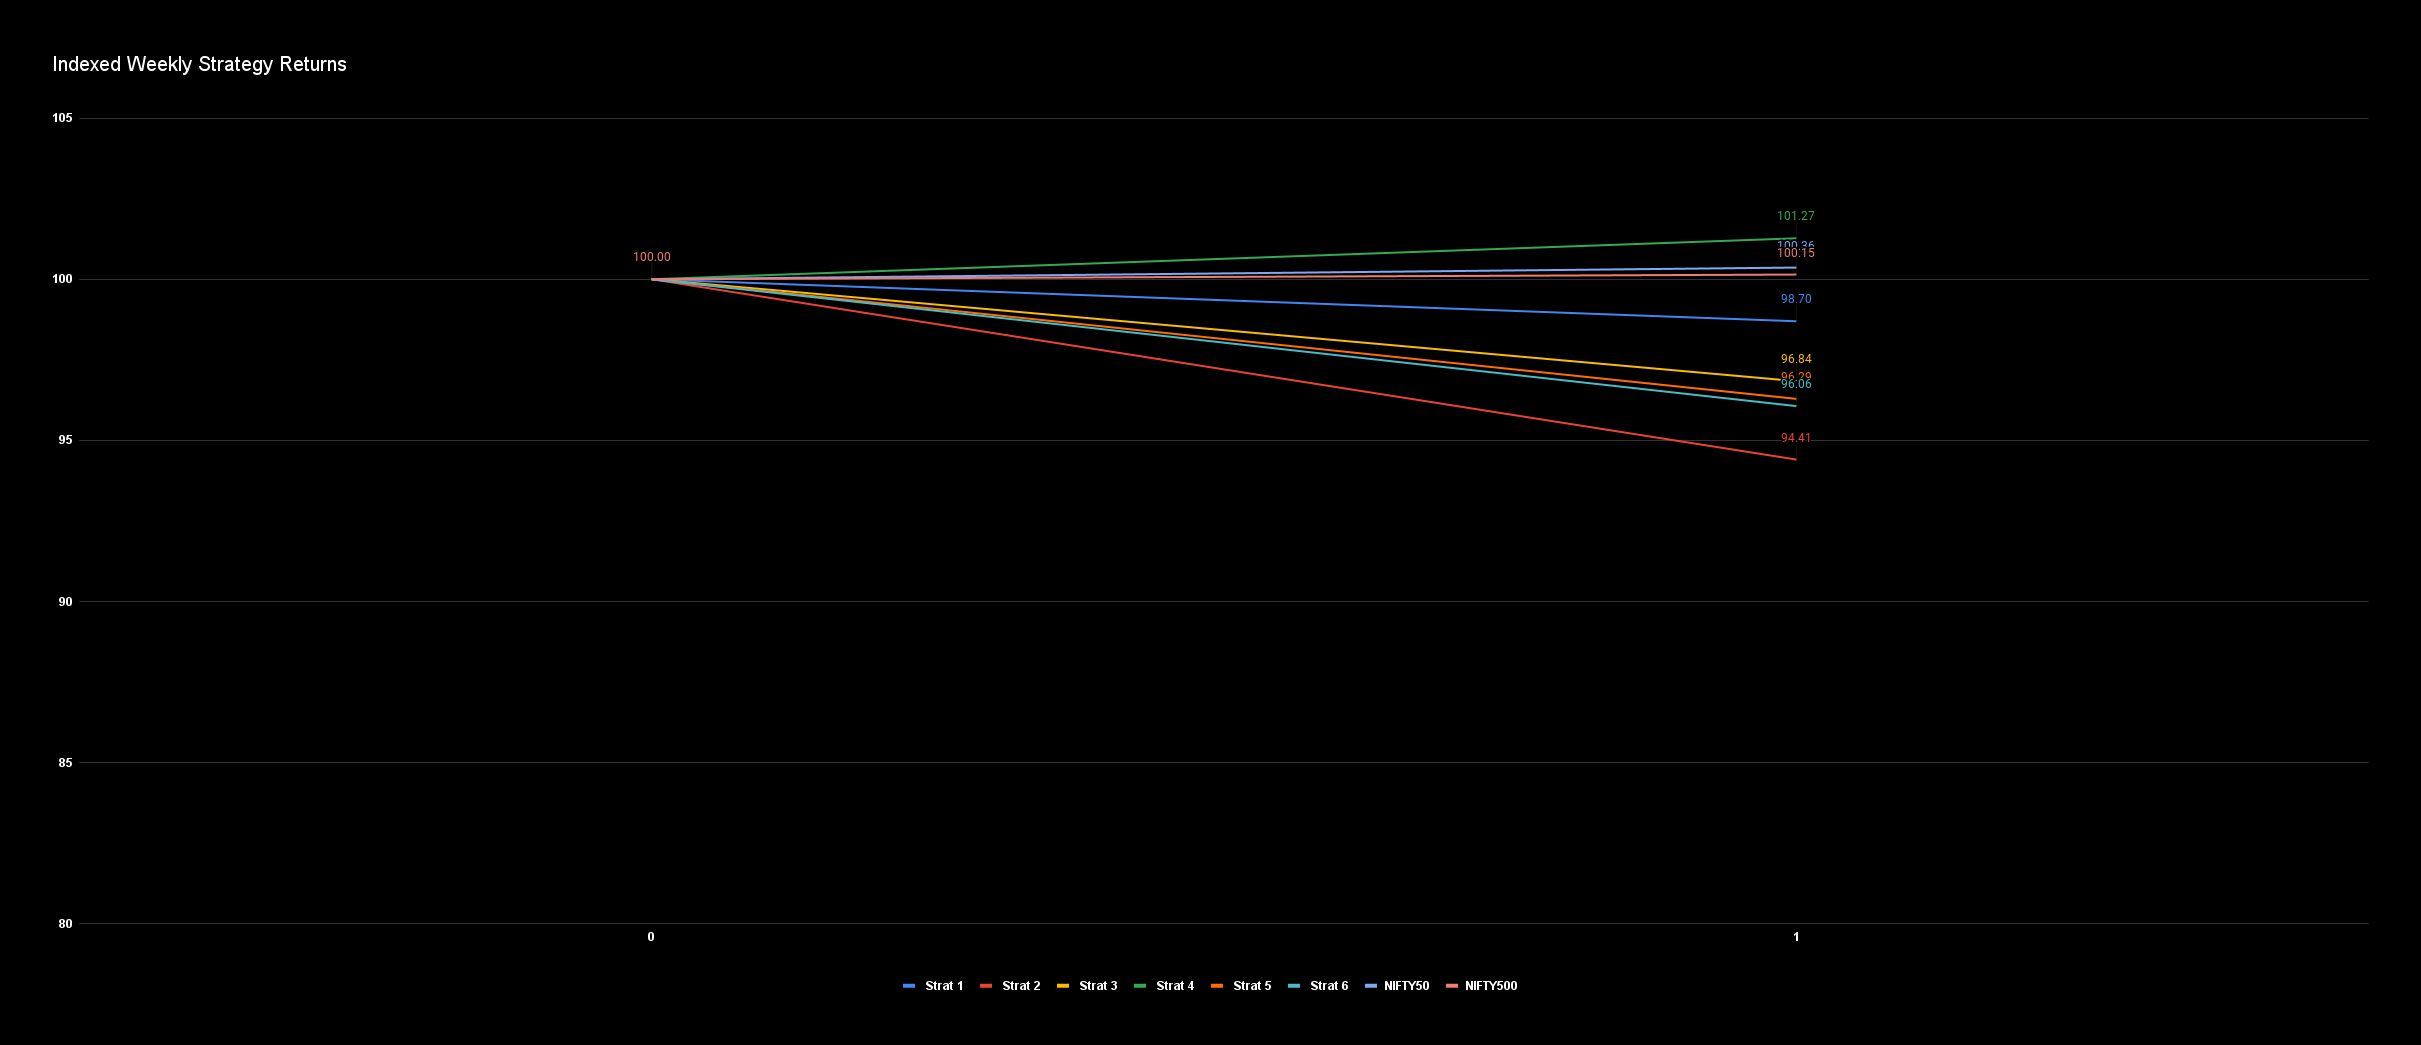
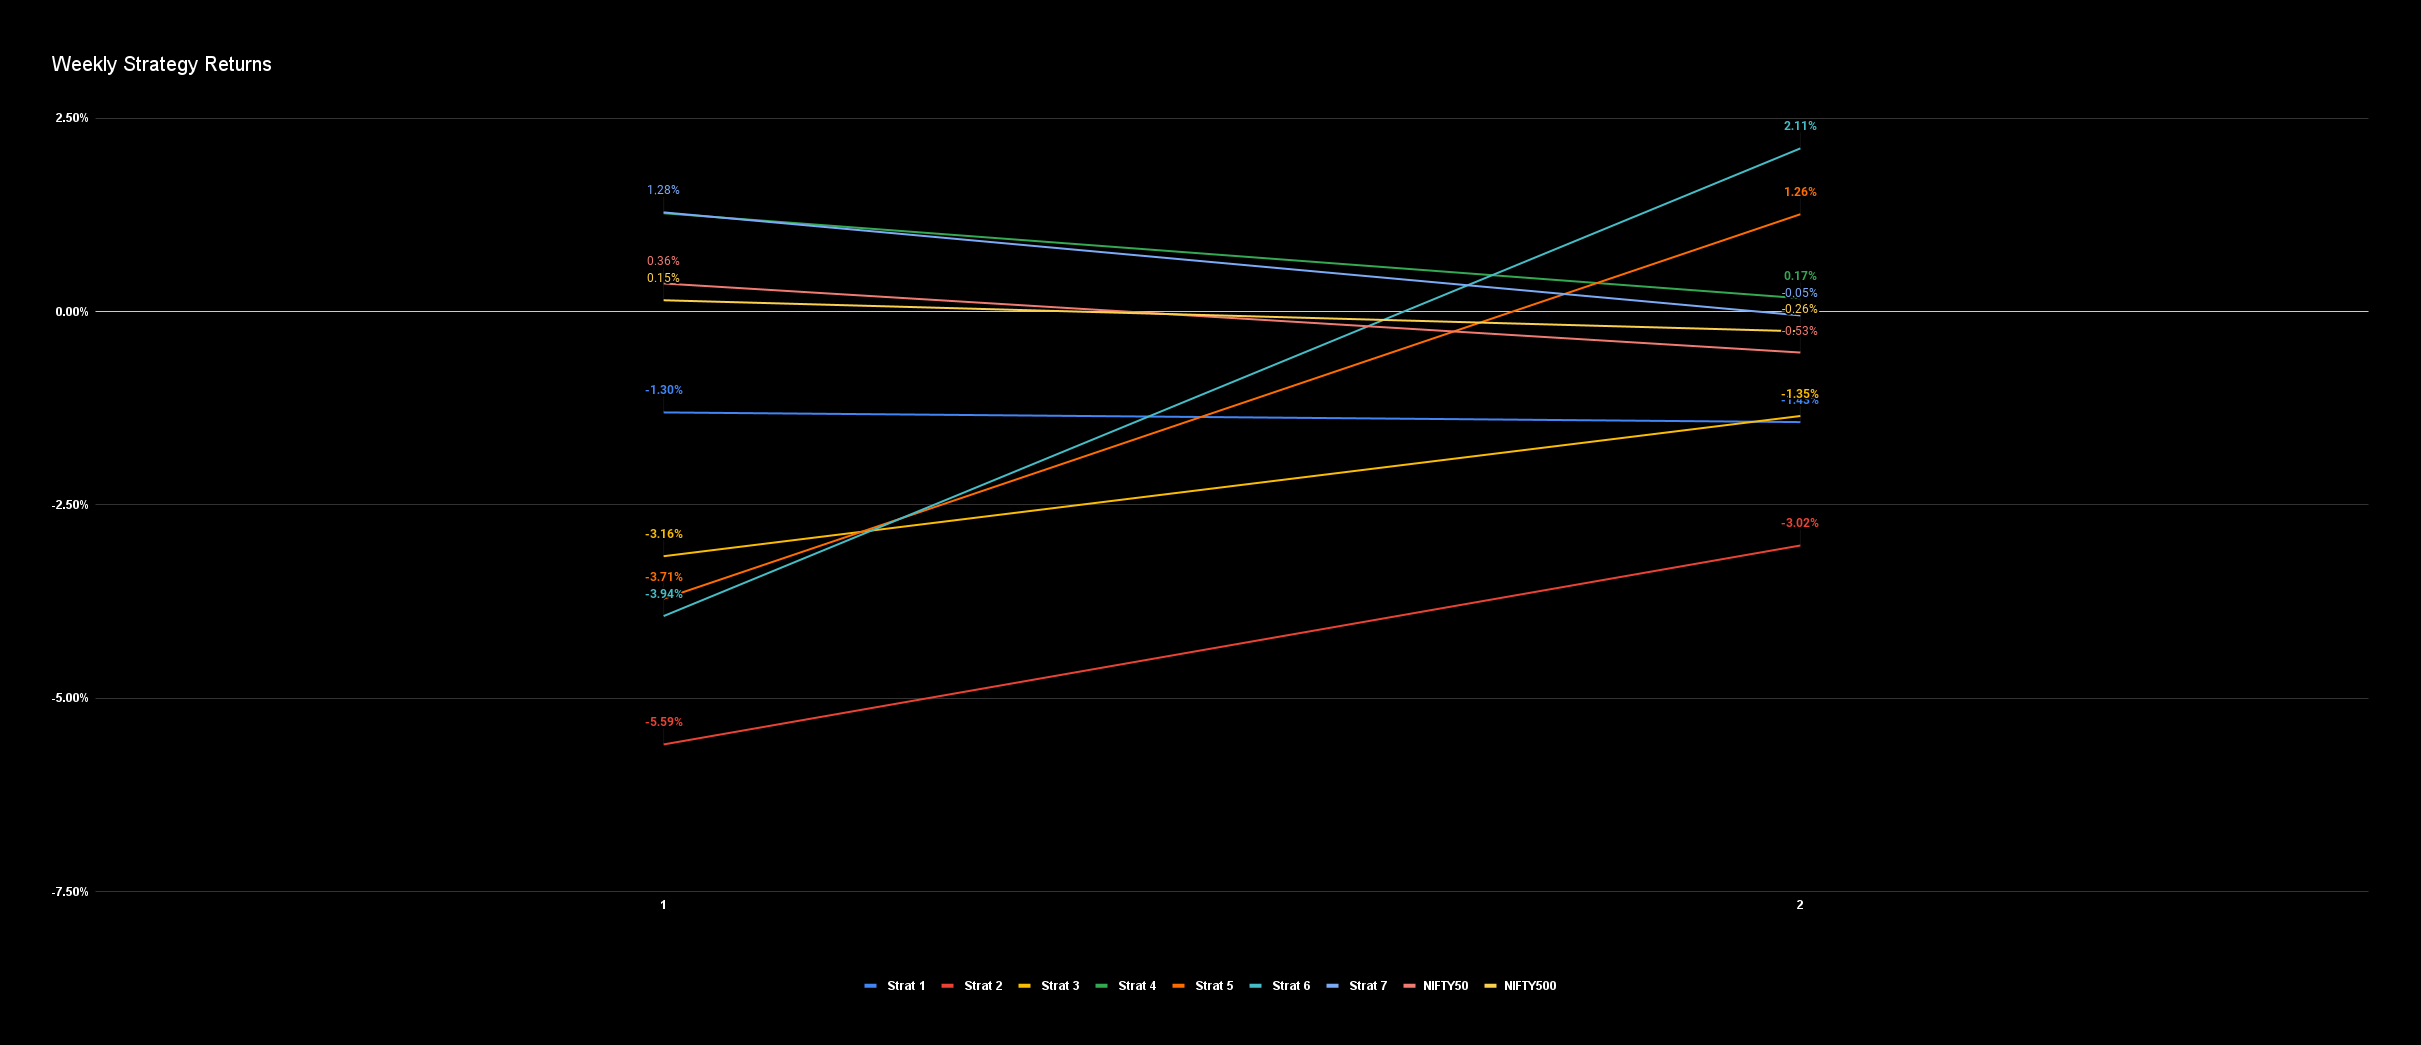
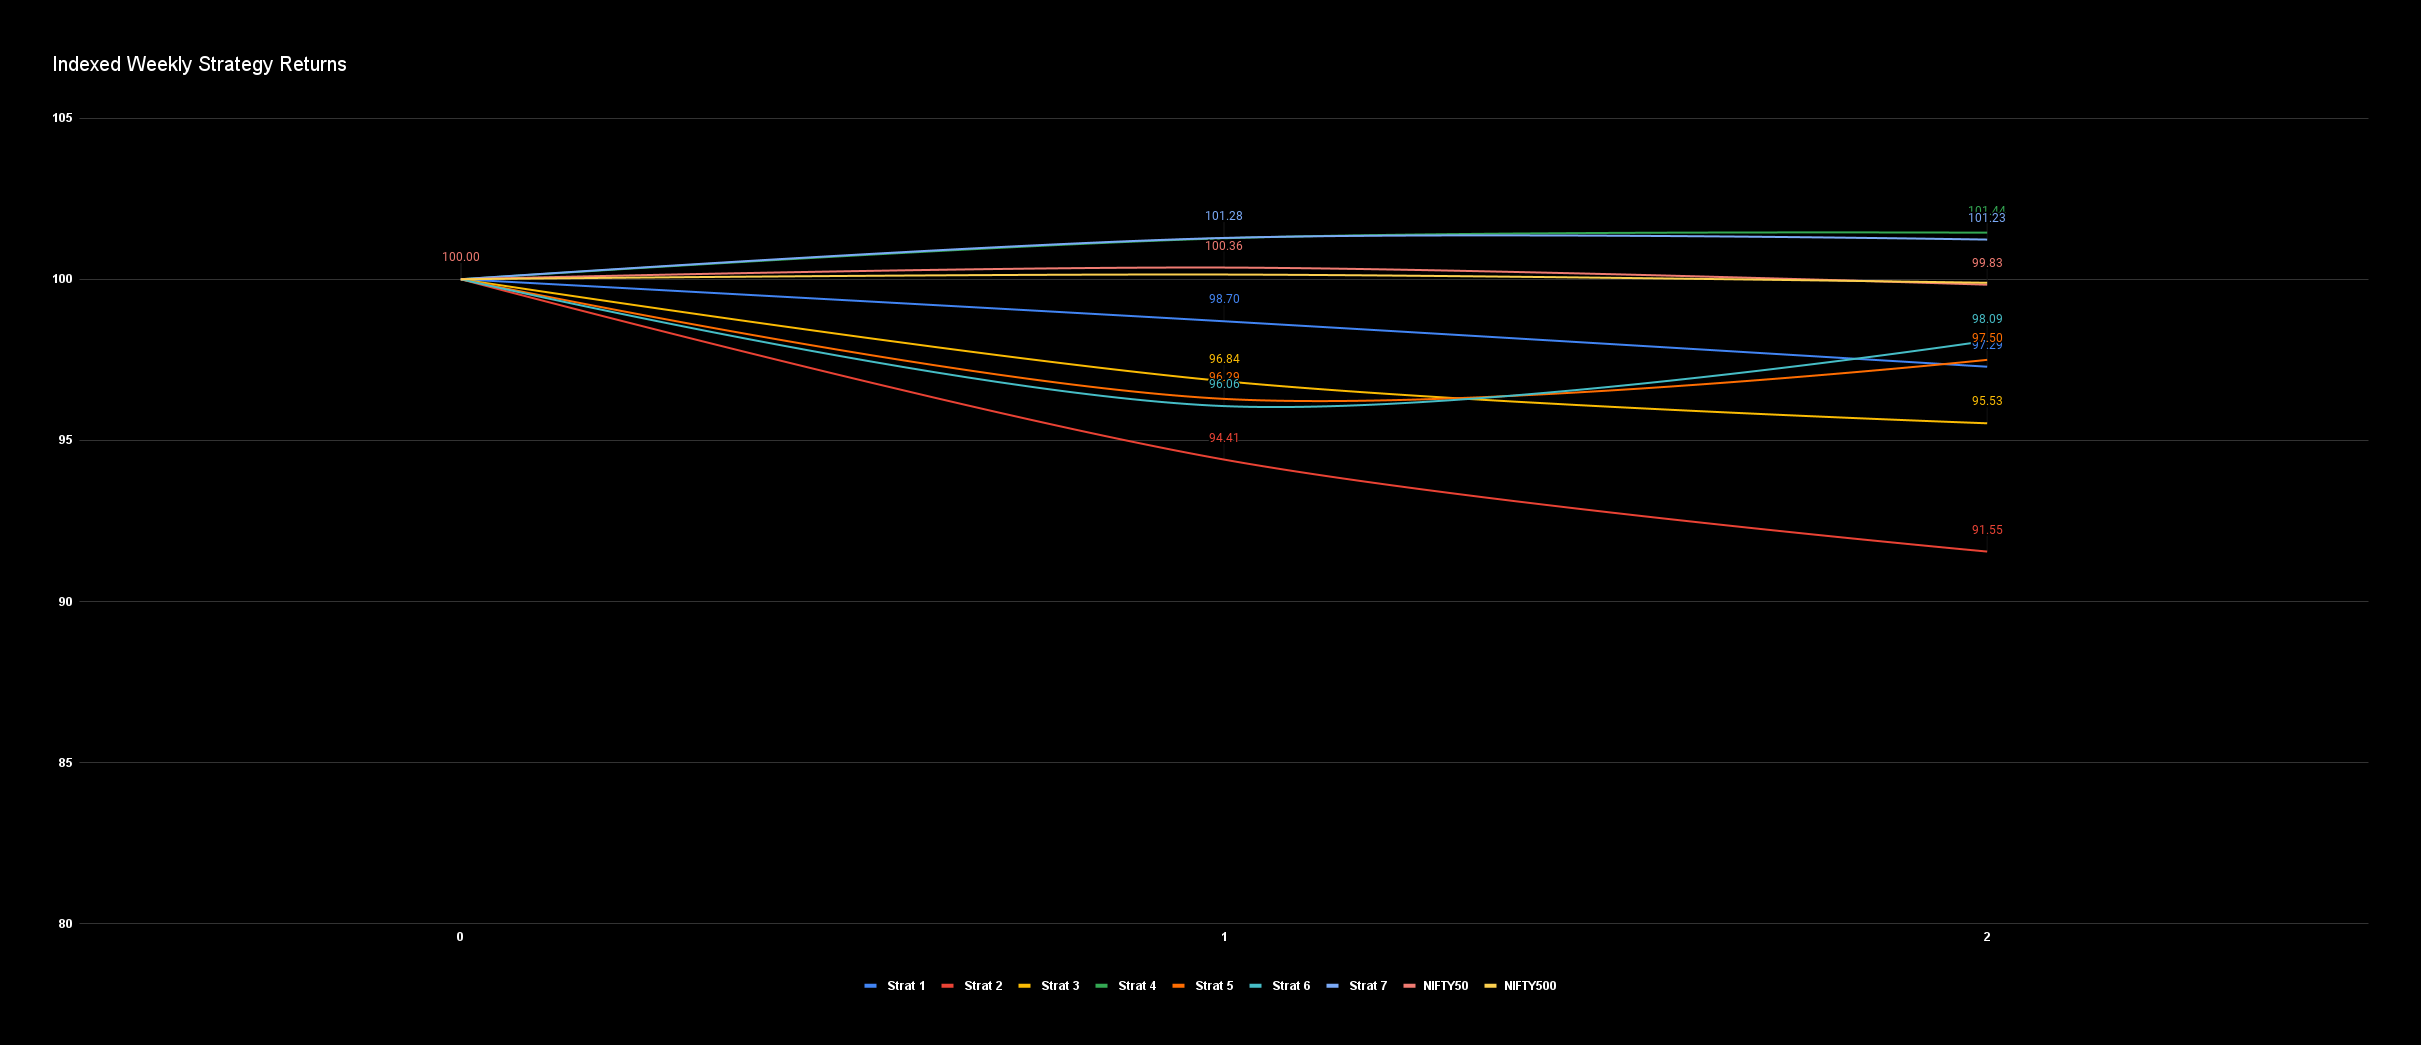
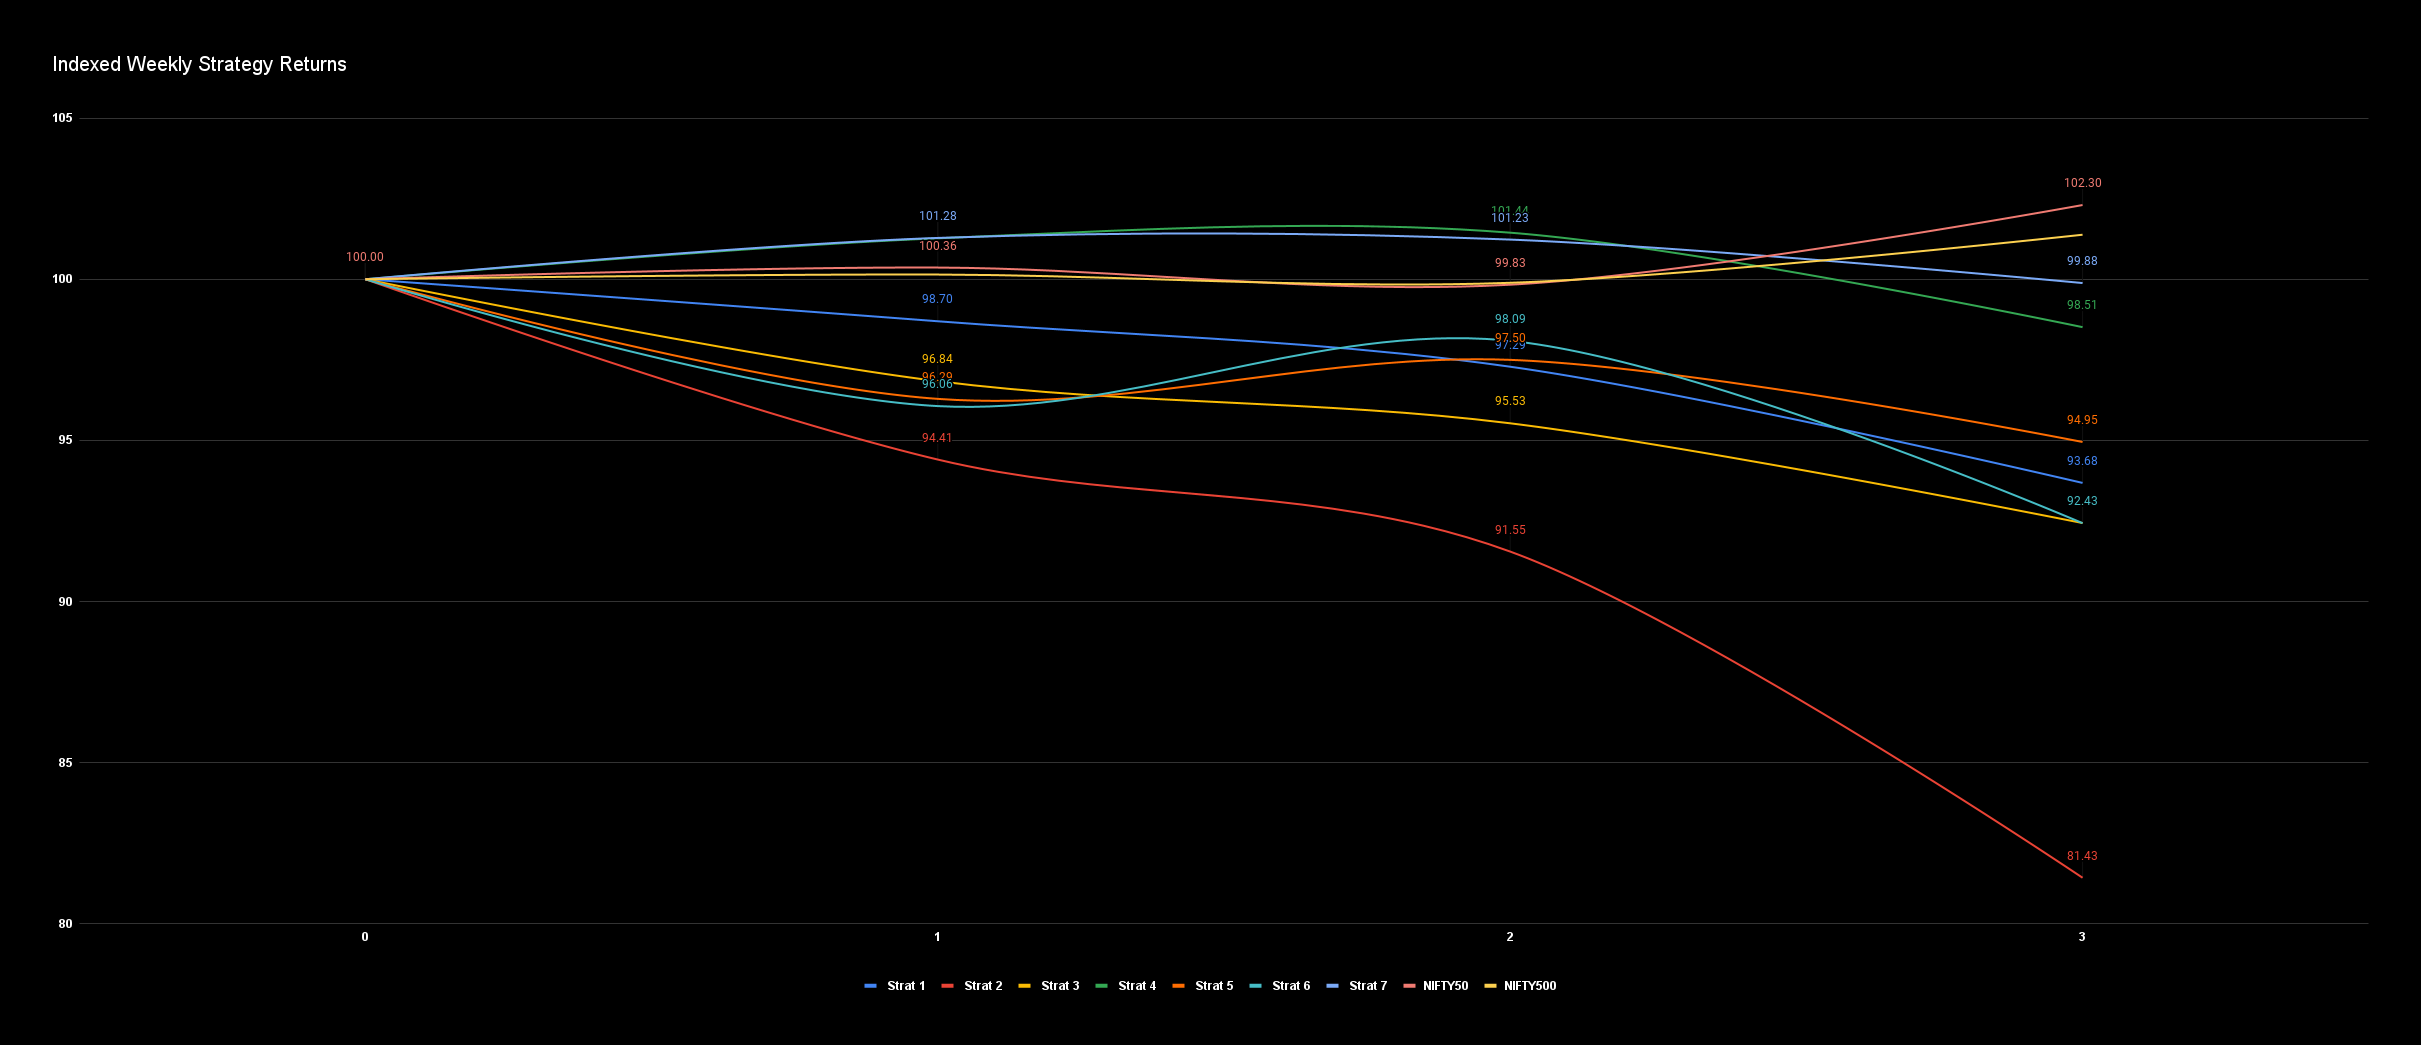
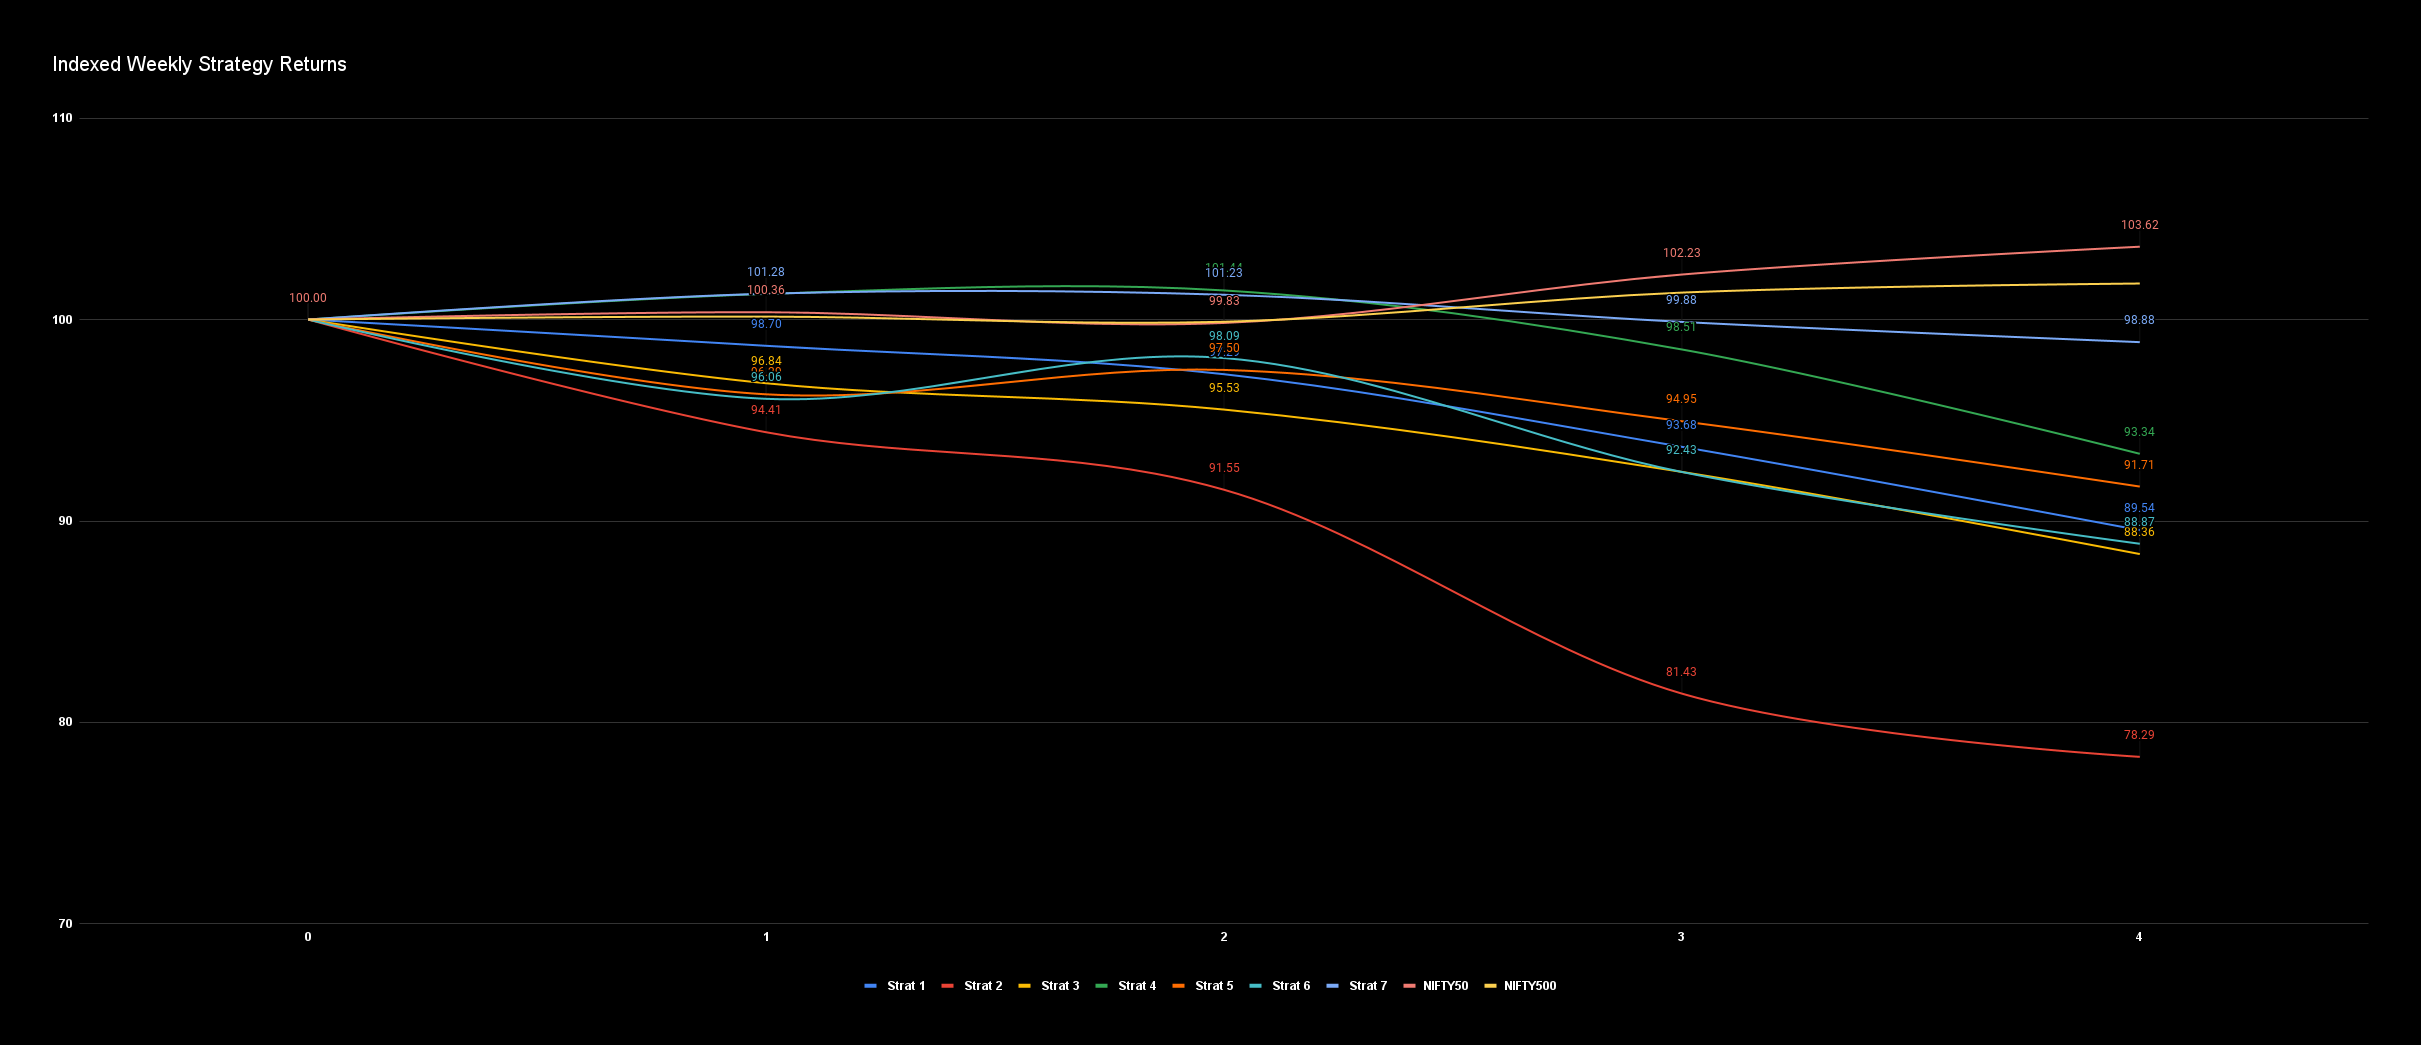
Weekly Relative Return:
Strat 1: -1.43%
Strat 2: -3.02%
Strat 3: -1.35%
Strat 4: 0.17%
Strat 5: 1.26%
Strat 6: 2.11%
Strat 7: -0.05%
NIFTY50: -0.53%
NIFTY500: -0.26%
Cumulative Indexed Relative Return:
Strat 1: 97.29
Strat 2: 91.55
Strat 3: 95.53
Strat 4: 101.44
Strat 5: 97.5
Strat 6: 98.09
Strat 7: 101.23
NIFTY50: 99.83
NIFTY500: 99.89
PF for 2nd Aug to 6th Aug
Strat 1:
NSE:SWANENERGY
NSE:CCL
NSE:MAHLOG
NSE:ELGIEQUIP
NSE:ASAHIINDIA
NSE:VTL
NSE:JSL
NSE:KSB
NSE:PHILIPCARB
NSE:MAHINDCIE
Strat 2:
NSE:MAHLOG
Strat 3:
NSE:MAHLOG
NSE:TRIDENT
NSE:JKPAPER
NSE:VMART
NSE:CENTURYTEX
NSE:LAXMIMACH
NSE:UTIAMC
NSE:BALRAMCHIN
NSE:NATIONALUM
Strat 4:
NSE:SWANENERGY
NSE:CCL
NSE:ELGIEQUIP
NSE:ASAHIINDIA
NSE:VTL
NSE:JSL
NSE:KSB
NSE:PHILIPCARB
NSE:MAHINDCIE
Strat 5:
NSE:ASAHIINDIA
NSE:SWANENERGY
NSE:MAHLOG
NSE:ELGIEQUIP
NSE:KSB
NSE:SPARC
NSE:VAIBHAVGBL
NSE:TEAMLEASE
NSE:LALPATHLAB
Strat 6:
NSE:SWANENERGY
NSE:MAHLOG
NSE:ELGIEQUIP
NSE:ASAHIINDIA
NSE:KSB
Strat 7:
NSE:AARTIIND
NSE:DABUR
NSE:LTI
NSE:SRF
NSE:INFY
NSE:BALRAMCHIN
NSE:AMBUJACEM
NSE:ACC
NSE:DMART
NSE:GODREJPROP
Volume Turnover (T/O) Breakout (B/O) Test PF:
Week 10th - 02nd Aug to 6th Aug
Weekly Relative Return:
PF Return: -3.71%
NIFTY50: 2.48%
NIFTY500: 1.49%
Cumulative Indexed Relative Return:
PF Return: 6.43%
NIFTY50: 5.33%
NIFTY500: 5.33%
Trade Stats:
Total Trades: 118
Win Trades: 53
Loss Trades: 65
Biggest Win: 17.63%
Biggest Loss: -11.89%
Average Trade: 0.29%
Avg. Win Trade: 5.98%
Avg. Loss Trade: -4.35%
% Win Trades: 44.92%
% Loss Trades: 55.08%
PF for 9th Aug to 13th Aug will be shared tomorrow.
Disc. - Entries are recorded at 10 AM on Mondays and exits at 3PM on Fridays. This strategy is in testing phase and not a recommendation to buy/sell.
I have started testing different P&C of parameters as well. Testing 7 for now.
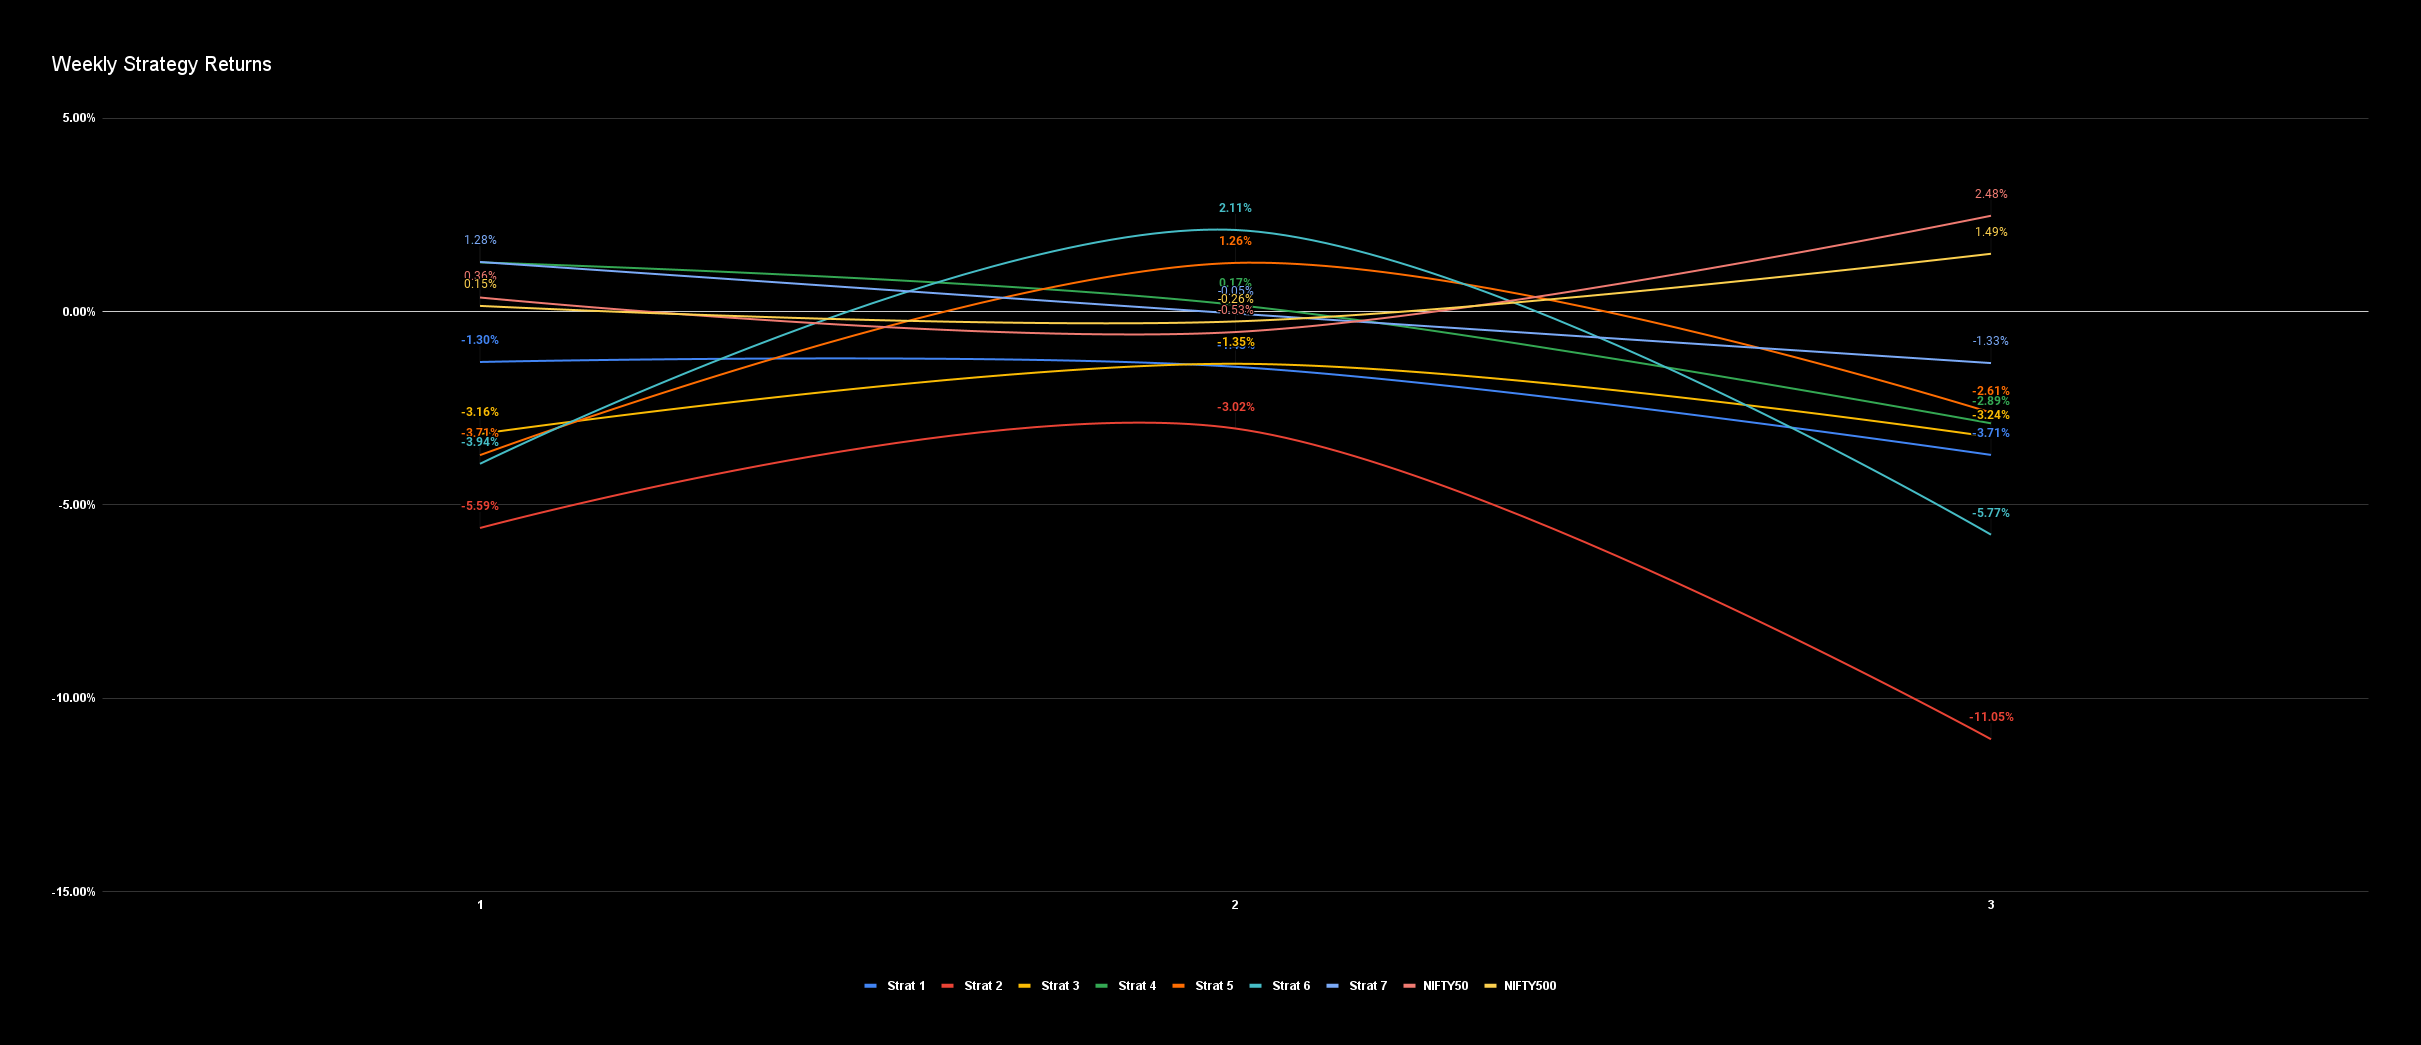
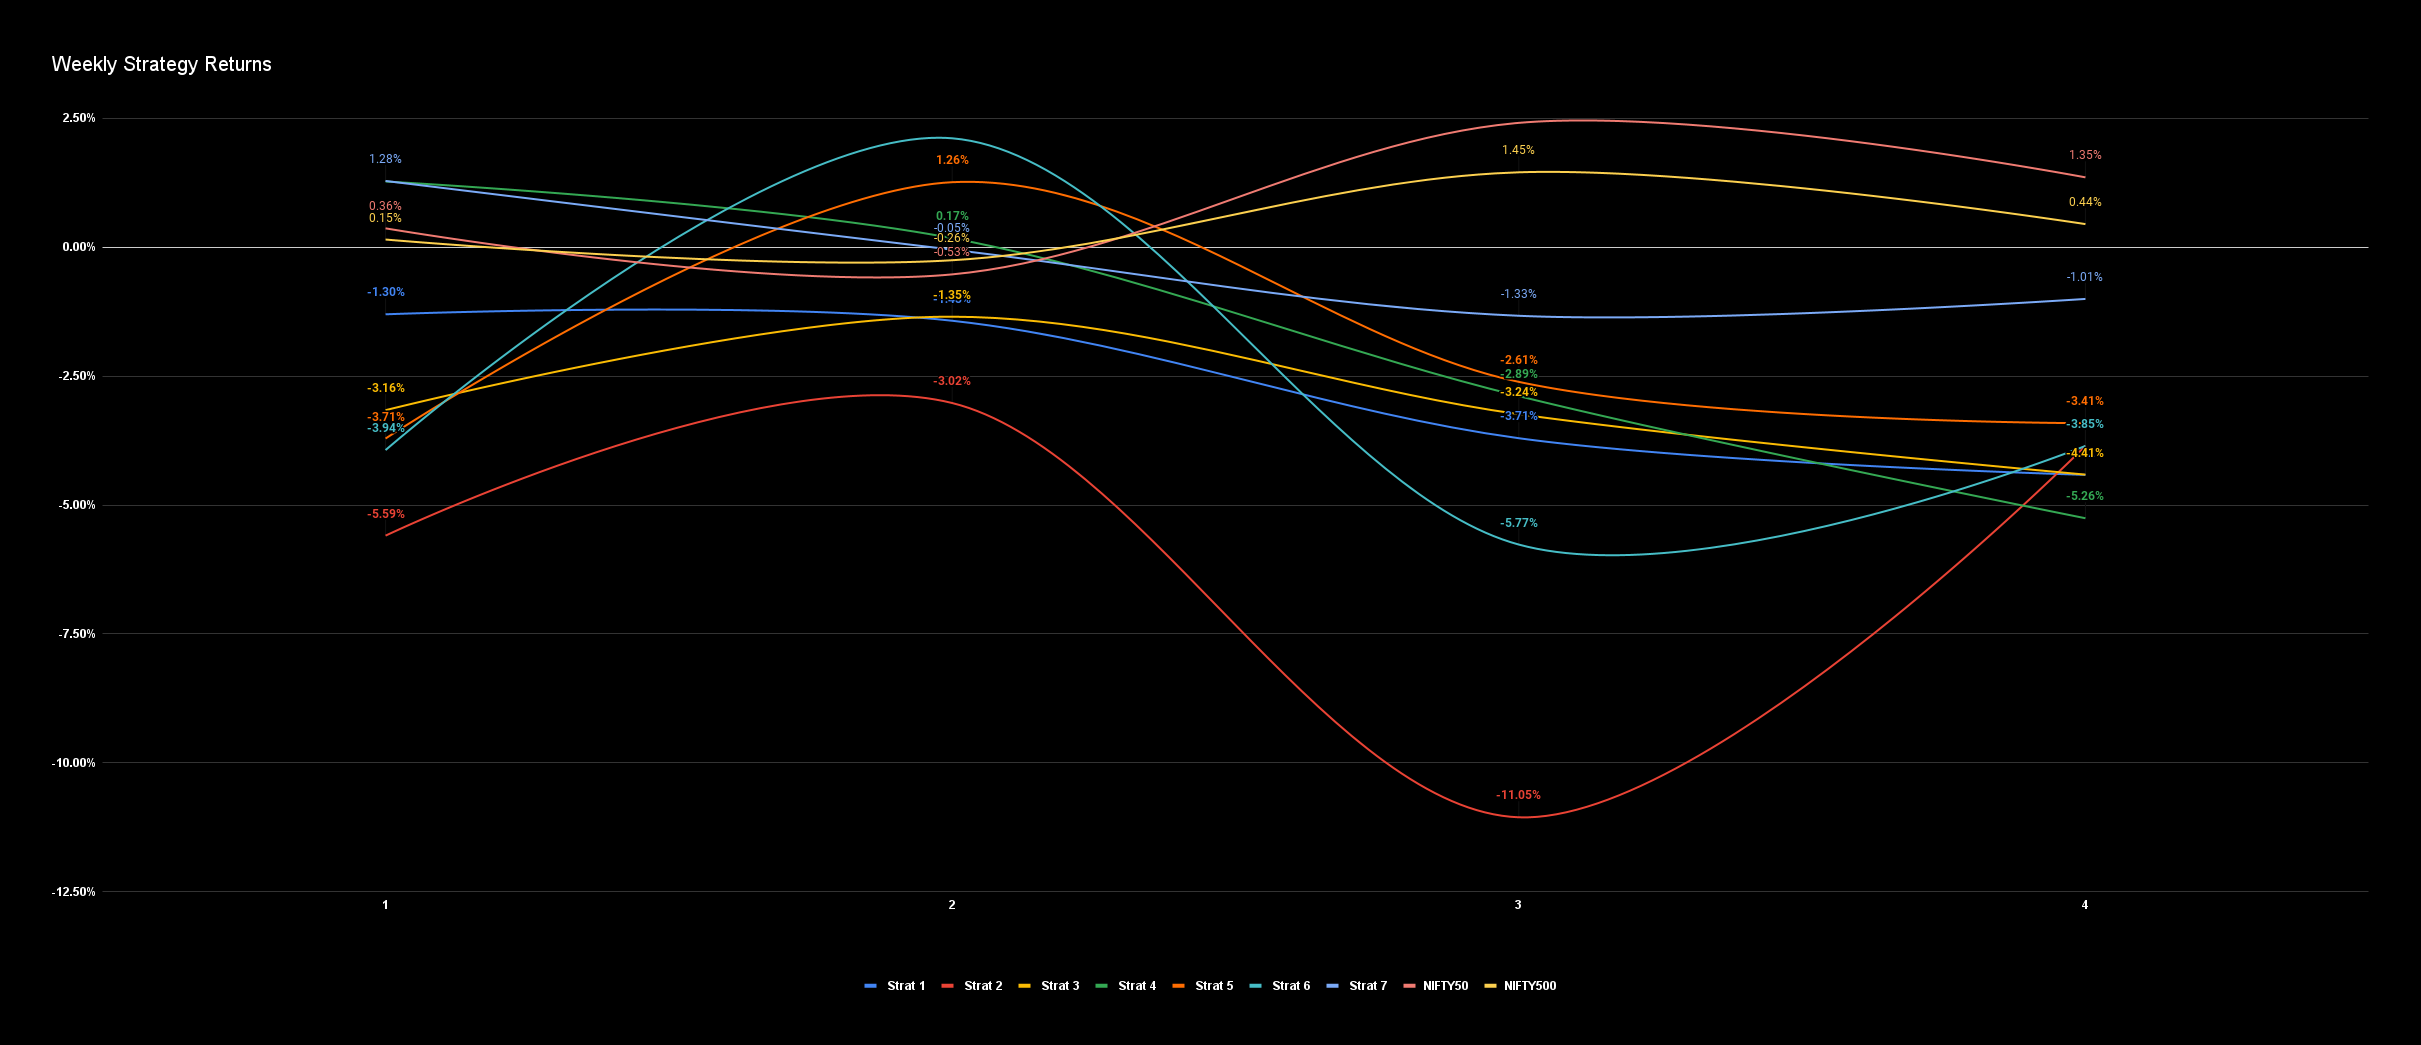
Weekly Relative Return:
Strat 1: -3.71%
Strat 2: -11.05%
Strat 3: -3.24%
Strat 4: -2.89%
Strat 5: -2.61%
Strat 6: -5.77%
Strat 7: -1.33%
NIFTY50: 2.48%
NIFTY500: 1.49%
Cumulative Indexed Relative Return:
Strat 1: 93.68
Strat 2: 81.43
Strat 3: 92.44
Strat 4: 98.51
Strat 5: 94.95
Strat 6: 92.43
Strat 7: 99.88
NIFTY50: 102.3
NIFTY500: 101.38
Comments: Performance relative to indices diverged this week as majority of strategy portfolios were composed of small caps. Strat 2 has been a stark underperformer, it chooses stocks which are have shown the greatest divergence in terms of volume breakout. There could be some element of quick mean reversion here. Strat 4 is the polar opposite of this, it removes the top divergent stocks and picks the remaining. This has shown better performance in 3 weeks. Strat 7 doing best but still underperforming the benchmarks. This strat is based on ATHs.
PF for 9th Aug to 13th Aug
Strat 1:
NSE:IIFLWAM
NSE:TATAINVEST
NSE:VTL
NSE:GODREJIND
NSE:BASF
Strat 2:
NSE:IIFLWAM
NSE:TATAINVEST
NSE:BASF
Strat 3:
NSE:BASF
NSE:IIFLWAM
NSE:SUVENPHAR
NSE:TATAINVEST
NSE:JKTYRE
NSE:NILKAMAL
NSE:NH
NSE:ROSSARI
Strat 4:
NSE:VTL
NSE:GODREJIND
Strat 5:
NSE:BASF
NSE:IIFLWAM
NSE:TATAINVEST
NSE:NH
NSE:TATACHEM
NSE:METROPOLIS
Strat 6:
NSE:IIFLWAM
NSE:TATAINVEST
NSE:BASF
Strat 7:
NSE:RHIM
NSE:ZENSARTECH
NSE:TECHM
NSE:SUVENPHAR
NSE:BASF
NSE:TATAINVEST
NSE:IIFLWAM
NSE:SOLARINDS
NSE:KPITTECH
NSE:INFY
Volume Turnover (T/O) Breakout (B/O) Test PF:
Week 10th - 09th Aug to 13th Aug
Weekly Relative Return:
PF Return: -4.42%
NIFTY50: 1.35%
NIFTY500: 0.44%
Cumulative Indexed Relative Return:
PF Return: 1.73%
NIFTY50: 6.69%
NIFTY500: 5.75%
Trade Stats:
Total Trades: 123
Win Trades: 53
Loss Trades: 70
Biggest Win: 17.63%
Biggest Loss: -11.89%
Average Trade: 0.10%
Avg. Win Trade: 5.98%
Avg. Loss Trade: -4.35%
% Win Trades: 43.09%
% Loss Trades: 56.91%
PF for 16th Aug to 20th Aug will be shared tomorrow.
Disc. - Entries are recorded at 10 AM on Mondays and exits at 3PM on Fridays. This strategy is in testing phase and not a recommendation to buy/sell.
I have started testing different P&C of parameters as well. Testing 7 for now.
Weekly Relative Return:
Strat 1: -4.42%
Strat 2: -3.85%
Strat 3: -4.41%
Strat 4: -5.26%
Strat 5: -3.41%
Strat 6: -3.85%
Strat 7: -1.01%
NIFTY50: 1.35%
NIFTY500: 0.44%
Cumulative Indexed Relative Return:
Strat 1: 89.54
Strat 2: 78.29
Strat 3: 88.36
Strat 4: 93.34
Strat 5: 91.71
Strat 6: 88.87
Strat 7: 98.88
NIFTY50: 103.62
NIFTY500: 101.79
Comments: Another week of poor performance by volume breakouts relative to the markets. This is a good time to test the strategies for DDs from market highs. While the trade stats are deteriorating with each week of loss, I expect the volume breakouts to gain back top position in stable and upward trending markets. Whether the strategy bombs before that remains to be seen.
PF for 16th Aug to 20th Aug
Strat 1:
NSE:TATAINVEST
NSE:INDOCO
NSE:MAHSCOOTER
NSE:VIPIND
NSE:STARCEMENT
NSE:SHRIRAMCIT
NSE:MAXHEALTH
Strat 2:
NSE:VIPIND
NSE:SHRIRAMCIT
NSE:MAXHEALTH
Strat 3:
NSE:VAKRANGEE
NSE:SHRIRAMCIT
NSE:VIPIND
NSE:MAXHEALTH
NSE:KPITTECH
NSE:TASTYBITE
Strat 4:
NSE:TATAINVEST
NSE:INDOCO
NSE:MAHSCOOTER
NSE:STARCEMENT
Strat 5:
NSE:SHRIRAMCIT
NSE:STARCEMENT
NSE:MAHSCOOTER
NSE:TASTYBITE
NSE:VIPIND
NSE:INDOCO
NSE:SUPRAJIT
Strat 6:
NSE:INDOCO
NSE:MAHSCOOTER
NSE:VIPIND
NSE:STARCEMENT
NSE:SHRIRAMCIT
Strat 7:
NSE:HCLTECH
NSE:BAJAJHLDNG
NSE:KPITTECH
NSE:BHARTIARTL
NSE:INFY
NSE:TATACONSUM
NSE:TCS
NSE:LT
NSE:WIPRO
NSE:TECHM
abimehrotra.wixsite.com/mysite/investmentreturncheatsheet…
Created a page of investment return sensitivity tables for quick use. One can use these to find the expected CAGR for a particular ENTRY/EXIT MULTIPLE, GROWTH RATE and TIMEFRAME of the investment.
3 Likes
Hi ,
Can you please share your view on ASAHI INDIA?
Thanks,
Satish
File is empty pls do upload the corporate governance issues file again
Hi @hack2abi ,
Can you please also share for ASAHI INDIA?
Thanks,
Satish
Share what for Asahi, Satish?
Hey man, great work!
Any link to the excel of the same? The google drive only opens up the JPEGs
That can’t be shared. This is to prevent anyone from rebranding and plagiarizing our work.
Even unlinked/non formula based numbers you wouldn’t be comfortable sharing?