
Yeah, I saw that. It was designed on a 27-inch screen. Wasn’t showing completely on my 24-inch one. You can try and zoom out to see the full page until I try and figure this out.
Tried that but not able to zoom out on the laptop.
https://abimehrotra.wixsite.com/mysite/nse100-dashboard
https://abimehrotra.wixsite.com/mysite/nsemidcap150-dashboard
https://abimehrotra.wixsite.com/mysite/nsesmlcap250-dashboard
https://abimehrotra.wixsite.com/mysite/allstocknse-dashboard
added a few more segmented dashboards
Data dump on microfinance sector. Let me know if you have any queries.
1 Like
Did some work on Debt funds. Assimilated data from Value research. Use the sheet PT Chart Final.
all-debt-funds-22-Jan-2021–16111.xlsx (823.9 KB)
1 Like
Simplest momentum screen on Screener. Copy-paste the below equation to the screener. Just rank the stocks in descending order of 1yr returns. You can add other filters to your liking. Then pick the top 10/20/30 as per your liking. Rebalance weekly/monthly/quarterly as per your liking. No need to pay an absurd fee to small case providers for something you can DIY. Especially important if you are starting with only a few lacs. The fee will eat into your return.
Return over 1year > 0
2 Likes
I have added some statistical analysis to the previous work I had done on Debt funds. You can find it in the sheet GF PT Chart. The data is only current up to today. It uses the different rolling period returns to calculate the statistics. I did the exercise for funds from HDFC only and chose only direct growth option. I have tried to cover one fund from each category. The win probability parameter uses a winning criterion as returns 7% CAGR in that time period. Let me know if you have any queries. Created on a 24 inch screen so best viewed on a screen of same size. You can either resize or zoom out if you are on a smaller screen.
all-debt-funds-22-Jan-2021–16111 Shared.xlsx (817.1 KB)
Created a shareable tool that should be able to calculate the XIRR of portfolio and compare against similar SIPs NIFTY50/500.
Please test and let me know if it breaks anywhere. Suggestions about improving further, adding more features are most welcome.
1 Like
https://abimehrotra.wixsite.com/mysite/nsemicrocap250-momentum-rankings
NSE Microcap250 rankings up now on the website.
https://abimehrotra.wixsite.com/mysite/nse750-momentum-rankings
NSE750 (NSE500+NSEMICROCAP250) rankings up now.
1 Like
Latest post.
1 Like
Hi Abi, Thanks for contributing valuable data and insights to the forum. I am quite new to the forum and actually looking for this kind of data to do an industry wide analysis… Is the data posted latest? or do you have any further data updates? I believe this is a great work. I have downloded the data today, will do some analysis in the coming days and ask you if I need any help…
Thank you very much.
The data in the industry analysis post will be the latest only up to the date it was posted on. That kind of analysis does not auto-update but is semi-automated. I have made it open for use to all and explained how they can update the data or build the comparison themselves from the screener.
Thank you very much, will explore it further…
https://abimehrotra.wixsite.com/mysite/volume-breakout-nse500
Hi,
I have been testing a new trading strategy based on volume breakouts on the NSE500 stock universe. It is a weekly traded strategy of equal-weighted stocks. The strategy is under testing for the past 5 weeks. I have been sharing the weekly portfolio on other public forums, will start sharing it actively here as well. The trading system is shared on the website above.
Here was the trading portfolio for the week gone by:
Weekly- 28th Jun to 2nd Jul
NSE:VENKEYS
NSE:HFCL
NSE:GODREJAGRO
NSE:GODFRYPHLP
NSE:JKPAPER
NSE:GREAVESCOT
NSE:INFIBEAM
NSE:IOB
NSE:CENTRALBK
NSE:GMRINFRA
NSE:TIMKEN
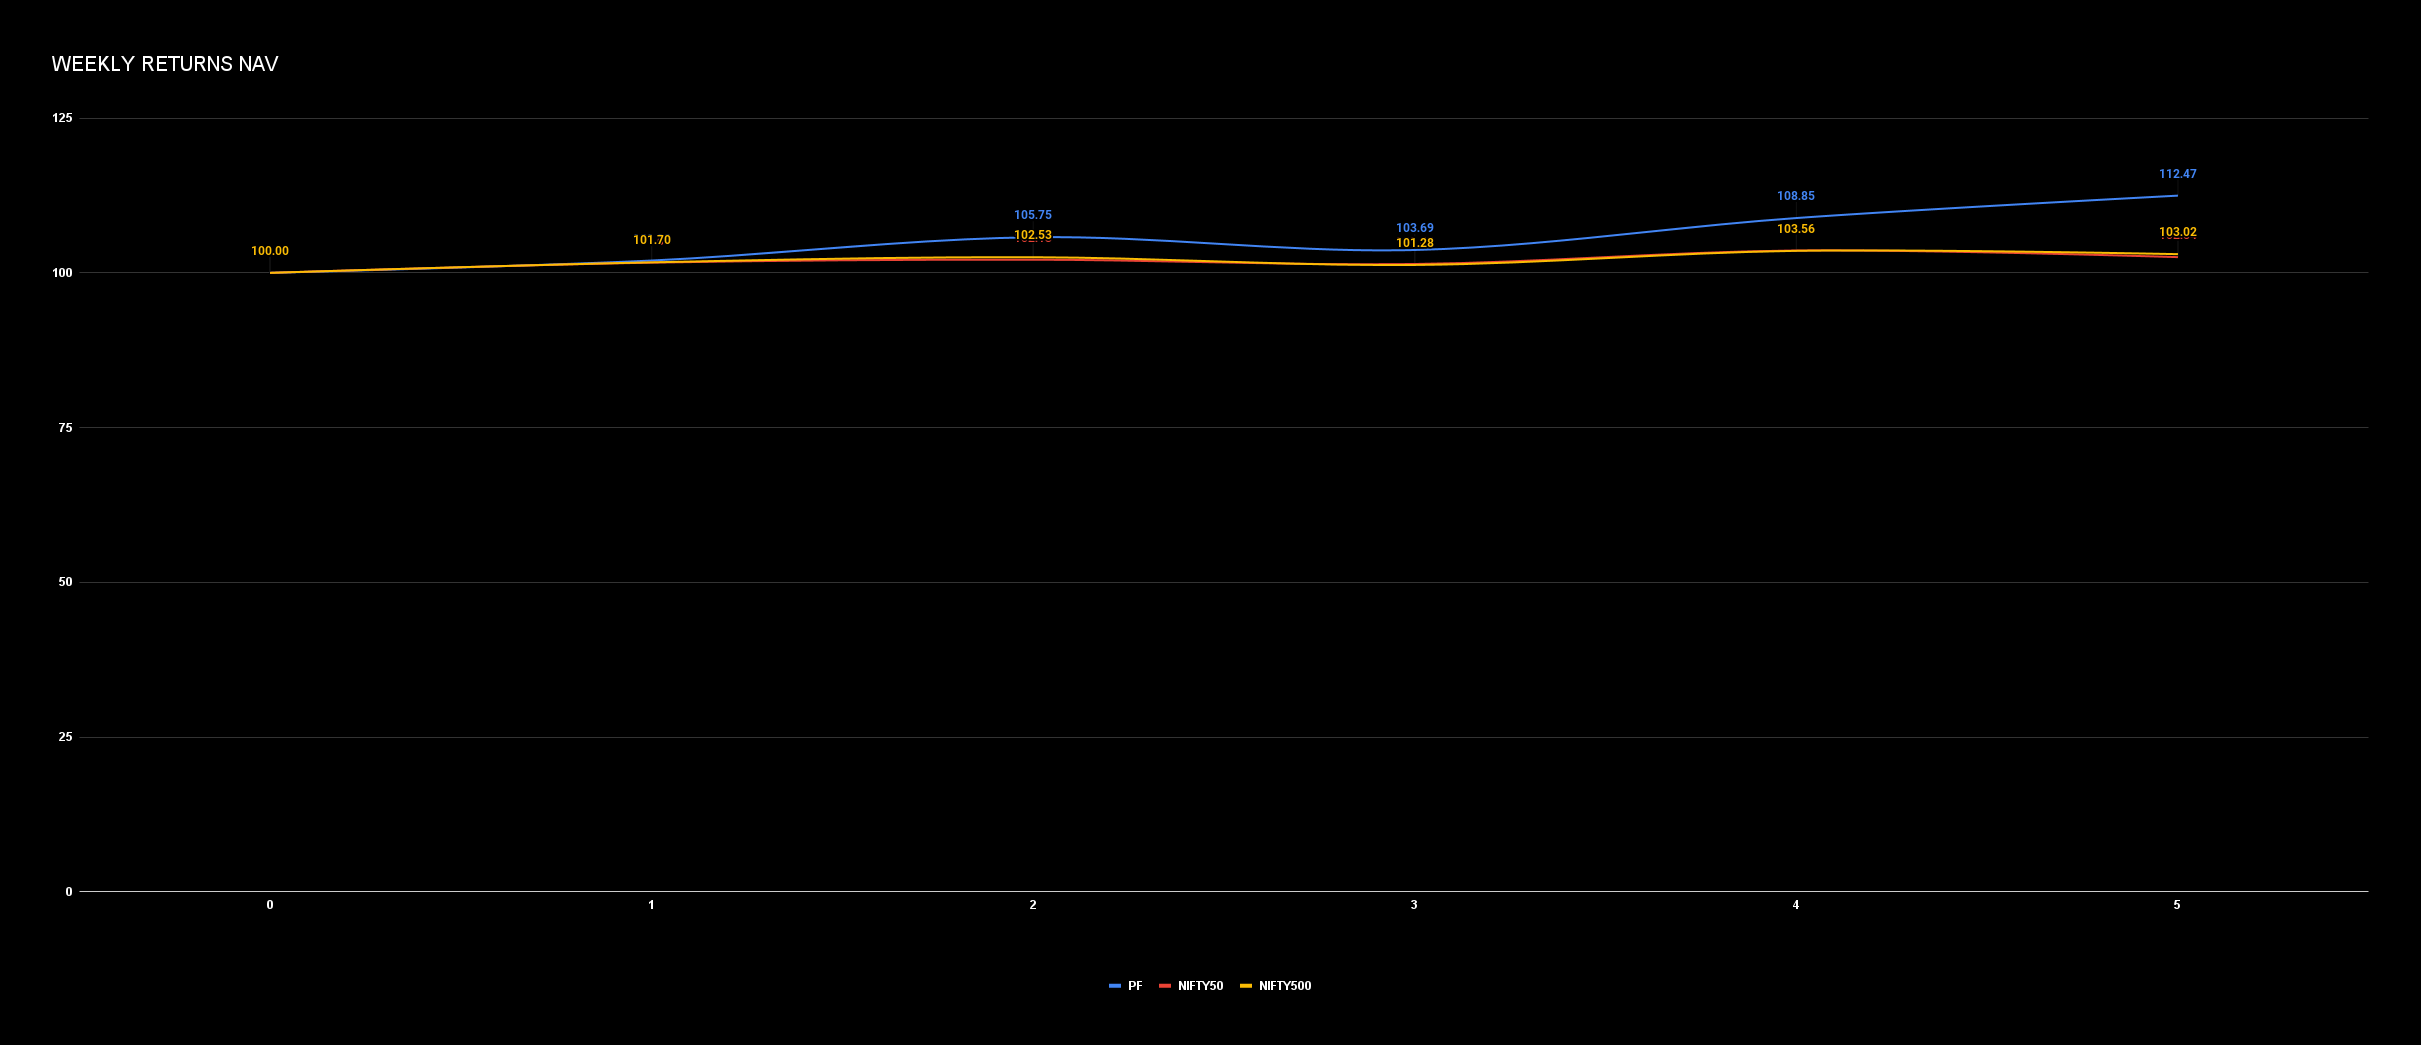
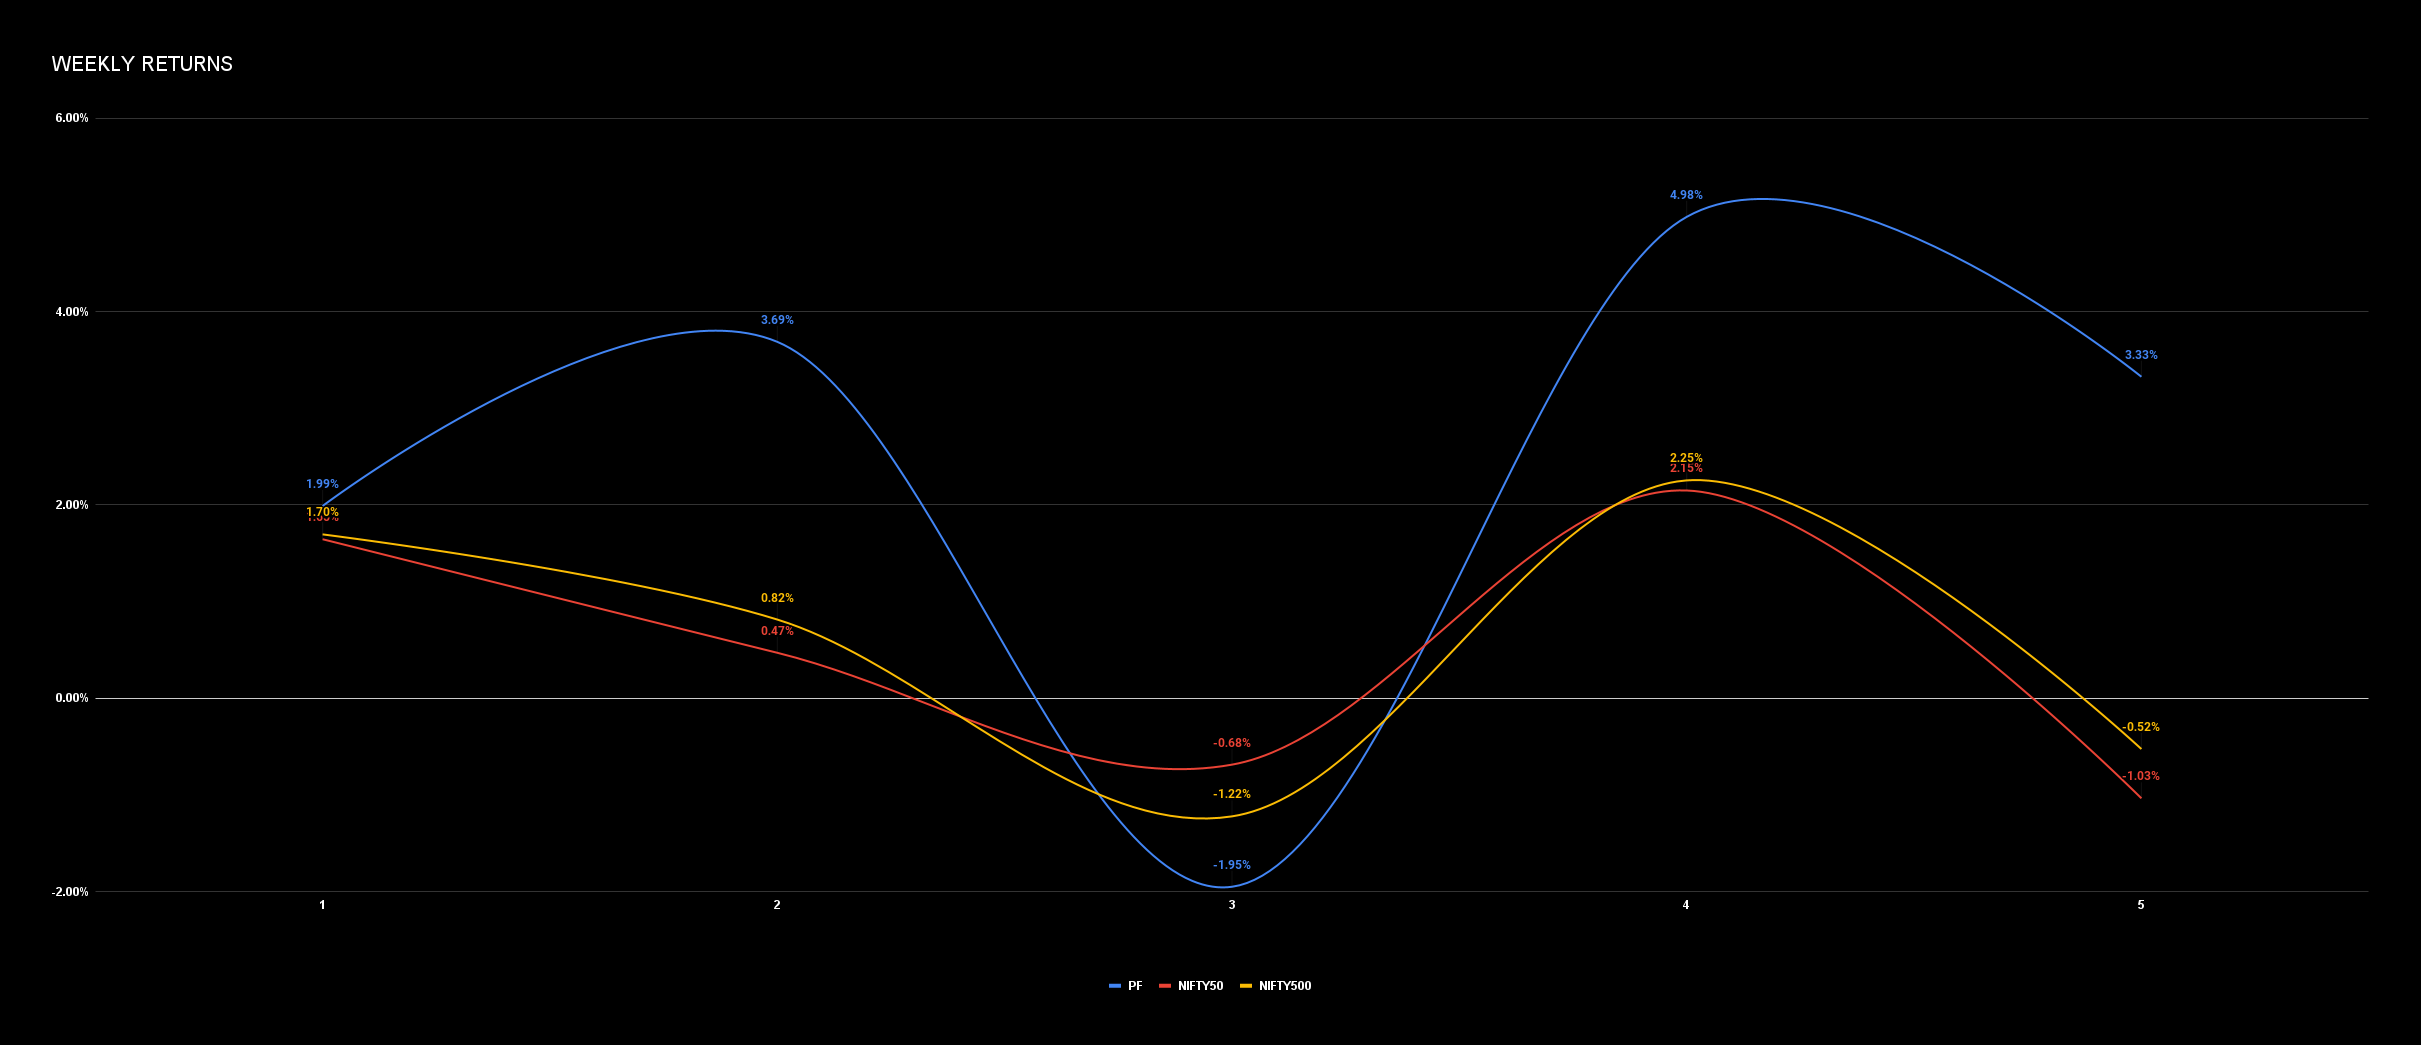
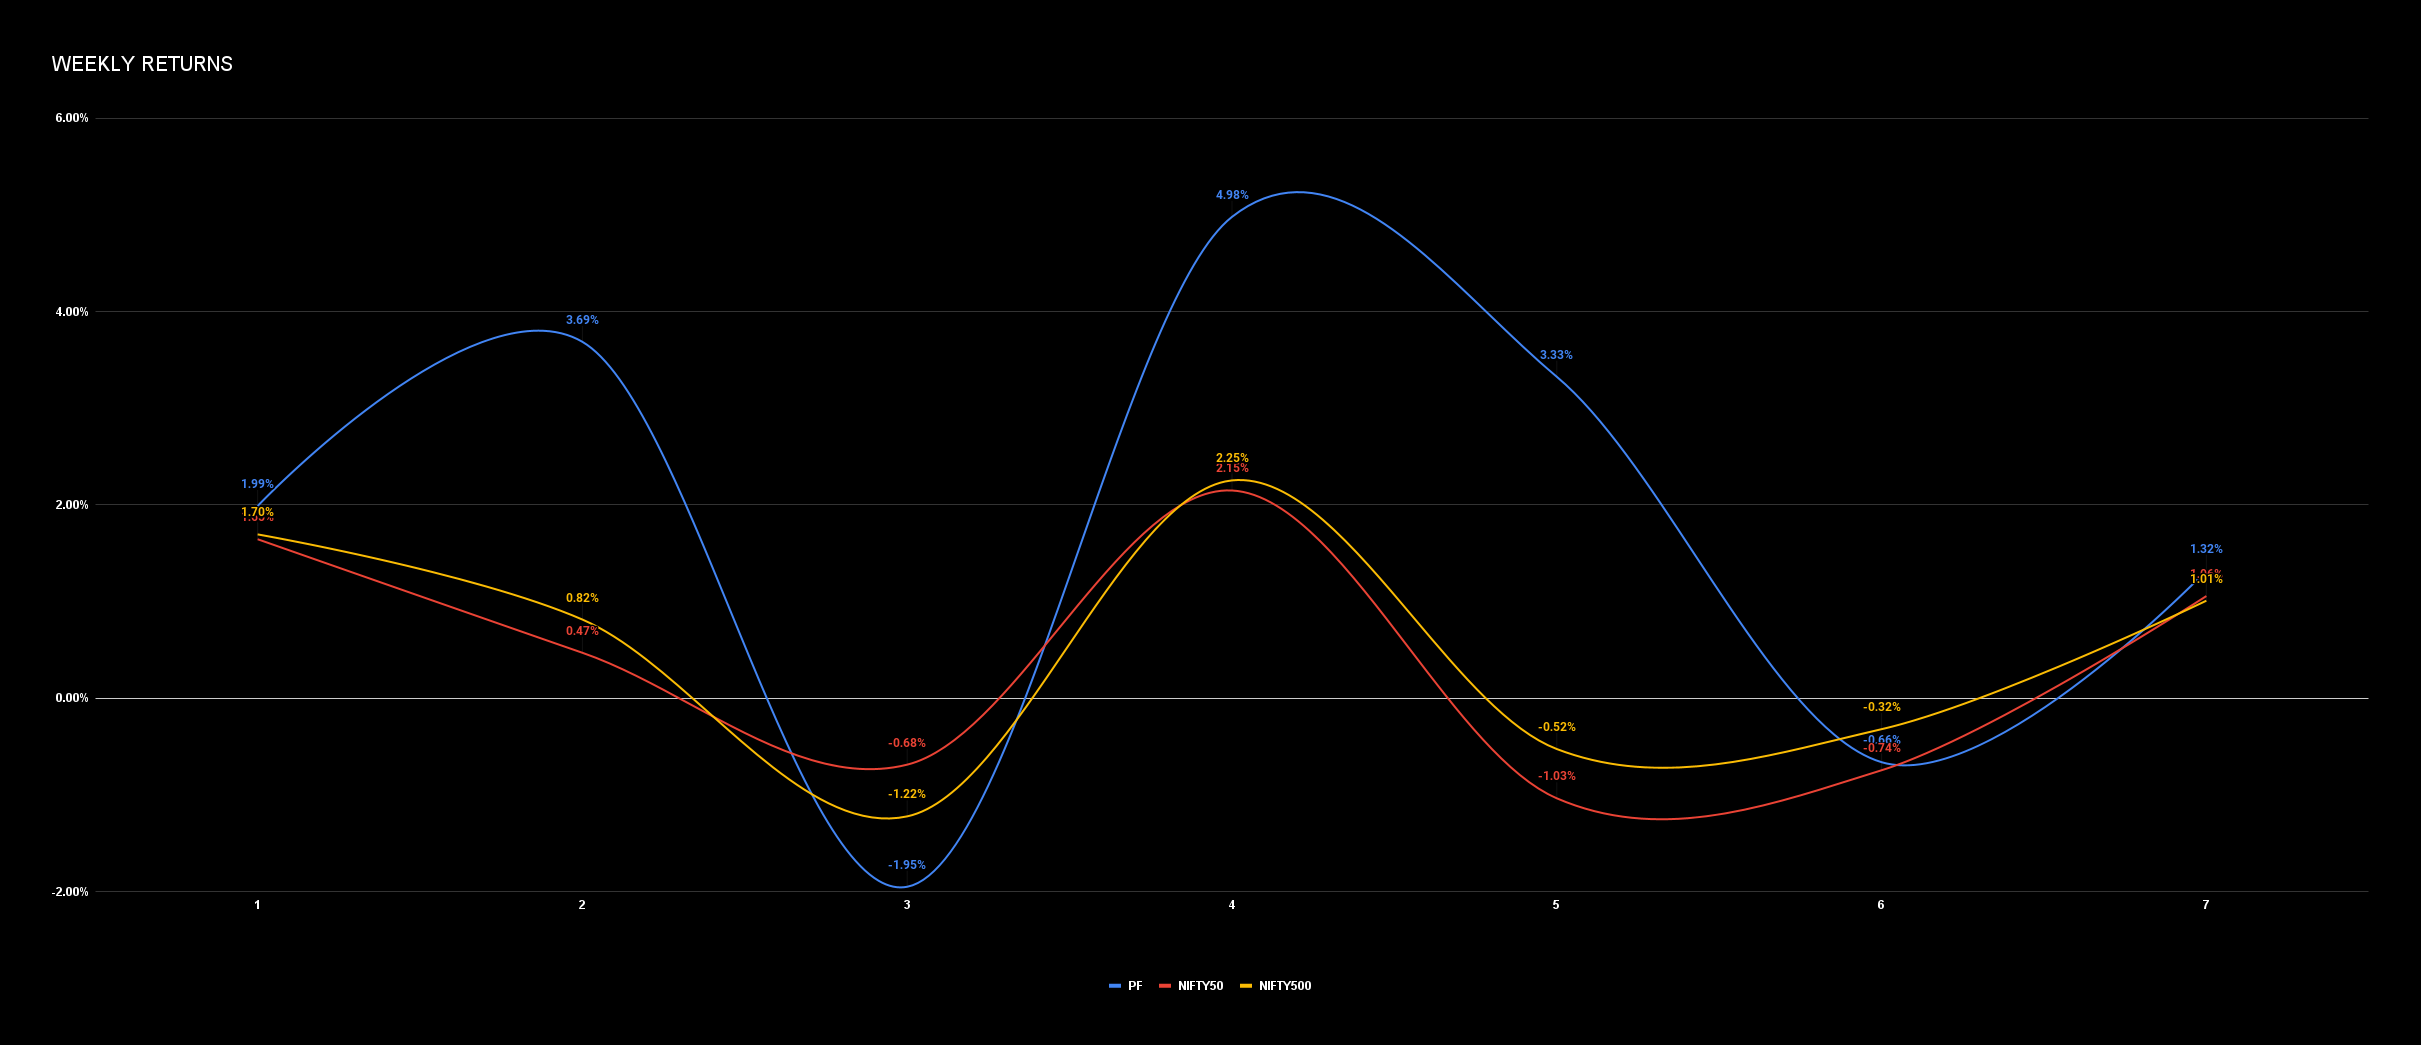
PF Return: 3.33%
NIFTY50: -1.03%
NIFTY500: -0.52%
Here are the trading picks for the coming week:
5th July to 9th July:
NSE:UFLEX
NSE:FINPIPE
NSE:THYROCARE
NSE:HAPPSTMNDS
NSE:PNCINFRA
NSE:KNRCON
NSE:INDOCO
NSE:JKPAPER
NSE:KSB
NSE:FSL
NSE:SWSOLAR
NSE:IOB
NSE:REDINGTON
NSE:KEI
NSE:CENTRALBK
NSE:ZENSARTECH
Disc. - Performance up to week 4 based on OPEN/CLOSE prices. From week 5 entries are recorded at 10 AM on Mondays and exits at 3 PM on Fridays. This strategy is in the testing phase and not a recommendation to buy/sell.
1 Like
Hi @hack2abi , Had a quick look at the website, great job, very impressive. Thank you for sharing. Could you please clarify the following:
- Is there any specific browser to be used to view the sheet as I am not able to view the left most or right most column (None visible left of “Industry” and right of “Size” columns… (I checked scrolling, still not able to view)…
- Where is the data taken for comparison/updates (5 min updates…)
- Does this strategy picks up stocks based on the screening formula once in a week or it gets updated continuously?
- The 1st row (date updated 2 July…) has few numbers above the columns… for ex, corresponding row above the column “% Curr. T/O Z-Score” has a number “13”, what does that mean?
Thanks,
Baski
Baski,
- The website was designed on a 27in screen. I am newb at wix design and could not get it to resize as per user’s screen. Maybe you can try zooming out in the browser.
- Data is calculated by me.
- I tried updating in continuously using google app script but the amount of data doesn’t let it update automatically. So I update it once a week manually.
- Those are count of numbers based on certain conditions. For my personal use.
This exercise is just to publicly record the trading performance. Please do not depend on it as trading advice. Timely and accurate updates of ranking are not guaranteed and depends on the data provider.
1 Like
Hi @hack2abi Abi, thanks for your response, much appreciated… Regards, Baski
Weekly- 5th July to 9th July
NSE:UFLEX
NSE:FINPIPE
NSE:THYROCARE
NSE:HAPPSTMNDS
NSE:PNCINFRA
NSE:KNRCON
NSE:INDOCO
NSE:JKPAPER
NSE:KSB
NSE:FSL
NSE:SWSOLAR
NSE:IOB
NSE:REDINGTON
NSE:KEI
NSE:CENTRALBK
NSE:ZENSARTECH
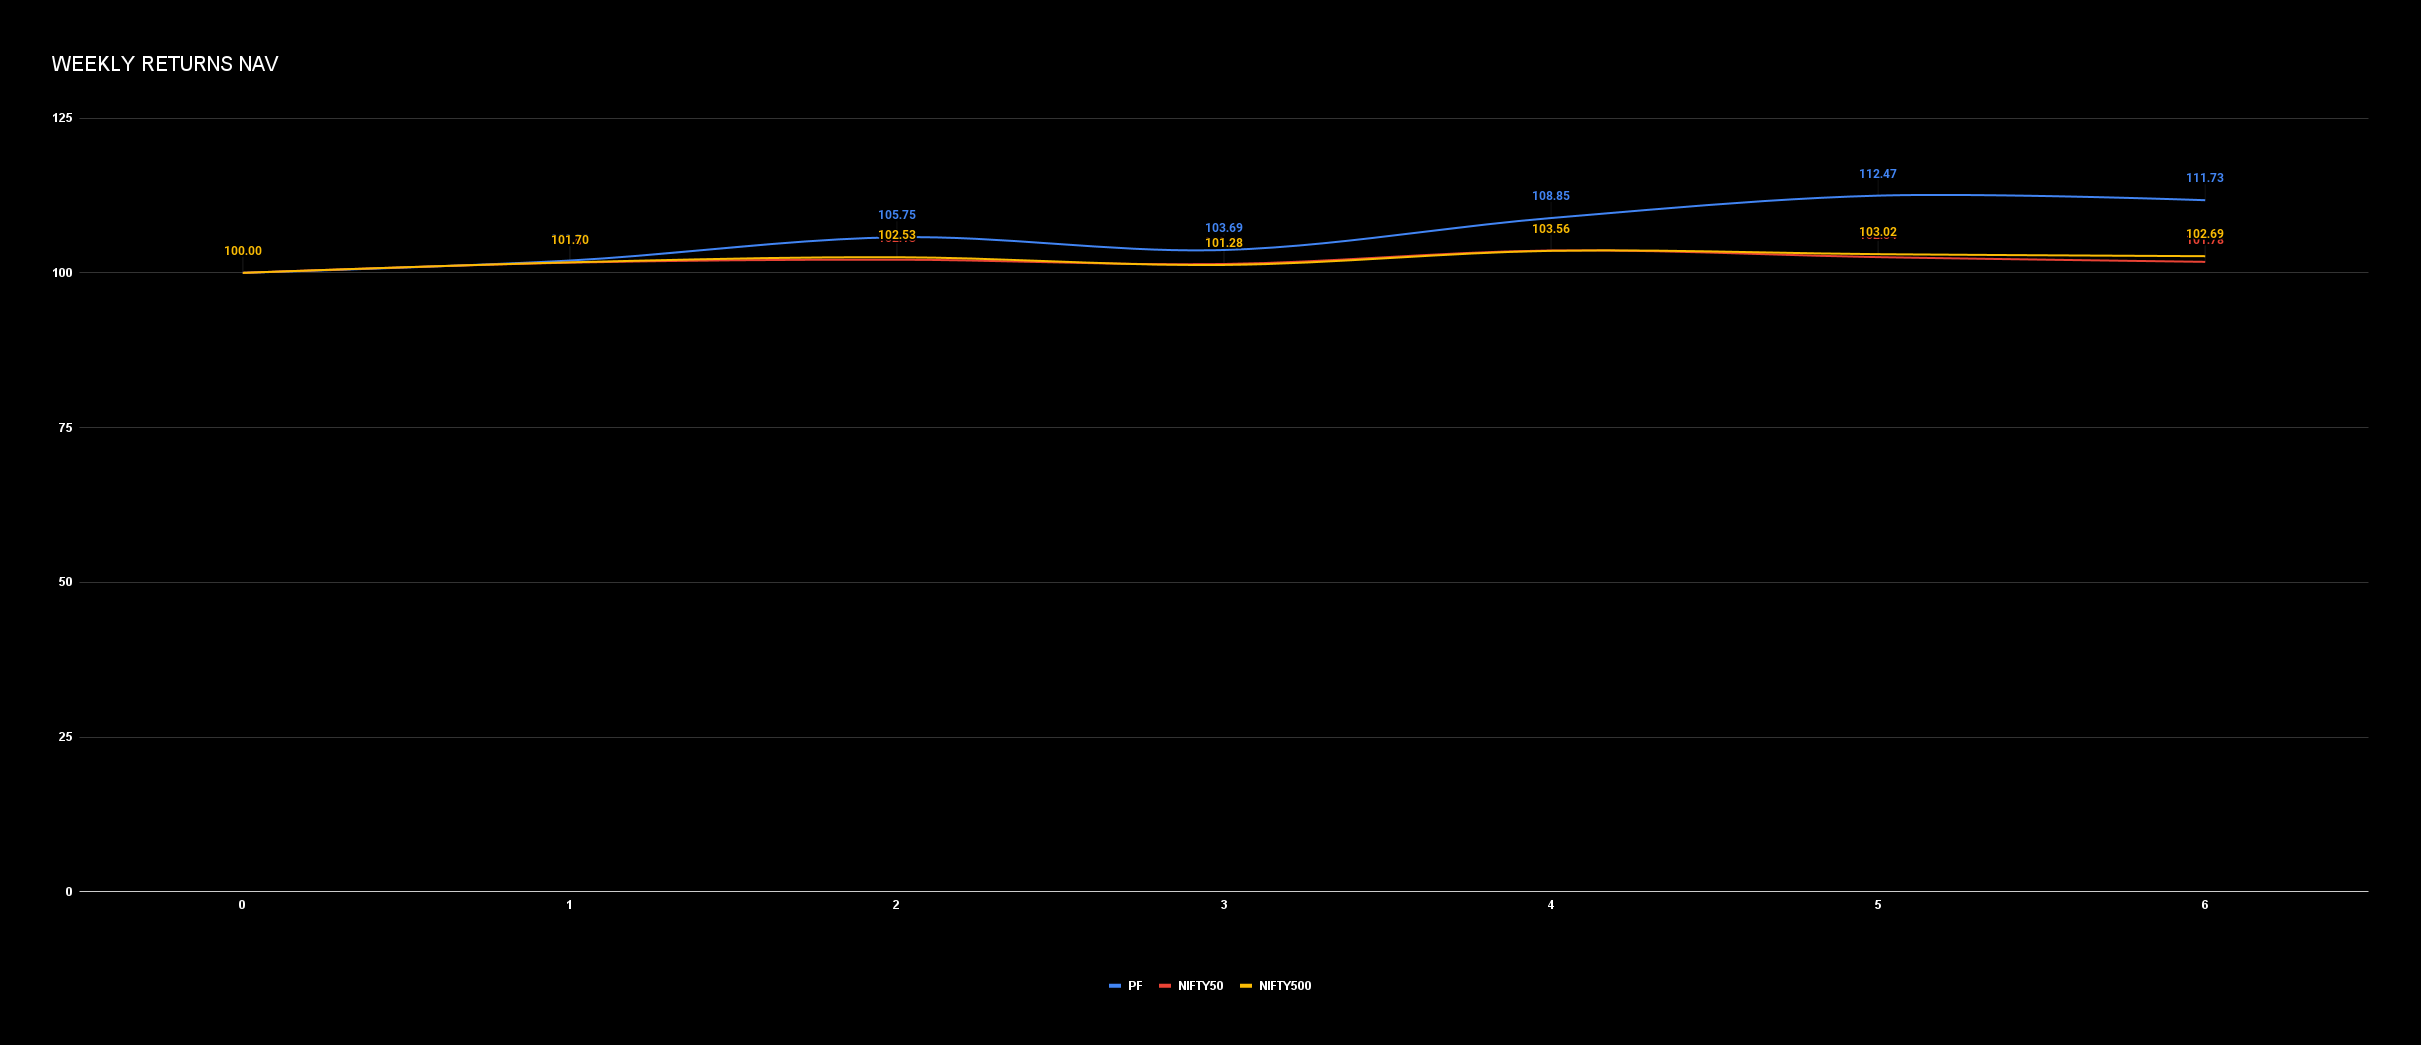
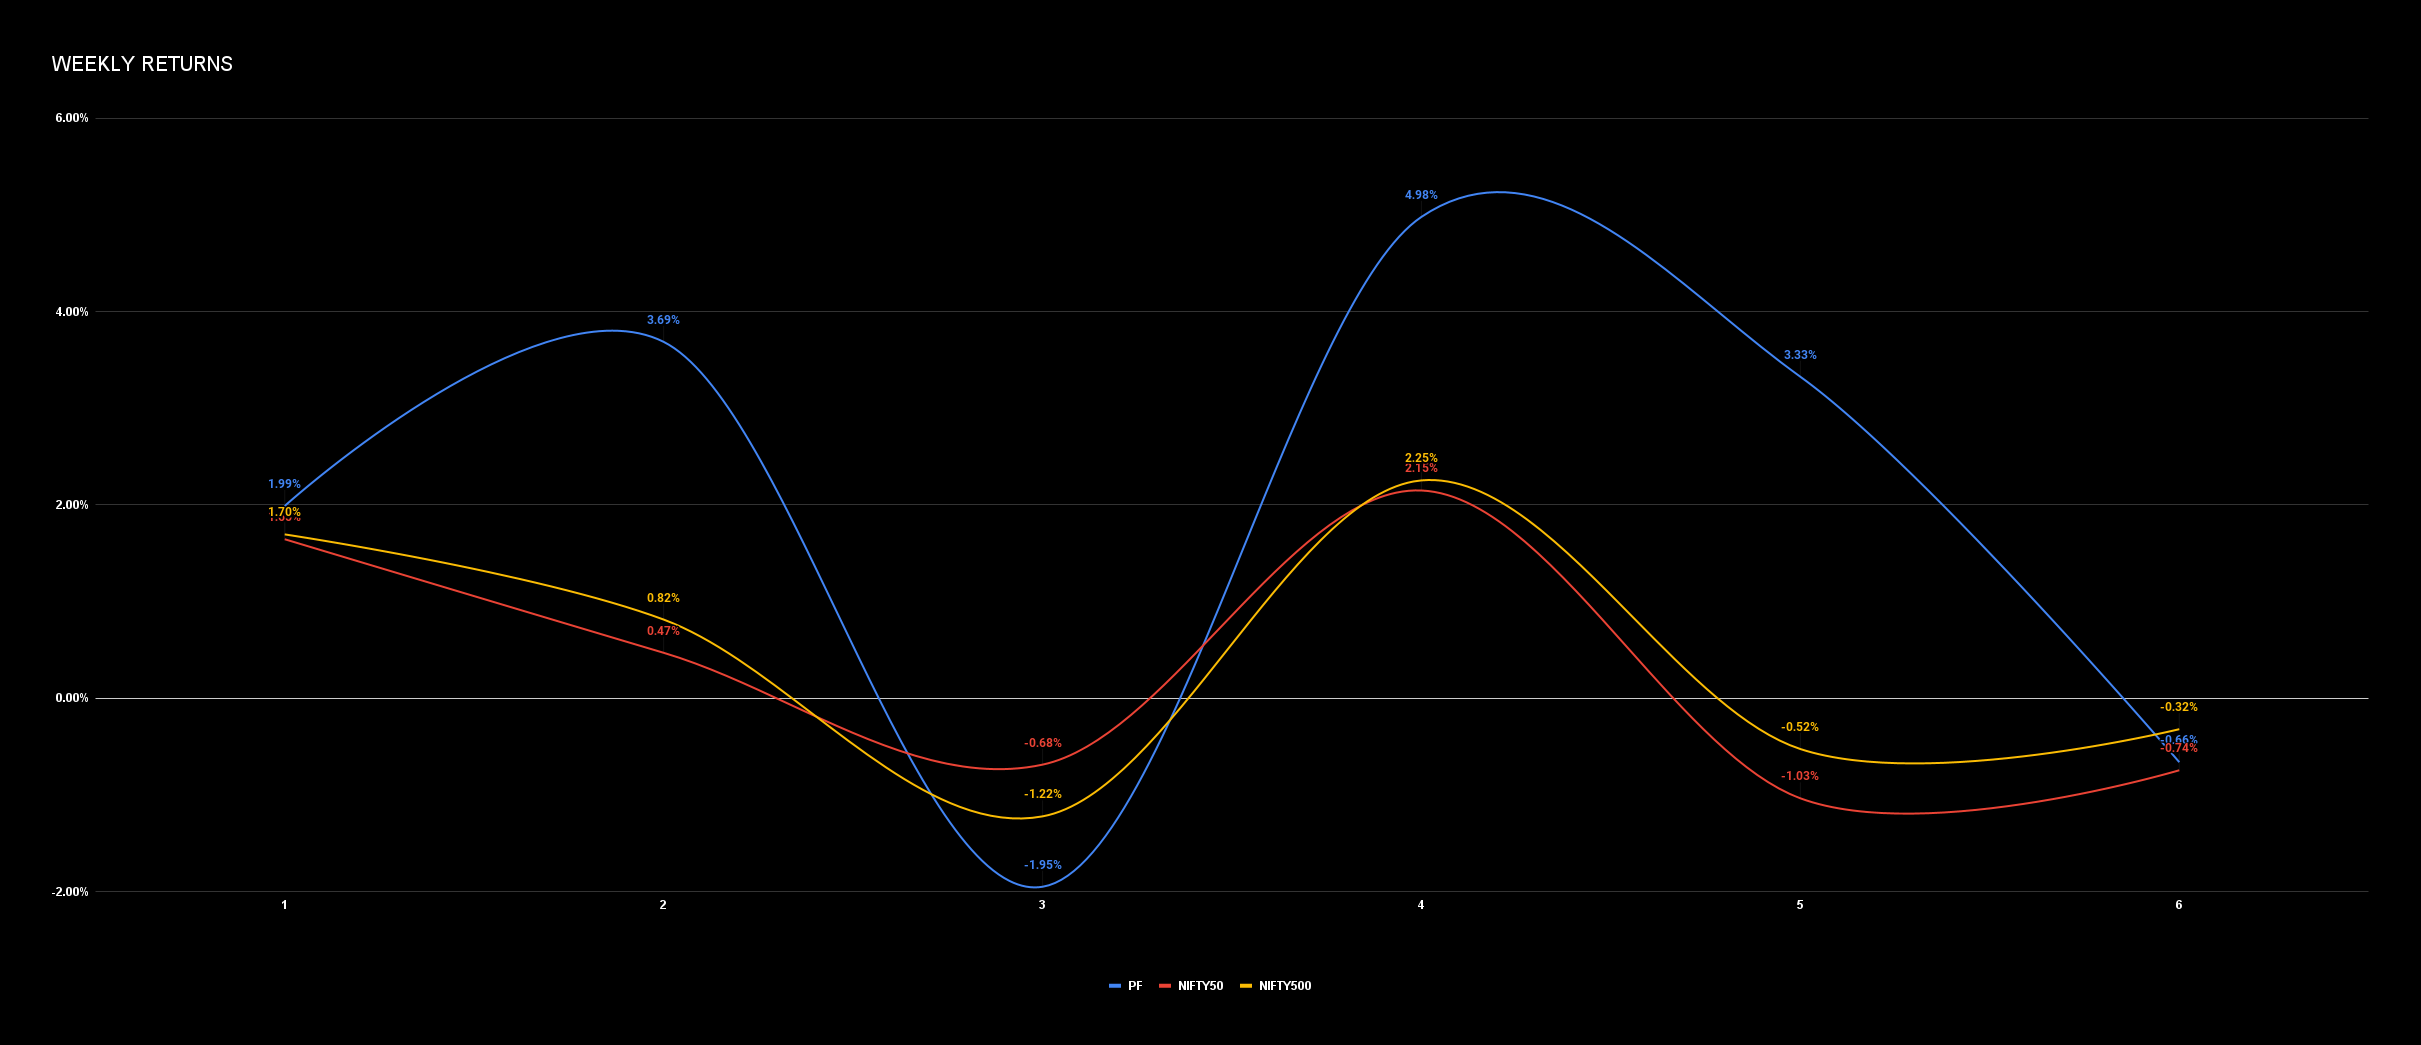
Return: -0.66%
NIFTY50: -0.74%
NIFTY500: -0.32%
PF for 12th July to 16th July
NSE:TASTYBITE
NSE:MHRIL
NSE:MOTILALOFS
NSE:NESCO
NSE:HFCL
NSE:RAIN
NSE:SOBHA
NSE:SIS
NSE:REDINGTON
NSE:EQUITAS
Disc. - Performance up to week 4 based on OPEN/CLOSE prices. From week 5 entries are recorded at 10 AM on Mondays and exits at 3PM on Fridays. This strategy is in testing phase and not a recommendation to buy/sell.
Apologies for the delay. I forgot to post it here on time.
Volume Turnover (T/O) Breakout (B/O) Test PF:
Week 7 - 12th July to 16th July
NSE:TASTYBITE
NSE:MHRIL
NSE:MOTILALOFS
NSE:NESCO
NSE:HFCL
NSE:RAIN
NSE:SOBHA
NSE:SIS
NSE:REDINGTON
NSE:EQUITAS
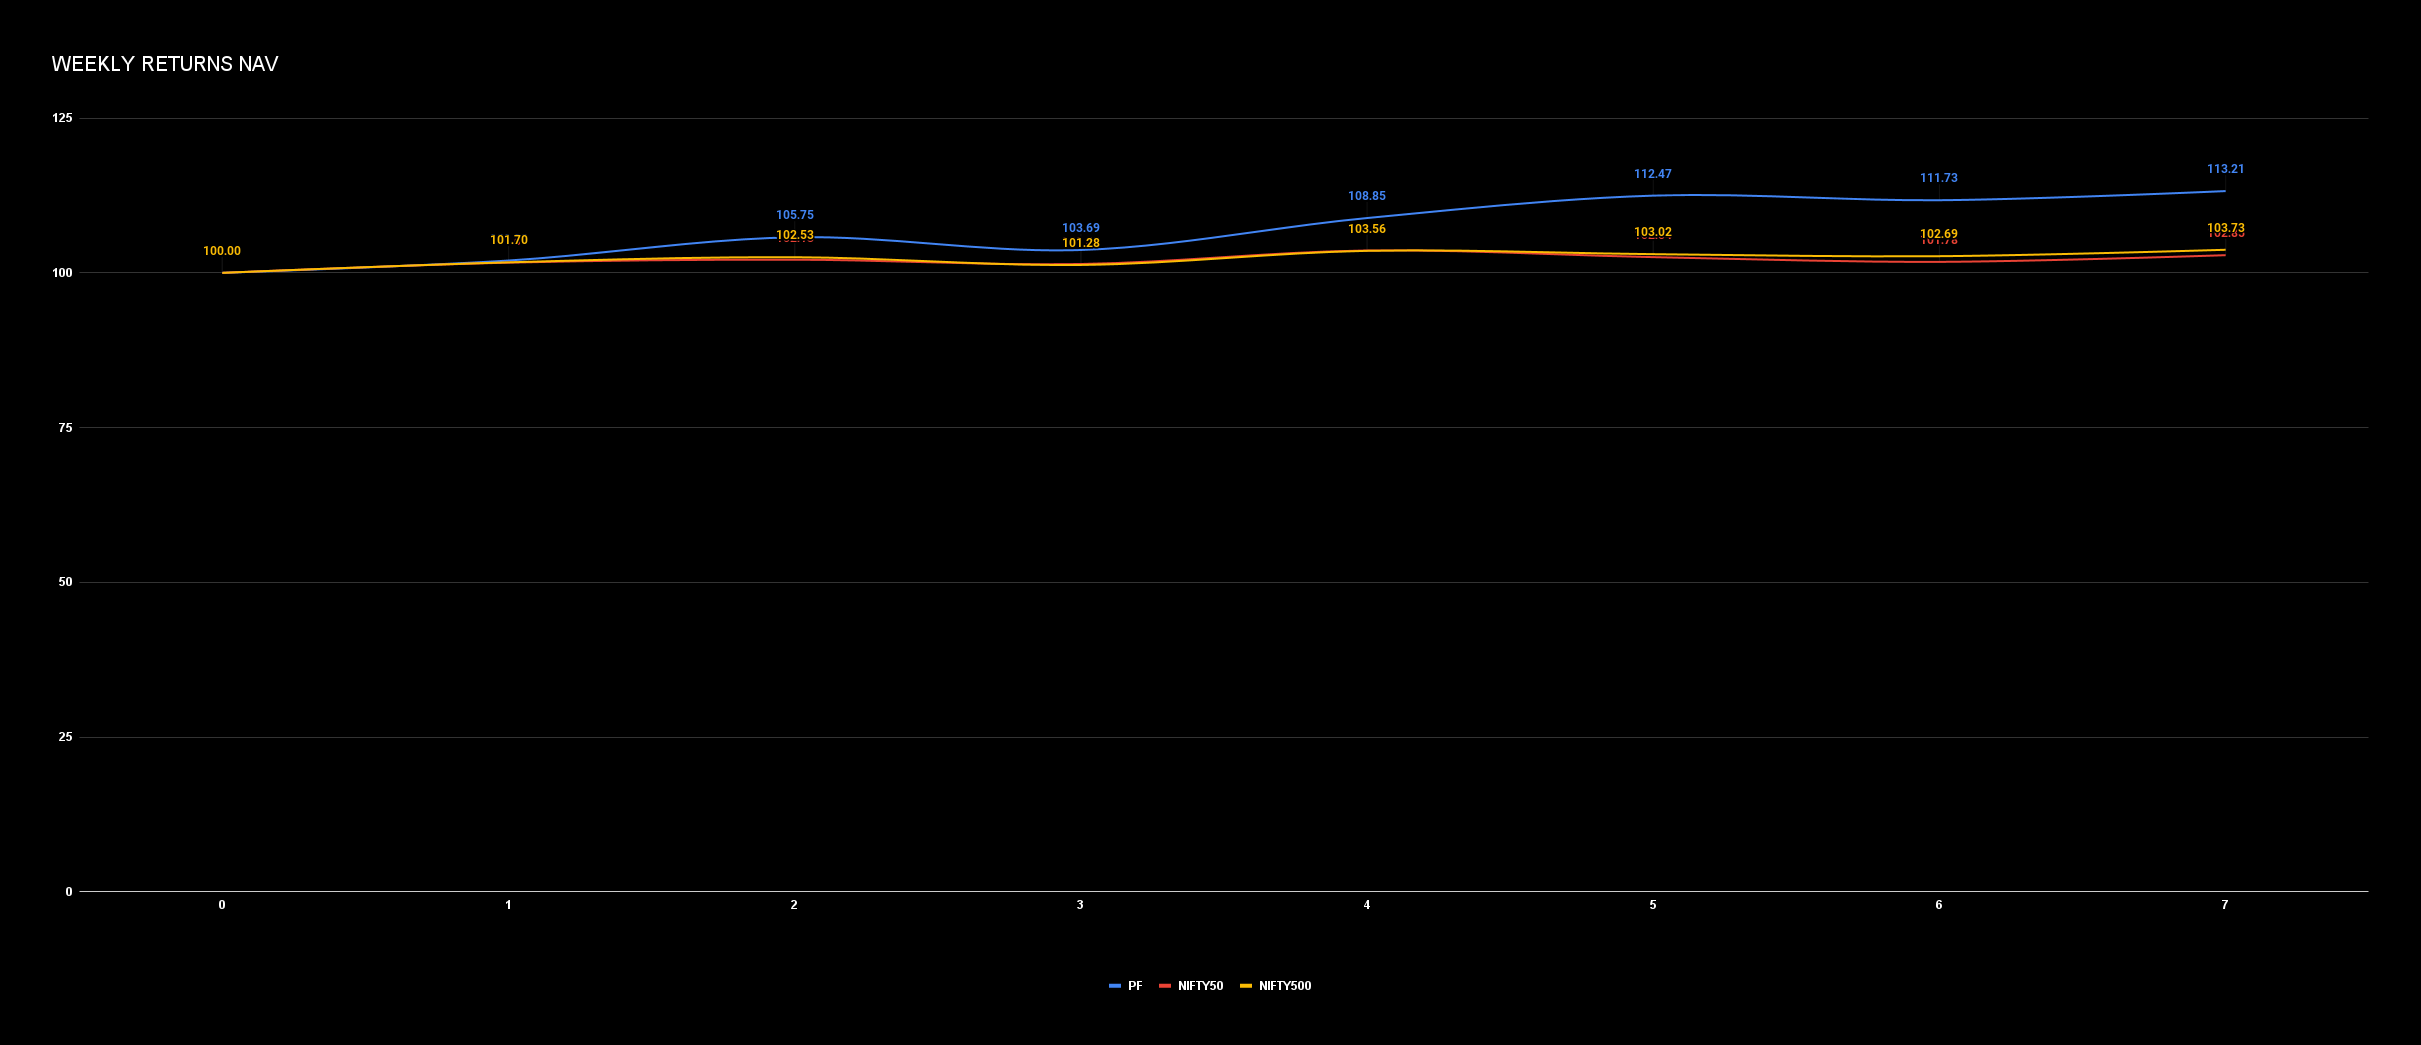
Weekly Relative Return:
PF Return: 1.32%
NIFTY50: 1.06%
NIFTY500: 1.01%
Cumulative Indexed Relative Return:
PF Return: 13.21%
NIFTY50: 2.85%
NIFTY500: 3.73%
Trade Stats:
Total Trades: 82
Win Trades: 40
Loss Trades: 42
Biggest Win: 17.63%
Biggest Loss: -10.59%
Average Trade: 1.30%
Avg. Win Trade: 6.45%
Avg. Loss Trade: -3.60%
% Win Trades: 48.78%
% Loss Trades: 51.22%
PF for 19th July to 23rd July will be shared tomorrow.
Disc. - Performance up to week 4 based on OPEN/CLOSE prices. From week 5 entries are recorded at 10 AM on Mondays and exits at 3PM on Fridays. This strategy is in testing phase and not a recommendation to buy/sell.
PF for 19th July to 23rd July:
NSE:CAMS
NSE:MOTILALOFS
NSE:BSE
NSE:JMFINANCIL
NSE:WELSPUNIND
NSE:MHRIL
NSE:SOBHA
NSE:VTL
NSE:LTTS
NSE:IBREALEST
NSE:SUNCLAYLTD
NSE:ZENSARTECH
NSE:VMART
NSE:CDSL
NSE:WELCORP
NSE:SUNTECK
1 Like